. 2017 Oct 24;8(1):1124.
doi: 10.1038/s41467-017-00923-8.

Global hotspots and correlates of emerging zoonotic diseases

Affiliations

Global hotspots and correlates of emerging zoonotic diseases

Toph Allen et al. Nat Commun. .

Abstract

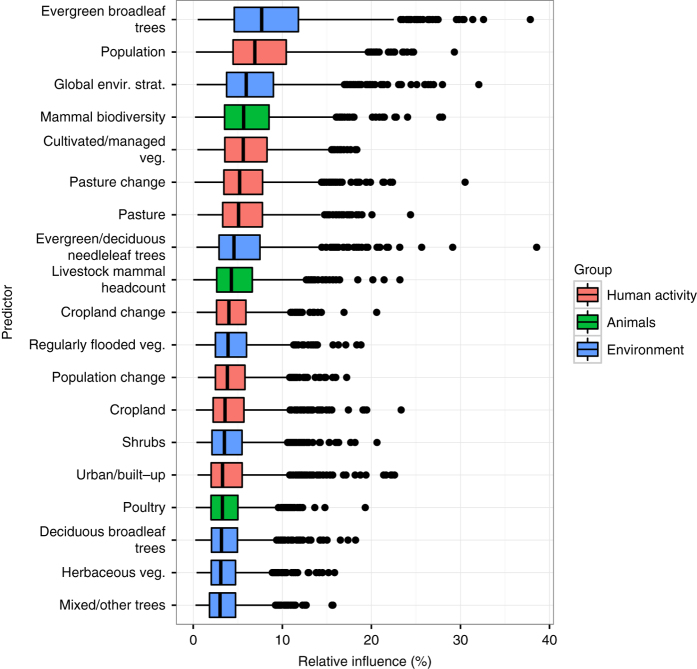
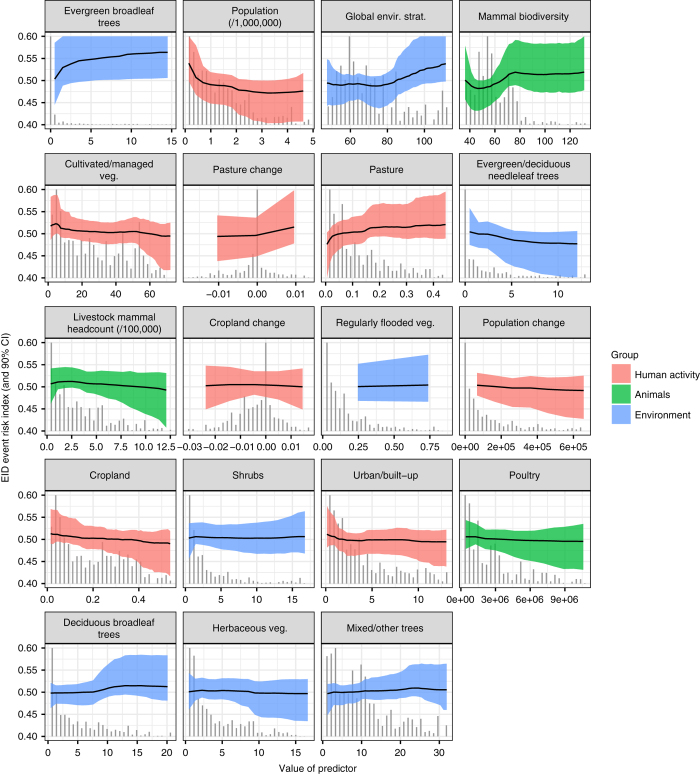
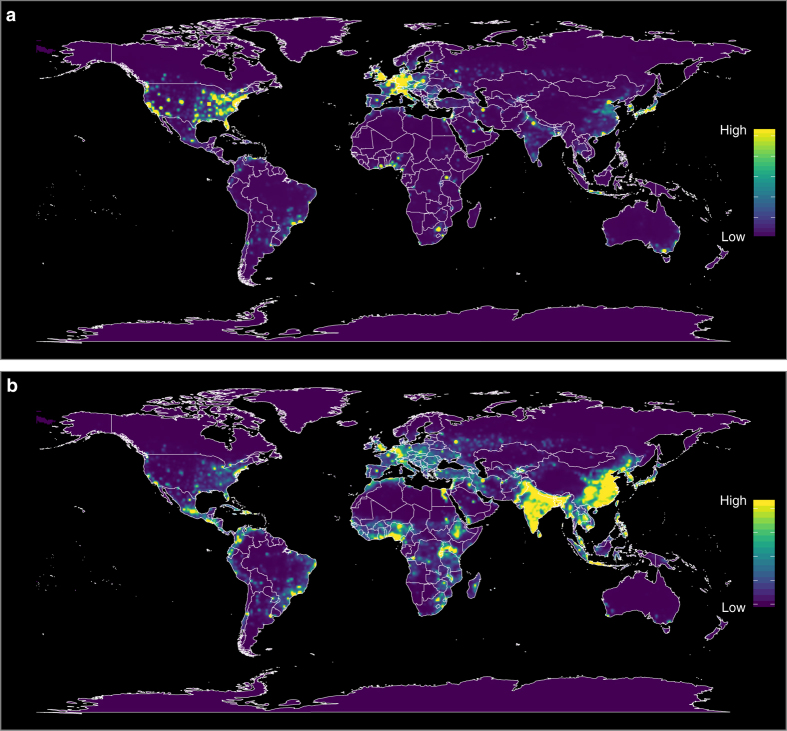
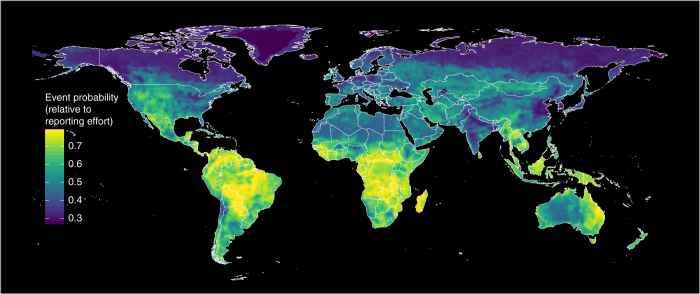
Zoonoses originating from wildlife represent a significant threat to global health, security and economic growth, and combatting their emergence is a public health priority. However, our understanding of the mechanisms underlying their emergence remains rudimentary. Here we update a global database of emerging infectious disease (EID) events, create a novel measure of reporting effort, and fit boosted regression tree models to analyze the demographic, environmental and biological correlates of their occurrence. After accounting for reporting effort, we show that zoonotic EID risk is elevated in forested tropical regions experiencing land-use changes and where wildlife biodiversity (mammal species richness) is high. We present a new global hotspot map of spatial variation in our zoonotic EID risk index, and partial dependence plots illustrating relationships between events and predictors. Our results may help to improve surveillance and long-term EID monitoring programs, and design field experiments to test underlying mechanisms of zoonotic disease emergence.


Conflict of interest statement

The authors declare no competing financial interests.

Figures

Fig. 1
Fig. 1
The relative influence of predictors on EID event occurrence probability. The box plots show the spread of relative influence across 1000 replicate model runs to account for uncertainty in EID event location (see above). Whiskers represent the minimum or maximum datum up to 1.5 times the inter-quartile range beyond the lower or upper quartile. BRTs do not provide p-values or coefficients, but rank variables by their relative influence in explaining variation in the outcome
Fig. 2
Fig. 2
Partial dependence plots showing the influence on zoonotic EID events for all predictors in the weighted boosted regression tree model, ordered by relative influence. X axes show the range from the 10th to 90th percentiles of sampled values of predictors (e.g., number of mammal species per grid square formammalian richness, or proportion of grid cell for a land cover type). Gray bars show histograms of predictor distribution along X axes. Y axes show the effect on the EID event risk index from that variable. Black lines show the median and colored areas show the 90% confidence intervals, computed using a bootstrap resampling regime incorporating uncertainty in EID event locations. The overall prevalence of our outcome, which indexes EID event risk, is fixed by the resampling regime between 0 and 1, with a mean at 0.5. Y axes are centered around the mean and scaled to 0.1 above and below. Partial dependence plots display the response for an individual variable in the model while holding all other variables constant, . They allow a visualization of what are mostly non-linear relationships between drivers and the EID event risk index (in this case, after reporting effort is factored out.). See Supplementary Note 3 for results of the model unweighted by reporting effort
Fig. 3
Fig. 3
Heat maps of predicted relative risk distribution of zoonotic EID events. a shows the predicted distribution of new events being observed (weighted model output with current reporting effort); b shows the estimated risk of event locations after factoring out reporting bias (weighted model output reweighted by population). See Fig. 4 for raw weighted model output. Maps were created using standard deviation scaling, with the color palette scaled to 2.5 s.d. above and below the mean
Fig. 4
Fig. 4
Heat map of weighted model response, i.e., EID risk relative to reporting effort. Value indicates the binomial probability that a grid cell sampled at that location will contain an EID event as opposed to a background sample, when drawing equal numbers of absence and background samples weighted by reporting effort (see Methods section). This layer was weighted by reporting effort to produce the “observed” EID risk index map (Fig. 3a) and by population to produce the risk index map with bias factored out (Fig. 3b)

References

    1. Heymann DL, et al. Global health security: the wider lessons from the west African Ebola virus disease epidemic. Lancet. 2015;385:1884–1901. doi: 10.1016/S0140-6736(15)60858-3. - DOI - PMC - PubMed
    1. Morens DM, Fauci AS. Emerging infectious diseases in 2012: 20 years after the institute of medicine report. Mbio. 2012;3:e00494–12. - PMC - PubMed
    1. Pike J, Bogich TL, Elwood S, Finnoff DC, Daszak P. Economic optimization of a global stategy to reduce the pandemic threat. Proc. Natl Acad. Sci. USA. 2014;111:18519–18523. doi: 10.1073/pnas.1412661112. - DOI - PMC - PubMed
    1. Jones KE, et al. Global trends in emerging infectious diseases. Nature. 2008;451:990–993. doi: 10.1038/nature06536. - DOI - PMC - PubMed
    1. Wolfe ND, Dunavan CP, Diamond J. Origins of major human infectious diseases. Nature. 2007;447:279–283. doi: 10.1038/nature05775. - DOI - PMC - PubMed

Publication types