. 2017 Oct 24;8(1):1122.
doi: 10.1038/s41467-017-01195-y.

DNA N6-methyladenine is dynamically regulated in the mouse brain following environmental stress

Affiliations

DNA N6-methyladenine is dynamically regulated in the mouse brain following environmental stress

Bing Yao et al. Nat Commun. .

Abstract

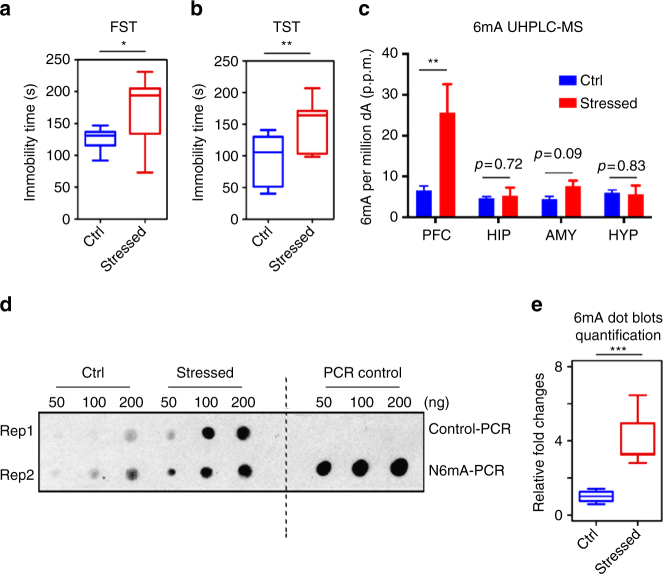
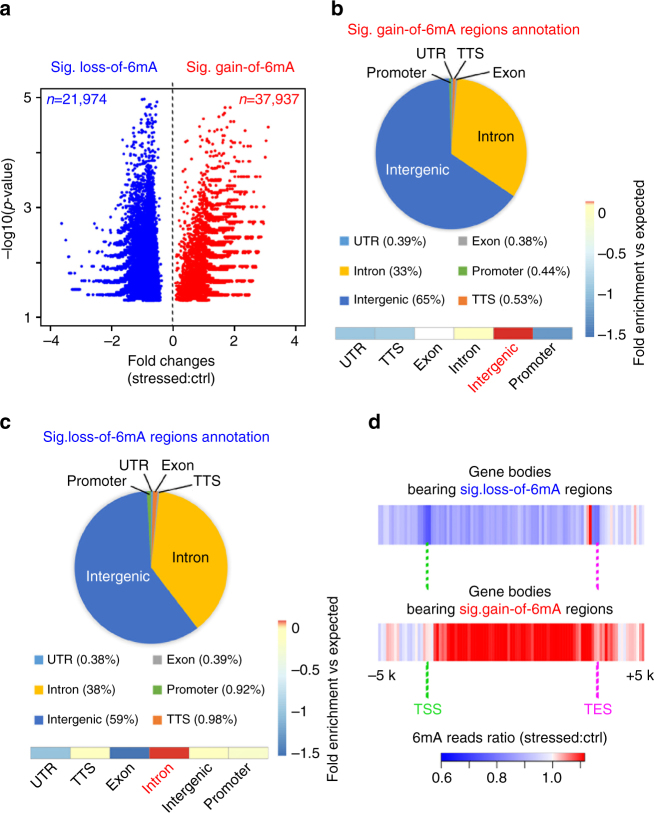
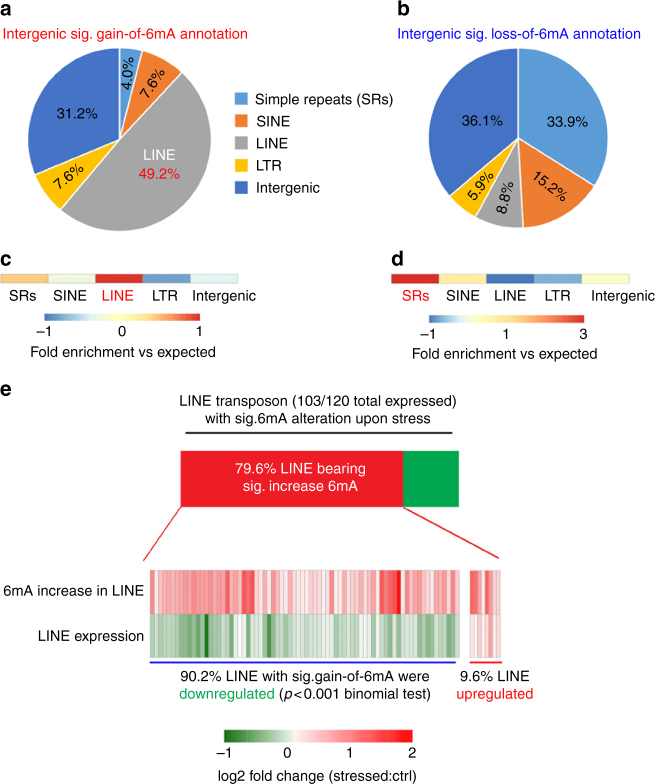
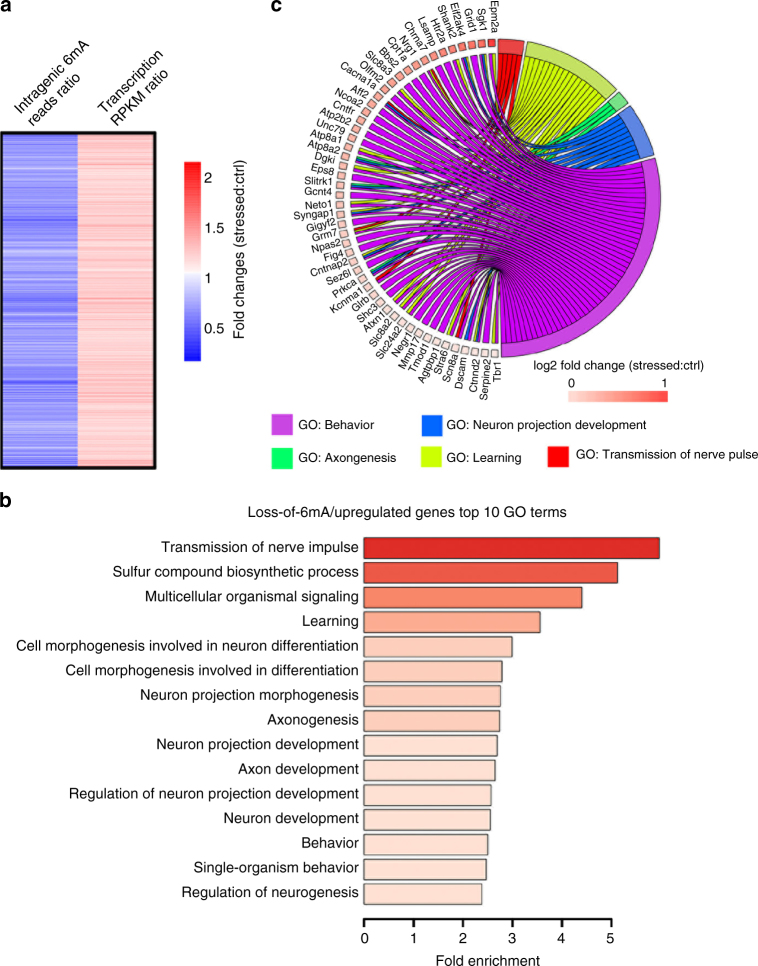
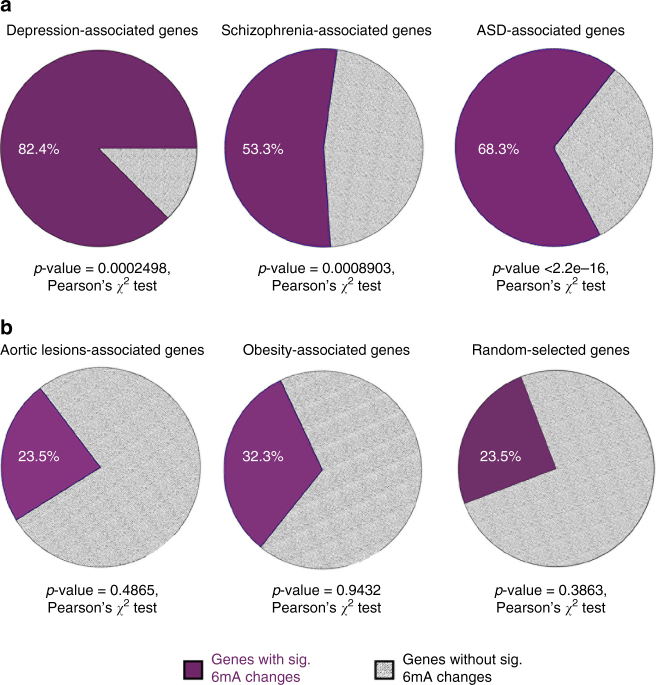
Chemical modifications on DNA molecules, such as 5-methylcytosine and 5-hydroxymethylcytosine, play important roles in the mammalian brain. A novel DNA adenine modification, N(6)-methyladenine (6mA), has recently been found in mammalian cells. However, the presence and function(s) of 6mA in the mammalian brain remain unclear. Here we demonstrate 6mA dynamics in the mouse brain in response to environmental stress. We find that overall 6mA levels are significantly elevated upon stress. Genome-wide 6mA and transcriptome profiling reveal an inverse association between 6mA dynamic changes and a set of upregulated neuronal genes or downregulated LINE transposon expression. Genes bearing stress-induced 6mA changes significantly overlap with loci associated with neuropsychiatric disorders. These results suggest an epigenetic role for 6mA in the mammalian brain as well as its potential involvement in neuropsychiatric disorders.


Conflict of interest statement

The authors declare no competing financial interests.

Figures

Fig. 1
Fig. 1
Chronic stress induces 6mA accumulation in mouse prefrontal cortex (PFC). a, b Chronic stress resulted in increased immobility time in the forced swim test (FST) and tail suspension test (TST). (n = 9; *p < 0.05; **p < 0.01; unpaired t-test, error bars = mean±SEM, unpaired t-test). c Highly sensitive ultra-performance liquid chromatography tandem mass spectrometer (UHPLC-MS/MS) precisely quantified 6mA in prefrontal cortex (PFC), Hippocampus (HIP), Amygdala (AMY), and Hypothalamus (HYP) upon stress. N(6)-methyladenine/total A was indicated as percentage per million dA (p.p.m.). N(6)-methyladenine levels in PFC drastically increased from 6.6 p.p.m. (6mA per million dA) to 25.5 p.p.m. upon stress (**p < 0.01; unpaired t-test; non-significant p-values are indicated). d Representative 6mA-specific dot blots revealed accumulation of 6mA in mouse PFC upon stress. Antibody specificity has been validated by detecting PCR products using methylated dATP (6mA-PCR) but not unmodified dATP (control PCR). e Quantification of dot blots in d by ImageJ software (n = 4, ***p < 0.001; unpaired t-test, error bars = mean±SEM)
Fig. 2
Fig. 2
Genome-wide 6mA profiling in PFC reveals dynamic changes in 6mA on intragenic regions in response to stress. a Volcano plot illustrated the significant gain- and loss-of-6mA regions upon stress. Each dot represents 500-bp binned mouse genome containing significant 6mA reads differences by pair-wise replicate comparison. Fold changes in 6mA reads (Stressed:Control) are indicated on the x-axis, and –log10(p-value) of each bin are indicated on the y-axis. 37,937 significant gain-of-6mA regions and 21,974 loss-of-6mA regions are highlighted in red and blue, respectively. b, c Genomic annotation of significant gain- or loss-of-6mA demonstrate their percentage of genomic feature association and enrichment vs. expected values. Dynamic 6mA changes upon stress predominantly occurred on introns and intergenic regions. Gain-of-6mA regions were mostly enriched in intergenic regions over expected value whereas loss-of-6mA enriched in introns over expected values (Heatmap view, highlighted in red). d Average fold change between 6mA normalized reads (stressed vs. control) were calculated in gene bodies bearing loss- or gain-of 6mA regions upon stress, respectively, plus 5 kb upstream and downstream flanking regions. Average fold change was plotted in Heatmap view. Red plots (fold change > 1) indicate overall gain of 6mA upon stress whereas blue plots (fold change < 1) indicate loss of 6mA
Fig. 3
Fig. 3
Genome-wide 6mA profiling in PFC reveals dynamic changes in 6mA on intergenic repetitive elements in response to stress. a, b Genomic annotation of significant gain- or loss-of-6mA demonstrate their percentage of repetitive elements association and enrichment vs. expected values. Stress-induced intergenic 6mA alterations occurred on distinct classes of repetitive elements. c, d The Log2 enrichment of annotated gain- or loss-of-6mA vs. expected values were calculated by HOMER annotation algorithm and demonstrated by heatmap. In total, 49.2% of intergenic gain-of-6mA occurred in the long interspersed nuclear element (LINE), which was highly enriched over expected. Loss-of-6mA was predominantly enriched in simple repeats over expected values. e Gain-of-6mA on intergenic regions correlated with downregulation of LINE transposon expression. In total, 79.6% of dynamic 6mA marked LINE transposons possessed gain-of-6mA, with 90.4% of these LINE expression being downregulated upon stress. P < 0.001, Chi-squared test comparing to short interspersed nuclear element (SINE) transposon. The fold changes (Stressed:Control) of both 6mA and LINE expression are indicated by Heatmap. Red plots (Log2 fold change > 0) indicate increased expression upon stress (stressed > control), whereas green plots (fold change < 0) indicate decreased expression upon stress (stressed < control)
Fig. 4
Fig. 4
N(6)-methyladenine negatively correlates with neuronal gene expression in response to stress. a Genes with significant loss-of-6mA and increased expression upon stress are indicated. The log2 fold changes (Stressed:Control) of both 6mA and transcription are illustrated by Heatmap. Red plots (fold change > 1) indicate transcription upregulation upon stress, whereas blue plots (fold change < 1) indicate loss-of-6mA on the same genes upon stress. b Genes in a were enriched in pathways related to neuronal functions, neurogenesis and behavior control. Fold enrichment of each GO term are indicated by the x-axis and bar color. c Circos plot to indicate the relationship between genes and GO terms. Cross-examination of GO analyses suggested that a substantial number of upregulated genes with loss-of-6mA related to behavior were also enriched in other biological functions such as learning and neuron projection development. Log2 fold changes of gene expression were indicated as colored squares
Fig. 5
Fig. 5
Dynamic 6mA is associated with depression-linked genetic loci. a Significant overlap between depression-associated genes containing the top 17 most significant SNPs, schizophrenia (SCZ)-related risk genes and autism spectrum disorders (ASD)-related risk genes with dynamic 6mA marked genes upon stress are indicated. P-value was calculated by Pearson’s χ 2 test. b The genes related to aortic lesions, obesity or randomly selected genes did not show significant enrichment. Statistical significance was calculated by Pearson’s χ 2 tests, and p-values are indicated

Similar articles

Cited by

References

    1. Ma DK, et al. Epigenetic choreographers of neurogenesis in the adult mammalian brain. Nat. Neurosci. 2010;13:1338–1344. doi: 10.1038/nn.2672. - DOI - PMC - PubMed
    1. Yao B, et al. Epigenetic mechanisms in neurogenesis. Nat. Rev. Neurosci. 2016;17:537–549. doi: 10.1038/nrn.2016.70. - DOI - PMC - PubMed
    1. Wion D, Casadesus J. N6-methyl-adenine: an epigenetic signal for DNA-protein interactions. Nat. Rev. Microbiol. 2006;4:183–192. doi: 10.1038/nrmicro1350. - DOI - PMC - PubMed
    1. Fu Y, et al. N6-methyldeoxyadenosine marks active transcription start sites in Chlamydomonas. Cell. 2015;161:879–892. doi: 10.1016/j.cell.2015.04.010. - DOI - PMC - PubMed
    1. Greer EL, et al. DNA methylation on N6-adenine in C. elegans. Cell. 2015;161:868–878. doi: 10.1016/j.cell.2015.04.005. - DOI - PMC - PubMed

Publication types

MeSH terms