. 2017 Oct 10:8:1708.
doi: 10.3389/fpsyg.2017.01708. eCollection 2017.

Loss Aversion Reflects Information Accumulation, Not Bias: A Drift-Diffusion Model Study

Affiliations

Loss Aversion Reflects Information Accumulation, Not Bias: A Drift-Diffusion Model Study

Summer N Clay et al. Front Psychol. .

Abstract

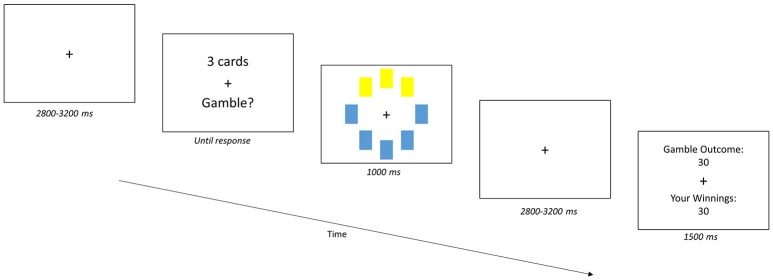
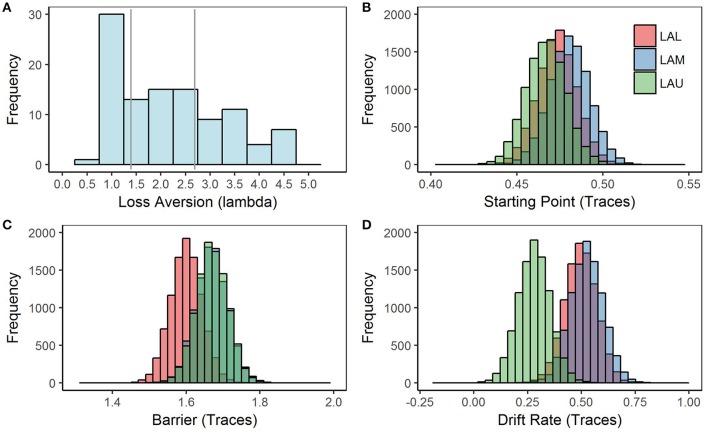
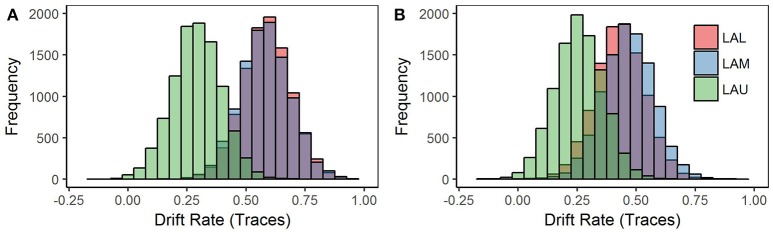
Defined as increased sensitivity to losses, loss aversion is often conceptualized as a cognitive bias. However, findings that loss aversion has an attentional or emotional regulation component suggest that it may instead reflect differences in information processing. To distinguish these alternatives, we applied the drift-diffusion model (DDM) to choice and response time (RT) data in a card gambling task with unknown risk distributions. Loss aversion was measured separately for each participant. Dividing the participants into terciles based on loss aversion estimates, we found that the most loss-averse group showed a significantly lower drift rate than the other two groups, indicating overall slower uptake of information. In contrast, neither the starting bias nor the threshold separation (barrier) varied by group, suggesting that decision thresholds are not affected by loss aversion. These results shed new light on the cognitive mechanisms underlying loss aversion, consistent with an account based on information accumulation.

Keywords: decision making; drift-diffusion model; information processing; loss aversion.


Figures

Figure 1
Figure 1
Gambling Task. Participants accepted or rejected a gamble of cards from a 32-card deck with card values of either +10 or −10. The gambles (trials) began with the presentation of a jittered (2,800–3,200 ms) fixation cross. Next, the number of cards to be turned over for the gamble (“X cards”) was presented. For each gamble, eight cards from the deck are randomly selected, and then one, three or five cards could be turned over and the participant indicated their choice of accepting or rejecting the gamble. Participants could accept or reject the gamble using one of four options to indicate the confidence in their response: Strong Yes, Weak Yes, Weak No, and Strong No. The response was followed by a visual of the gamble and then a second jittered fixation cross. Participants then received feedback on the outcome of the gamble and their winnings, following their response and presentation of the gamble.
Figure 2
Figure 2
LA Histogram and Model 1 posterior distributions for each parameter by loss aversion group. Model 1 was estimated using a Bayesian hierarchical framework, with Markov chain Monte-Carlo (MCMC) sampling methods employed to estimate a joint posterior distribution (known as traces) for each of the model parameters, starting point, barrier, and drift rate. (A) Histogram of loss aversion scores with gray lines separating each tercile group. Our participant sample was more loss averse (M = 2.17, SD = 1.14), as measured by the DOSE using the lambda (λ) parameter than samples in the literature; although, our study had the benefit of a larger sample size and fewer exclusions than is typical. Generally, scores on the DOSE where lambda > 1 are considered loss-averse and scores below 1 are considered loss-seeking. (B) Posterior distribution of starting point traces estimated by Model 1. Starting point traces are separated by the loss aversion groups. (C) Posterior distribution of barrier traces estimated by Model 1. Although barrier traces seem to somewhat separate based on loss aversion groups, the difference between groups is not significant. (D) Posterior distribution of drift rate traces estimated by Model 1. Drift rate traces are separated by the loss aversion groups, p < 0.05.
Figure 3
Figure 3
Model 2 posterior distributions for the drift rate parameter by loss aversion groups and deck type. Model 2 was estimated using a Bayesian hierarchical framework, with Markov chain Monte-Carlo (MCMC) sampling methods employed to estimate a joint posterior distribution (known as traces) for the model parameters, starting point and barrier, in addition to the drift rate parameter for each deck type, win and loss. The joint posterior distributions of the drift rate parameter for each deck type are displayed here. (A) Win deck: Drift rate separates by loss aversion group. (B) Loss deck: Drift rate is not separable by loss aversion groups.

References

    1. Anderson B. A., Laurent P. A., Yantis S. (2011). Value-driven attentional capture. Proc. Natl. Acad. Sci. U.S.A. 108, 10367–10371. 10.1073/pnas.1104047108 - DOI - PMC - PubMed
    1. Andreoni J., Harbaugh W., Vesterlund L. (2003). The carrot or the stick: reward, punishment and cooperation. Am. Econ. Rev. 93, 893–902. 10.1257/000282803322157142 - DOI
    1. Barron G., Erev I. (2003). Small feedback-based decisions and their limited correspondence to description-based decisions. J. Behav. Decision Making 16, 215–233. 10.1002/bdm.443 - DOI
    1. Bucker B., Theeuwes J. (2016). Appetitive and aversive outcome associations modulate exogenous cueing. Attent. Percept. Psychophys. 78:2253. 10.3758/s13414-016-1107-6 - DOI - PMC - PubMed
    1. Burson K., Faro D., Rottenstreich Y. (2013). Multiple-unit holdings yield attenuated endowment effects. Manage. Sci. 59, 545–555. 10.1287/mnsc.1120.1562 - DOI

LinkOut - more resources