. 2017 Oct 10:8:1738.
doi: 10.3389/fpls.2017.01738. eCollection 2017.

Transcriptomics and Alternative Splicing Analyses Reveal Large Differences between Maize Lines B73 and Mo17 in Response to Aphid Rhopalosiphum padi Infestation

Affiliations

Transcriptomics and Alternative Splicing Analyses Reveal Large Differences between Maize Lines B73 and Mo17 in Response to Aphid Rhopalosiphum padi Infestation

Juan Song et al. Front Plant Sci. .

Abstract

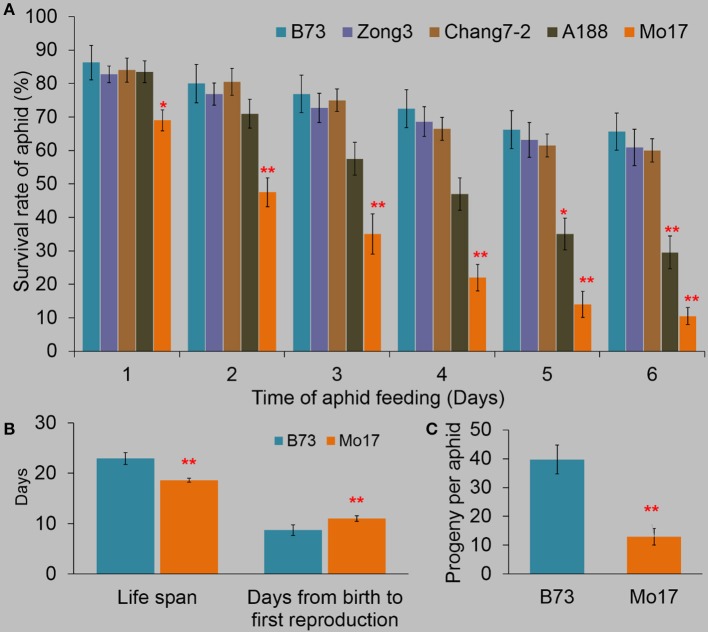
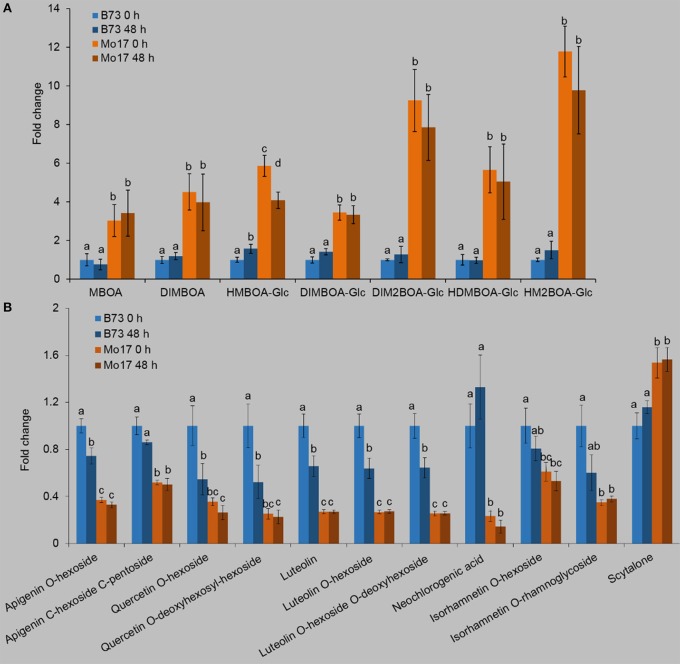
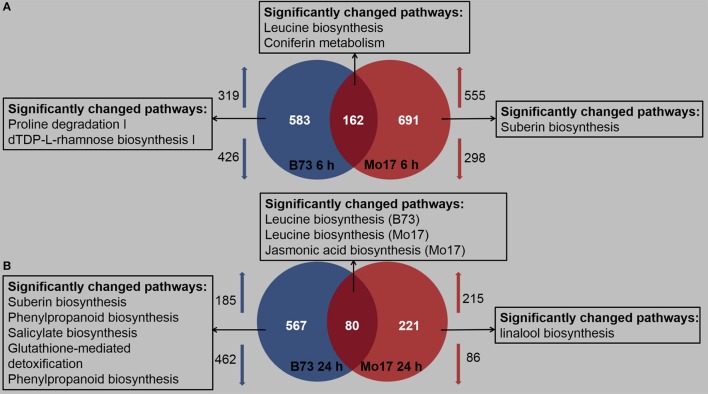
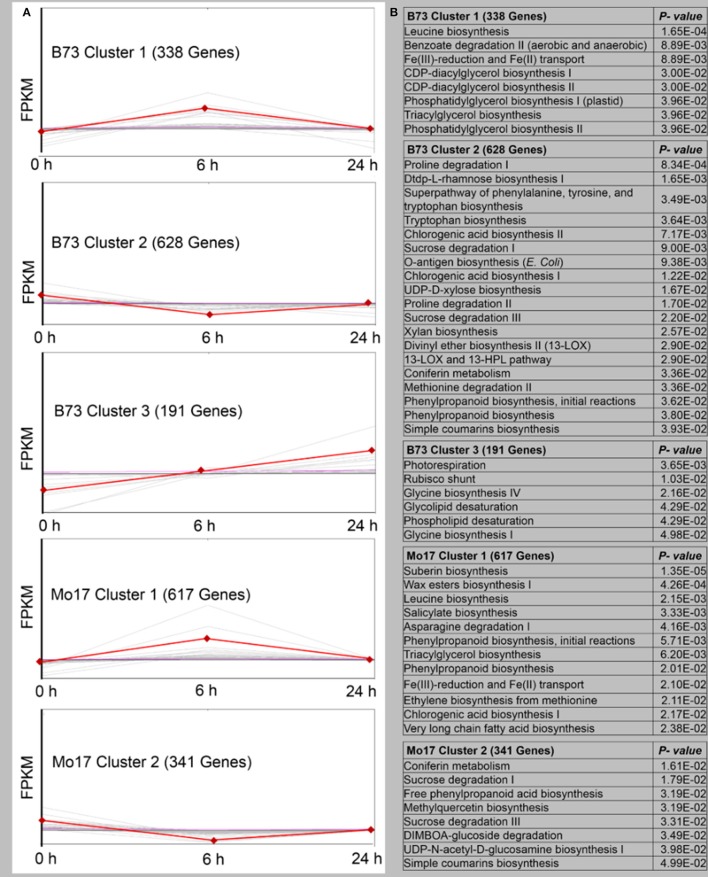
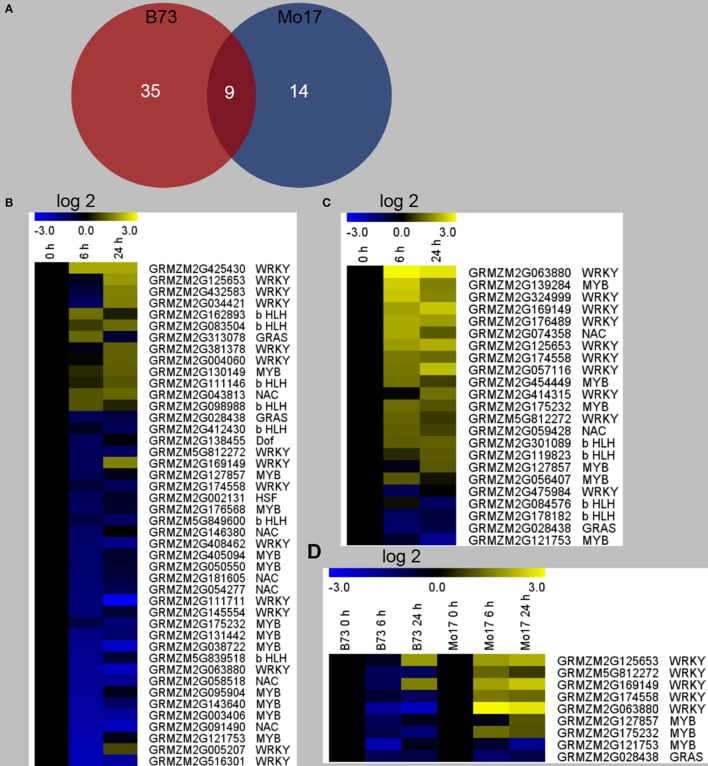
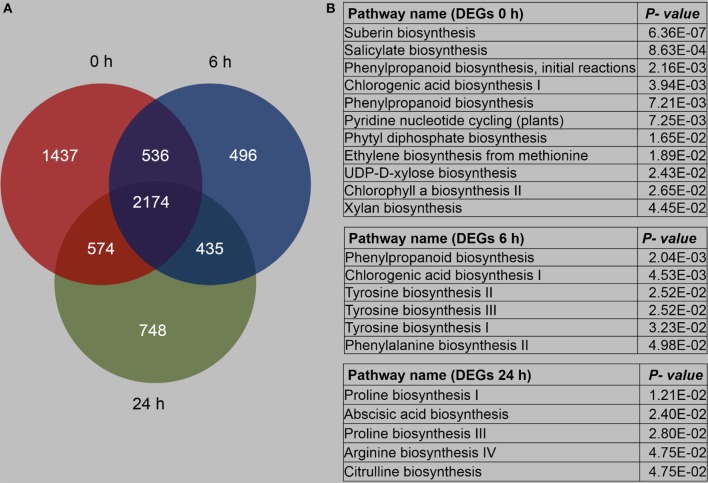
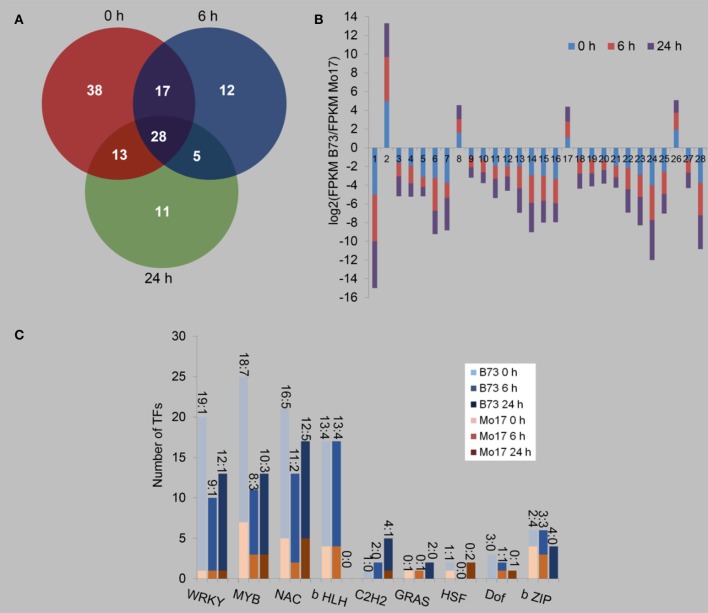
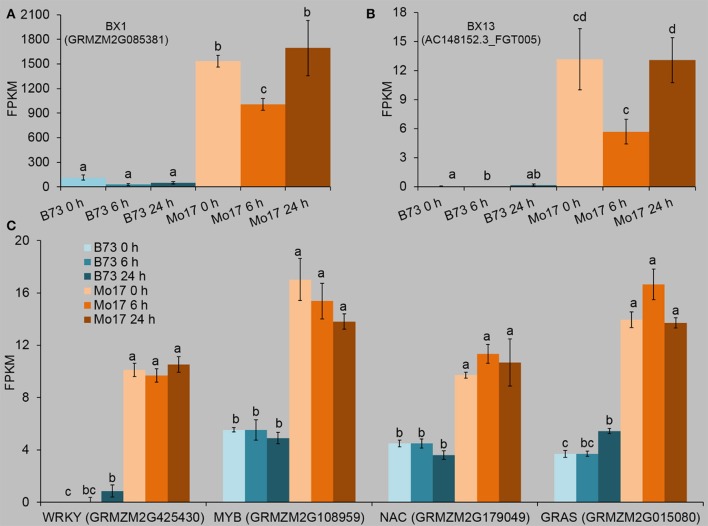
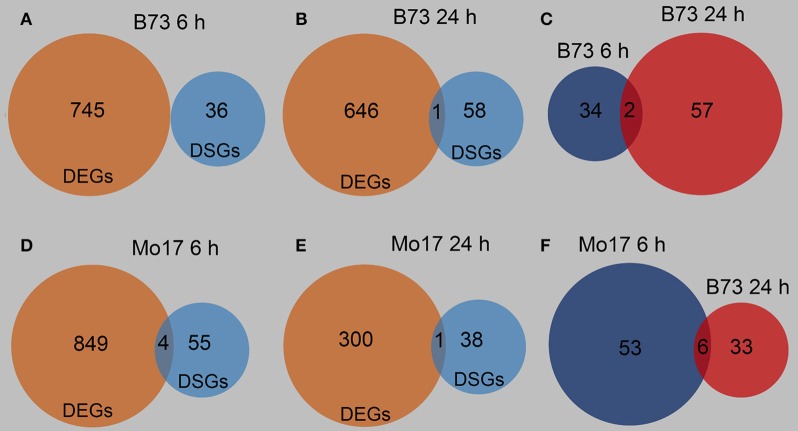
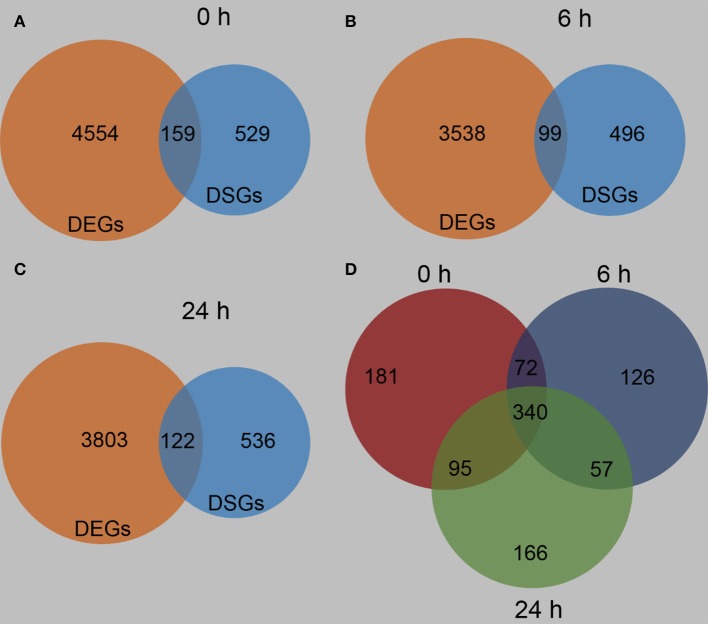
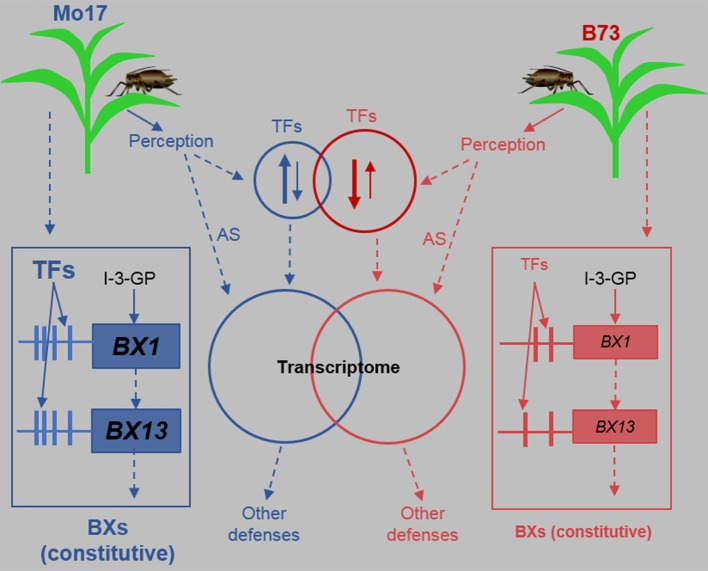
Maize (Zea mays L.) is a staple crop worldwide with extensive genetic variations. Various insects attack maize plants causing large yield loss. Here, we investigated the responses of maize B73, a susceptible line, and Mo17, a resistant line, to the aphid Rhopalosiphum padi on metabolite and transcriptome levels. R. padi feeding had no effect on the levels of the defensive metabolites benzoxazinoids (Bxs) in either line, and Mo17 contained substantially greater levels of Bxs than did B73. Profiling of the differentially expressed genes revealed that B73 and Mo17 responded to R. padi infestation specifically, and importantly, these two lines showed large gene expression differences even without R. padi herbivory. Correlation analysis identified four transcription factors (TFs) that might account for the high Bx levels in Mo17. Similarly, genome-wide alternative splicing (AS) analyses indicated that both B73 and Mo17 had temporally specific responses to R. padi infestation, and these two lines also exhibited large differences of AS regulation under normal condition, and 340 genes, including 10 TFs, were constantly differentially spliced. This study provides large-scale resource datasets for further studies on the mechanisms underlying maize-aphid interactions, and highlights the phenotypic divergence in defense against aphids among maize varieties.

Keywords: Rhopalosiphum padi; alternative splicing; benzoxazinoid; maize (Zea mays L.); metabolites; transcriptome.


Figures

Figure 1
Figure 1
The resistance levels of different maize lines to R. padi. (A) The survival rates of R. padi on B73, Zong3, Chang7-2, A188, and Mo17. (B) The life span and the time needed from birth to first reproduction. (C) Fecundity of R. padi on B73 and Mo17. Values = means ± SE; n = 20; one-way ANOVA was used in (A), t-test was applied in (B,C); *P < 0.05; **P < 0.01).
Figure 2
Figure 2
Profiles of Bxs and phenolics in B73 and Mo17. Maize leaves were treated with R. padi herbivory, and samples were collected at 48 h; non-treated leaves severed as controls (0 h). Relative contents of Bxs (A) and phenolics (B) in B73 and Mo17. Values = means ± SE; n = 5; different letters above bars indicate significant differences (one-way ANOVA and Duncan's multiple range test; P < 0.05); all values of the B73 group are normalized to 1. Complete data can be found in Table S1.
Figure 3
Figure 3
Profiles of regulated maize transcripts after 6 and 24 h of R. padi infestation on B73 and Mo17. The fourth maize leaves were each treated with 50 aphids, and samples were collected at 6 and 24 h; untreated leaves served as controls. Overall transcriptionally regulated genes and functional distribution of differentially expressed unique genes (fold change >2, P < 0.05) after 6 h (A) and 24 h (B) of R. padi herbivory in B73 and Mo17. Arrows indicate up- and down-regulated genes, respectively. Complete data can be found in Table S3.
Figure 4
Figure 4
Overview of gene expression trends and clusters in R. padi-treated B73 and Mo17. (A) A total of 1157 transcripts in B73 (in three clusters) and 958 transcripts in Mo17 (in two clusters) with significant expression profile changes for at least one time-point after the R. padi feeding. The total number of transcripts in each cluster is indicated in the brackets, and the data for individual genes are shown in light gray. Average expression values for each cluster are shown in red. All genes selected for this analysis have significant differences of 1-fold (up- or down-regulated), P < 0.05. (B) Pathway enrichment analysis of each cluster using MetGenMAP to identify metabolic functions that were regulated. Full descriptions can be found in Table S4.
Figure 5
Figure 5
Differentially regulated transcription factors in B73 and Mo17 after R. padi herbivory. The fourth maize leaves were each treated with 50 aphids, and samples were collected at 6 and 24 h after R. padi treatment; untreated leaves served as controls. (A) Venn diagram depicting the number of transcription factors (TFs) significantly changed in B73 and Mo17 after 6 and 24 h of R. padi treatment. Heat maps indicate relative expression levels (fold change after log2 transformation) of TFs regulated by R. padi feeding in B73 (B) and Mo17 (C). (D) Relative expression levels (fold change after log2 transformation) of the 9 common regulated TFs in B73 and Mo17. Detailed data can be found in Table S5.
Figure 6
Figure 6
Overview of differentially expressed genes between B73 and Mo17. The fourth maize leaves were each treated with 50 aphids, and samples were collected at 6 and 24 h; untreated leaves served as controls (0 h). (A) Number of genes with differentially expressed levels between B73 and Mo17. (B) Pathway enrichment analysis using MetGenMAP to identify metabolic functions that were differentially expressed between B73 and Mo17. Full descriptions can be found in Table S6.
Figure 7
Figure 7
Differentially regulated transcription factors between B73 and Mo17 with and without R. padi treatment. The fourth maize leaves were each treated with 50 aphids, and samples were collected at 6 and 24 h (untreated leaves served as controls, depicted as 0 h). (A) Venn diagram indicating the number of differently expressed transcription factors (TFs) between B73 and Mo17 at each time point. (B) Expression profiles of the 28 common regulated TFs (X-axis represent randomly assigned gene numbers, and their gene IDs are in Table S7). (C) Distribution of the families of TF differentially regulated between B73 and Mo17, in control, at 6 and 24 h of R. padi herbivory-treated samples. On top of each bar, the number before the colon indicates the number of TFs that had greater expression in B73 than in Mo17, and the number after the colon indicates the number of TFs whose expression were lower in B73 than in Mo17. Full descriptions can be found in Table S7.
Figure 8
Figure 8
Expression profiles of Bx biosynthetic genes and transcription factors whose expression patterns were correlated with that of BX1. The fourth maize leaves were each treated with 50 aphids per plant, and samples were collected at 6 and 24 h after R. padi treatment (untreated leaves served as controls, depicted as 0 h). Relative changes of the transcript levels of BX1 (A) and BX13 (B). Data were extracted from the FPKM values of the target genes in the RNA-seq datasets. (C) Transcription factors (TFs) which showed similar expression patterns to that of BX1. Values = means ± SE; n = 3; different letters above bars indicate significant differences (one-way ANOVA Duncan's multiple range test; P < 0.05). Full descriptions can be found in Table S7.
Figure 9
Figure 9
Overview of the differentially spliced genes in B73 and Mo17. The fourth maize leaves were each treated with 50 aphids per plant, and samples were collected at 6 and 24 h after R. padi treatment; untreated leaves served as controls. Venn diagrams indicating differentially expressed genes (DEGs) and differentially spliced genes (DSGs) at 6 h (A) and 24 h (B) of R. padi feeding in B73. Venn diagram showing specific and overlapping DSGs in B73 at 6 and 24 h of R. padi feeding (C). Venn diagrams indicating DEGs and DSGs at 6 h (D) and 24 h (E) of R. padi feeding on Mo17. Venn diagram showing overlapping DSGs in Mo17 at 6 and 24 h of R. padi feeding (F). Full descriptions can be found in Tables S3, S9.
Figure 10
Figure 10
Differentially spliced genes between B73 and Mo17. The fourth maize leaves were each treated with 50 aphids, and samples were collected at 6 and 24 h (untreated leaves served as controls, depicted as 0 h). Venn diagrams indicating the differentially expressed genes (DEGs) and differentially spliced genes (DSGs) between B73 and Mo17 at 0 h (A), 6 h (B), and 24 h (C). Venn diagram indicating specific and overlapping DSGs between B73 and Mo17 at 0, 6, and 24 h of R. padi feeding (D). Full descriptions can be found in Tables S6, S10.
Figure 11
Figure 11
A model summarizing the defense responses of B73 and Mo17 against the aphid R. padi. Maize plants respond to R. padi feeding mainly by perceiving certain aphid-derived elicitors through unknown receptors, thereby transcriptionally up- or down-regulating TFs (transcription factors). In B73, more TFs are regulated than in Mo17 and most TFs are down-regulated, while in Mo17 most TFs are up-regulated. TFs and other pathways, including alternative splicing (AS), continuously shape the transcriptomes of B73 and Mo17, resulting in changes in defenses. Importantly, certain TFs, that are not regulated by R. padi herbivory, target the promoters of BX1 and BX13 and have higher activity in Mo17 than in B73, resulting in much higher expression levels of BX1 and BX13 and thus high contents of benzoxazinoids (Bxs) in Mo17. The promoters of BX1 and BX13 in Mo17 may also possess more cis-elements that allow more efficient transcription. I-3-GP: indole-3-glycerol phosphate; Red and blue arrows and circles represent B73 and Mo17, respectively. Up and down arrows in the circles indicate up-regulation or down-regulation, and the thickness of these arrows represent the numbers of genes. The sizes of the circles indicate the number of regulated TF genes and the size of letters represent activity, expression, or concentrations. Vertical lines connected with the boxes of BX1 and BX13 represent their promoters, and the horizontal bars symbolize cis-elements. Bxs are a group of metabolites produced by BX1 to BX14.

References

    1. Ahmad S., Veyrat N., Gordon-Weeks R., Zhang Y., Martin J., Smart L., et al. (2011). Benzoxazinoid metabolites regulate innate immunity against aphids and fungi in maize. Plant Physiol. 157, 317–327. 10.1104/pp.111.180224 - DOI - PMC - PubMed
    1. Alborn H. T., Turlings T. C. J., Jones T. H., Stenhagen G., Loughrin J. H., Tumlinson J. H. (1997). An elicitor of plant volatiles from beet armyworm oral secretion. Science 276, 945–949. 10.1126/science.276.5314.945 - DOI
    1. Appel H. M., Fescemyer H., Ehlting J., Weston D., Rehrig E., Joshi T., et al. (2014). Transcriptional responses of Arabidopsis thaliana to chewing and sucking insect herbivores. Front. Plant Sci. 5:565. 10.3389/fpls.2014.00565 - DOI - PMC - PubMed
    1. Argandona V. H., Corcuera L. J., Niemeyer H. M., Campbell B. C. (1983). Toxicity and feeding deterrency of hydroxamic acids from gramineae in synthetic diets against the greenbug, Schizaphis graminum. Entomol. Exp. Appl. 34, 134–138. 10.1111/j.1570-7458.1983.tb03307.x - DOI
    1. Betsiashvili M., Ahern K. R., Jander G. (2015). Additive effects of two quantitative trait loci that confer Rhopalosiphum maidis (corn leaf aphid) resistance in maize inbred line Mo17. J. Exp. Bot. 66, 571–578. 10.1093/jxb/eru379 - DOI - PMC - PubMed