. 2017 Oct 10:7:438.
doi: 10.3389/fcimb.2017.00438. eCollection 2017.

Characterization of the Growth of Chlamydia trachomatis in In Vitro-Generated Stratified Epithelium

Affiliations

Characterization of the Growth of Chlamydia trachomatis in In Vitro-Generated Stratified Epithelium

Ana T Nogueira et al. Front Cell Infect Microbiol. .

Abstract

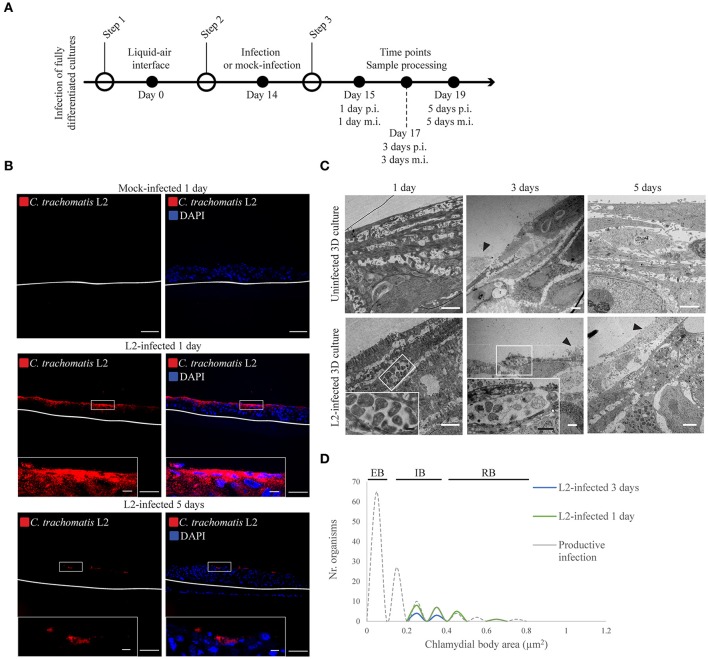
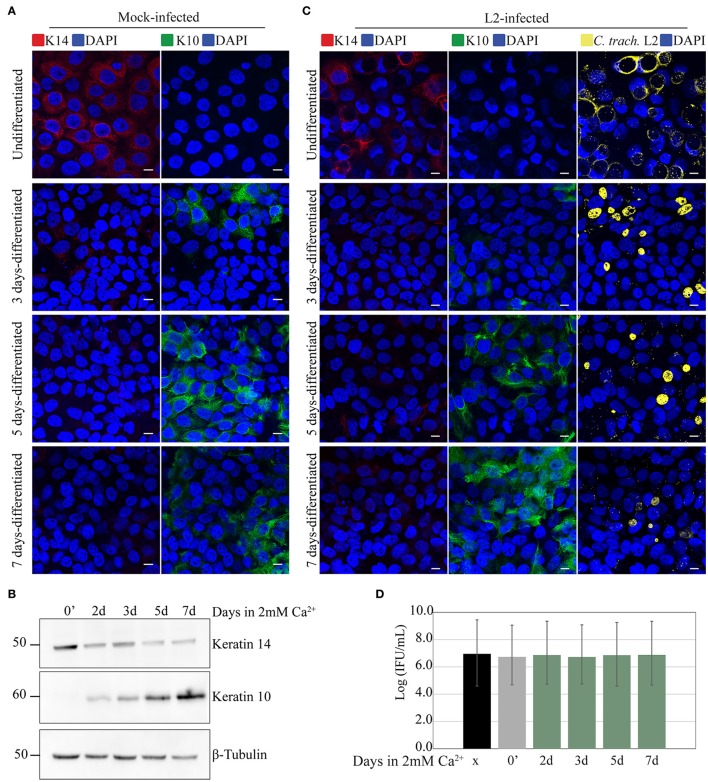
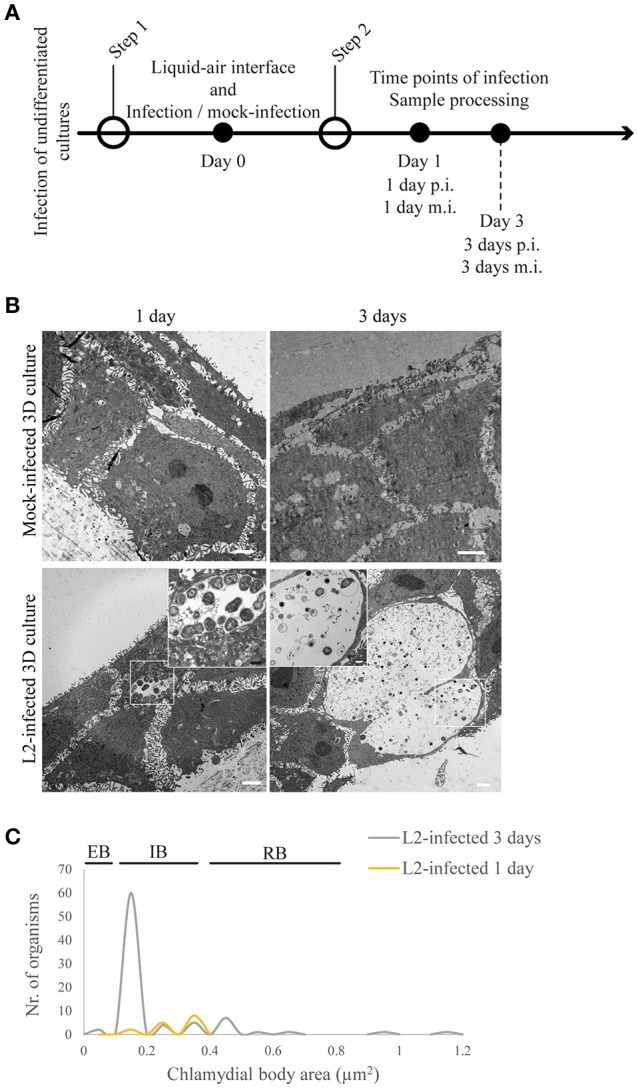
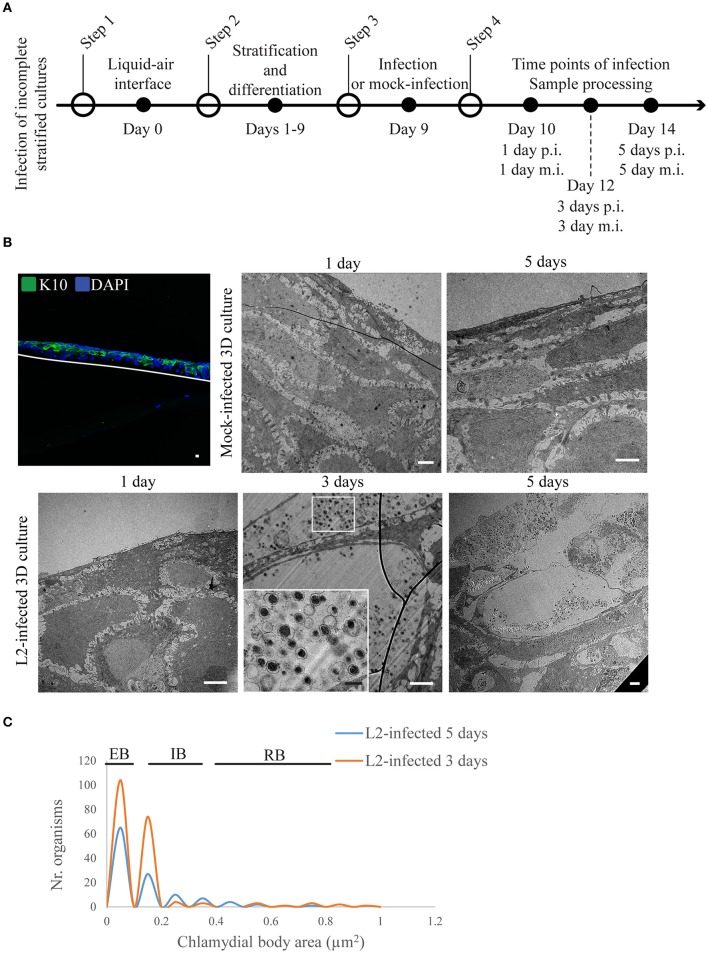
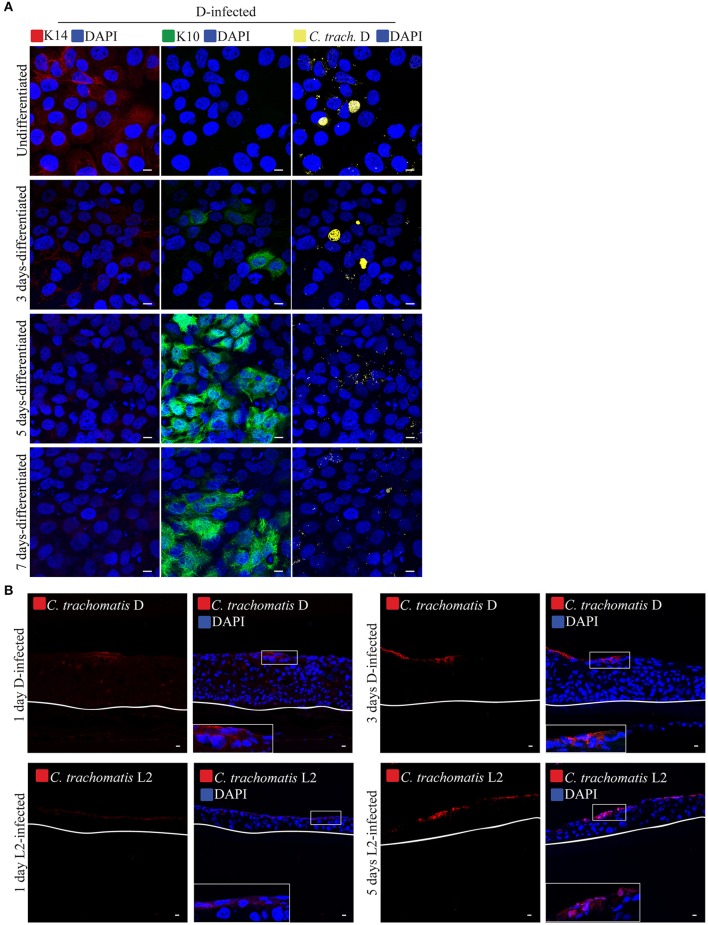
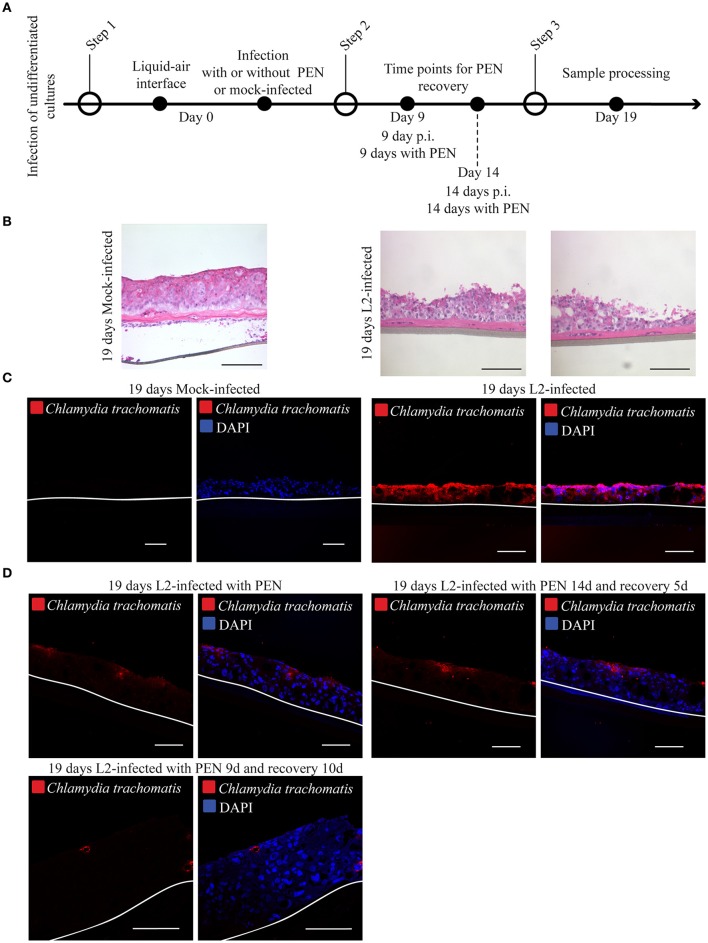
Chlamydia infection targets the mucosal epithelium, where squamous and columnar epithelia can be found. Research on Chlamydia-epithelia interaction has predominantly focused on columnar epithelia, with very little known on how Chlamydia interacts with the squamous epithelium. The stratification and differentiation processes found in the squamous epithelium might influence chlamydial growth and infection dissemination. For this reason, three-dimensional (3D) organotypic stratified squamous epithelial cultures were adapted to mimic the stratified squamous epithelium and chlamydial infection was characterized. Chlamydia trachomatis infection in monolayers and 3D cultures were monitored by immunofluorescence and transmission electron microscopy to evaluate inclusion growth and chlamydial interconversion between elementary and reticulate body. We observed that the stratified epithelium varied in susceptibility to C. trachomatis serovars L2 and D infection. The undifferentiated basal cells were susceptible to infection by both serovars, while the terminally differentiated upper layers were resistant. The differentiating suprabasal cells exhibited different susceptibilities to serovars L2 and D, with the latter unable to establish a successful infection in this layer. Mature elementary body-containing inclusions were much more prevalent in these permissive basal layers, while the uppermost differentiated layers consistently harbored very few reticulate bodies with no elementary bodies, indicative of severely limited bacterial replication and development. For serovar D, the differentiation state of the host cell was a determining factor, as calcium-induced differentiation of cells in a monolayer negatively affected growth of this serovar, in contrast to serovar L2. The apparent completion of the developmental cycle in the basal layers of the 3D cultures correlated with the greater degree of dissemination within and the level of disruption of the stratified epithelium. Our studies indicate that the squamous epithelium is a suboptimal environment for growth, and thus potentially contributing to the protection of the lower genital tract from infection. The relatively more fastidious serovar D exhibited more limited growth than the faster-growing and more invasive L2 strain. However, if given access to the more hospitable basal cell layer, both strains were able to produce mature inclusions, replicate, and complete their developmental cycle.

Keywords: 3D culture; Chlamydia; organotypic cultures; squamous stratified epithelium.


Figures

Figure 1
Figure 1
Chlamydia trachomatis infection is delayed in 3D organotypic cultures. (A) Diagram of the 3D cultures set up for the differentiation, stratification, and infection stages. (B) C. trachomatis L2 inclusions (red) in organotypic cultures infected for 1 or 5 days were only present on the top-most layers. An anti-C. trachomatis LPS antibody was used to detect inclusions. White line represents the bottom of the 3D culture. A representative image from four independent experiments is shown. Scale bar = 10 μm. (C) TEM micrographs show C. trachomatis L2 inclusions containing only normal-size RBs independently of the time of infection, 1, 3, or 5 days. Black arrowheads point at cells that were either being shed or undergoing cell death. A representative image from three independent experiments is shown. (D) Quantification of inclusion contents and the area of elementary bodies (EBs), reticulate bodies (RBs) and intermediate bodies (IB) in 3D cultures infected from the top for 1 (green line) or 3 days (blue line). The dotted line indicates the area distribution for chlamydial organisms in productive infections. White scale bar = 2 μm; black scale bar in inset = 500 nm.
Figure 2
Figure 2
Calcium-induced differentiation of HaCaT cells does not affect C. trachomatis growth and development. HaCaT cells in a monolayer system were exposed to 2 mM of calcium (Ca2+) to induce differentiation up to 7 days. (A) The marker K14 is highly present in undifferentiated cells, and decreased after calcium exposure. In contrast K10 expression increased after calcium exposure indicating differentiation. All images were subjected to identical processing parameters using NIH ImageJ. A representative image from three independent experiments is shown. Scale bar = 10 μm. (B) Differentiation with calcium exposure was confirmed by western blot. Keratin 14 expression is decreased, while keratin 10 expression is increased with 2 mM Ca2+ exposure. β-tubulin served as the loading control. A representative image from two independent experiments is shown. (C) Undifferentiated HaCaT (0′ calcium exposure) or HaCaT exposed to calcium were infected with C. trachomatis L2 for 24 h without centrifugation-synchronized step. Chlamydial inclusions in all conditions appeared mature. C. trachomatis inclusions were stained with covalescent human sera (in yellow). A representative image from two independent experiments is shown. Scale bar = 10 μm. (D) Inclusion forming unit (IFU) yields are similar for untreated and Ca2+-treated samples, a measure for chlamydial infectious particles. HeLa, undifferentiated HaCaT (0′ calcium exposure) or HaCaT pre-exposed to calcium at the indicated times were infected for 36 h, and IFU yield enumerated. Data is presented as mean IFU ± SD.
Figure 3
Figure 3
Chlamydia trachomatis completes its developmental cycle in undifferentiated layer of the 3D organotypic cultures. (A) Diagram of the 3D cultures differentiation, stratification and infection stages. (B) Undifferentiated/basal layer was infected with C. trachomatis L2 prior to differentiation to mimic basal layer access through microabrasions. TEM micrographs show inclusions containing normal-size RBs 1 day post-infection. By 3 days of infection inclusions contains EBs. Cultures allowed to stratify for 19 days in the presence of C. trachomatis L2 revealed few layers of unorganized cells. A representative image from two independent experiments is shown. (C) Quantification of inclusion contents and the area of EBs, RBs, intermediate bodies and enlarged RBs. The plot indicates the number of organisms for each particle size.
Figure 4
Figure 4
Chlamydia trachomatis completes its developmental cycle in early differentiated layers of the 3D organotypic cultures. (A) Diagram of the set up for the 3D cultures differentiation and infection. (B) Incomplete differentiated cultures express k10 at the top of the culture. Cultures were infected by 1, 3, or 5 days at the two latest time points C. trachomatis L2 inclusions containing EBS were visualized. White line represents the bottom of the 3D culture. A representative image from two independent experiments is shown. Confocal microscopy scale bar = 10 μm; TEM micrographs: white scale bar = 2 μm; black scale bar = 500 nm. (C) Quantification of inclusion contents and the area of EBs, RBs, intermediate bodies and enlarged RBs. The plot indicates the frequency for each particle size.
Figure 5
Figure 5
Calcium-induced differentiation of HaCaT cells decreases the infectivity of C. trachomatis D. (A) HaCaT cells in a monolayer system were exposed to high concentration (2 mM) of calcium (Ca2+) to induce differentiation up to 7 days. HaCaT exposed to calcium were infected with C. trachomatis D (without centrifugation). Infection was allowed to proceed for 24 h. Chlamydial inclusions decreased in samples exposed to high [Ca2+] C. trachomatis inclusions were stained with covalescent human sera (in yellow). A representative image from three independent experiments is shown. Scale bar = 10 μm. (B) C. trachomatis L2 or D inoculum was introduced to the top of the 3D organotypic cultures. Infections were allowed to proceed for 1, 3, or 5 days. C. trachomatis inclusions were stained with an anti-C. trachomatis LPS antibody. White line represents the bottom of the 3D culture. A representative image from two independent experiments is shown. Scale bar = 10 μm.
Figure 6
Figure 6
Chlamydial infection is unable to disseminate in organotypic cultures. (A) Diagram of the differentiation, infection and penicillin treatments. (B) 3D cultures were culture at liquid-air interface for 19-days in the presence (C. trachomatis L2-infected) or absence (mick-infected control). Samples were stain with hematoxylin and eosin. A representative image from three independent experiments is shown. Scale bar: 200 μm. (C) Organotypic cultures were raised to air-liquid interface to induce stratification and mock-infected (control) or C. trachomatis L2- infected on the same day. Cultures were grown for 19 days in the presence or absence of C. trachomatis L2. Samples were stained with C. trachomatis LPS antibody to detect infection. White line represents the bottom of the 3D culture. A representative image from three independent experiments is shown. Scale bar = 10 μm. (D) C. trachomatis L2 infections were arrested with the addition of Penicillin. Organotypic cultures were allowed to stratify and differentiate. Infection was allowed to recover from Penicillin exposure for 5 or 14 days or no recovery was allowed. No recovery or 5 days recovery showed C. trachomatis inclusions (red) only present on the top layers. C. trachomatis infection did not disseminate with the longest period of recovery, 10 days. Inclusions were detected by staining against C. trachomatis LPS. A representative image from two independent experiments is shown. Scale bar = 10 μm.

References

    1. AbdelRahman Y. M., Belland R. J. (2005). The chlamydial developmental cycle: figure 1. FEMS Microbiol. Rev. 29, 949–959. 10.1016/j.femsre.2005.03.002 - DOI - PubMed
    1. Al-Younes H. M., Brinkmann V., Meyer T. F. (2004). Interaction of Chlamydia trachomatis serovar L2 with the host autophagic pathway. Infect. Immun. 72, 4751–4762. 10.1128/IAI.72.8.4751-4762.2004 - DOI - PMC - PubMed
    1. Anderson D. J., Marathe J., Pudney J. (2014). The structure of the human vaginal stratum corneum and its role in immune defense. Am. J. Reprod. Immunol. 71, 618–623. 10.1111/aji.12230 - DOI - PMC - PubMed
    1. Beatty W. L. (2006). Trafficking from CD63-positive late endocytic multivesicular bodies is essential for intracellular development of Chlamydia trachomatis. J. Cell Sci. 119, 350–359. 10.1242/jcs.02733 - DOI - PubMed
    1. Beatty W. L. (2008). Late endocytic multivesicular bodies intersect the chlamydial inclusion in the absence of CD63. Infect. Immun. 76, 2872–2881. 10.1128/IAI.00129-08 - DOI - PMC - PubMed

Publication types