

Childhood stunting in relation to the pre- and postnatal environment during the first 2 years of life: The MAL-ED longitudinal birth cohort study
- PMID: 29069076
- PMCID: PMC5656304
- DOI: 10.1371/journal.pmed.1002408
Childhood stunting in relation to the pre- and postnatal environment during the first 2 years of life: The MAL-ED longitudinal birth cohort study
Abstract
Background: Stunting is the most prevalent manifestation of childhood malnutrition. To characterize factors that contribute to stunting in resource-poor settings, we studied a priori selected biological and social factors collected longitudinally in a cohort of newborns.
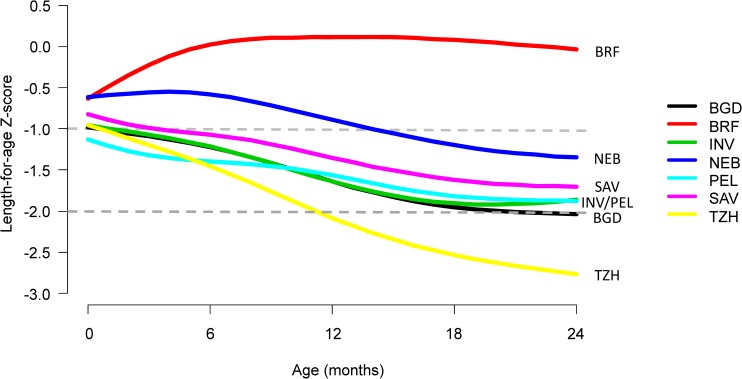
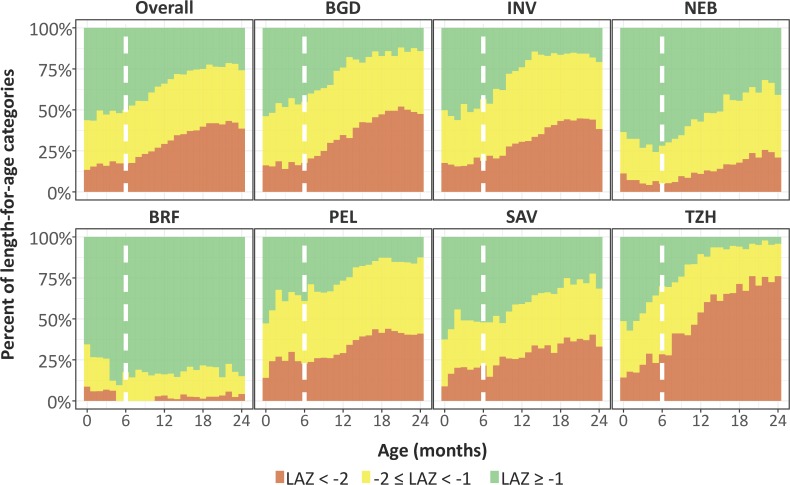
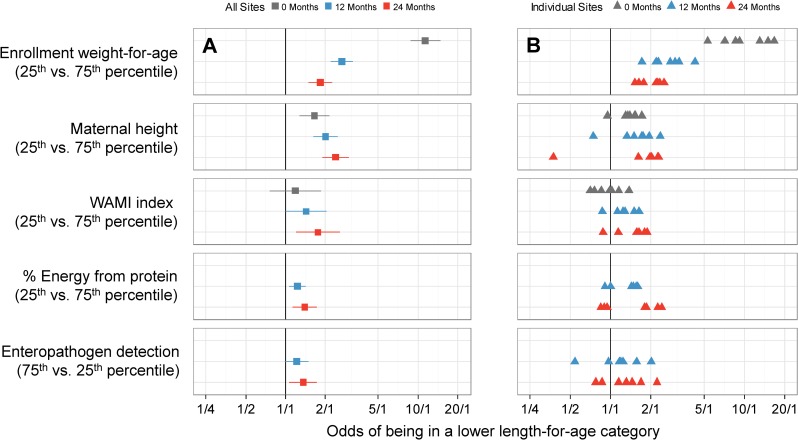
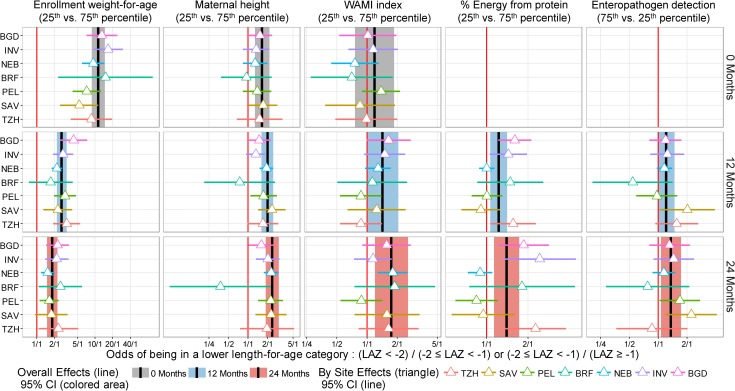
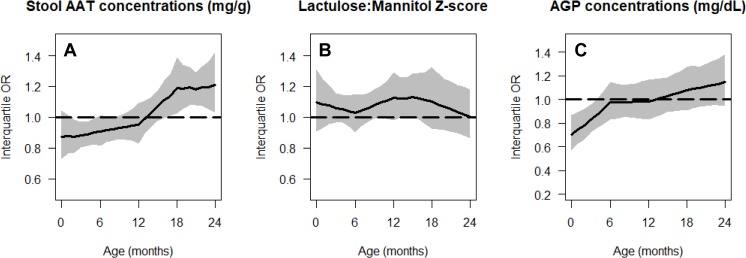
Methods and findings: We enrolled 1,868 children across 7 resource-poor settings in Bangladesh, Brazil, India, Nepal, Peru, South Africa, and Tanzania shortly after birth and followed them for 24 months between 2 November 2009 and 28 February 2014. We collected longitudinal anthropometry, sociodemographic factors, maternal-reported illnesses, and antibiotic use; child feeding practices; dietary intake starting at 9 months; and longitudinal blood, urine, and stool samples to investigate non-diarrheal enteropathogens, micronutrients, gut inflammation and permeability, and systemic inflammation. We categorized length-for-age Z-scores into 3 groups (not stunted, ≥-1; at risk, <-1 to -2; and stunted, <-2), and used multivariable ordinal logistic regression to model the cumulative odds of being in a lower length-for-age category (at risk or stunted). A total of 1,197 children with complete longitudinal data were available for analysis. The prevalence of having a length-for-age Z-score below -1 increased from 43% (range 37%-47% across sites) shortly after birth (mean 7.7 days post-delivery, range 0 to 17 days) to 74% (16%-96%) at 24 months. The prevalence of stunting increased 3-fold during this same time period. Factors that contributed to the odds of being in a lower length-for-age category at 24 months were lower enrollment weight-for-age (interquartile cumulative odds ratio = 1.82, 95% CI 1.49-2.23), shorter maternal height (2.38, 1.89-3.01), higher number of enteropathogens in non-diarrheal stools (1.36, 1.07-1.73), lower socioeconomic status (1.75, 1.20-2.55), and lower percent of energy from protein (1.39, 1.13-1.72). Site-specific analyses suggest that reported associations were similar across settings. While loss to follow-up and missing data are inevitable, some study sites had greater loss to follow-up and more missing data than others, which may limit the generalizability of the findings.
Conclusions: Neonatal and maternal factors were early determinants of lower length-for-age, and their contribution remained important throughout the first 24 months of life, whereas the average number of enteropathogens in non-diarrheal stools, socioeconomic status, and dietary intake became increasingly important contributors by 24 months relative to neonatal and maternal factors.
Conflict of interest statement
SM was a paid consultant for the Bill and Melinda Gates Foundation, but had complete scientific independence regarding the data analysis and interpretation.
Figures
References
-
- Black RE, Victora CG, Walker SP, Bhutta ZA, Christian P, de Onis M, et al. Maternal and child undernutrition and overweight in low-income and middle-income countries. Lancet. 2013;382:427–51. doi: 10.1016/S0140-6736(13)60937-X - DOI - PubMed
-
- Victora CG, Adair L, Fall C, Hallal PC, Martorell R, Richter L, et al. Maternal and child undernutrition: consequences for adult health and human capital. Lancet. 2008;371:340–57. doi: 10.1016/S0140-6736(07)61692-4 - DOI - PMC - PubMed
-
- Black RE, Allen LE, Bhutta ZA, Caulfield LE, de Onis M, Ezzati M, et al. Maternal and child undernutrition: global and regional exposures and health consequences. Lancet. 2008;371:243–60. doi: 10.1016/S0140-6736(07)61690-0 - DOI - PubMed
-
- Kuklina EV, Ramakrishnan U, Stein AD, Barnhart HH, Martorell R. Early childhood growth and development in rural Guatemala. Early Hum Dev. 2006;82:425–33. doi: 10.1016/j.earlhumdev.2005.10.018 - DOI - PubMed
MeSH terms
LinkOut - more resources
Full Text Sources
Other Literature Sources
Medical
Research Materials
