. 2017 Oct 25;13(10):e1005814.
doi: 10.1371/journal.pcbi.1005814. eCollection 2017 Oct.

Transcriptomic correlates of neuron electrophysiological diversity

Affiliations

Transcriptomic correlates of neuron electrophysiological diversity

Shreejoy J Tripathy et al. PLoS Comput Biol. .

Abstract

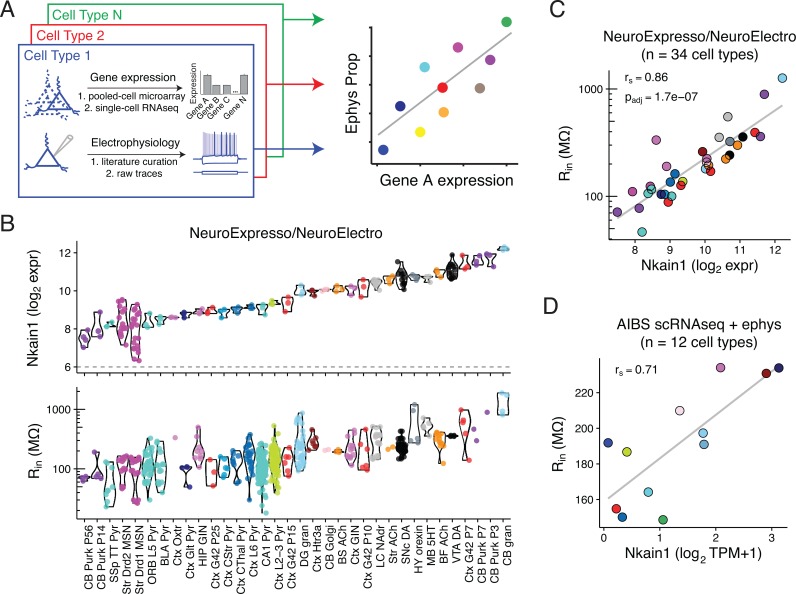
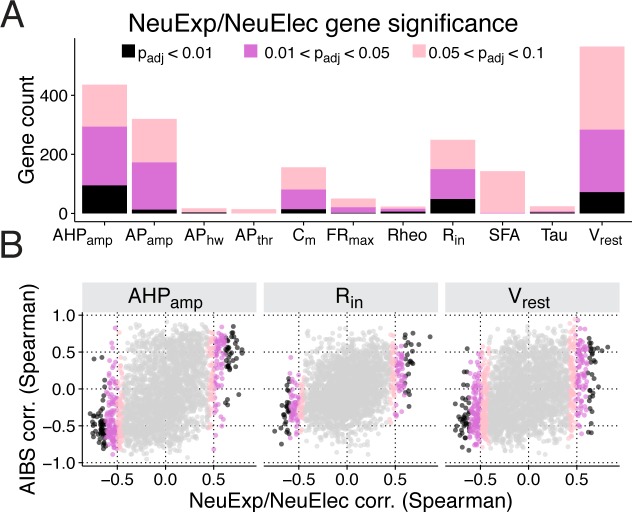
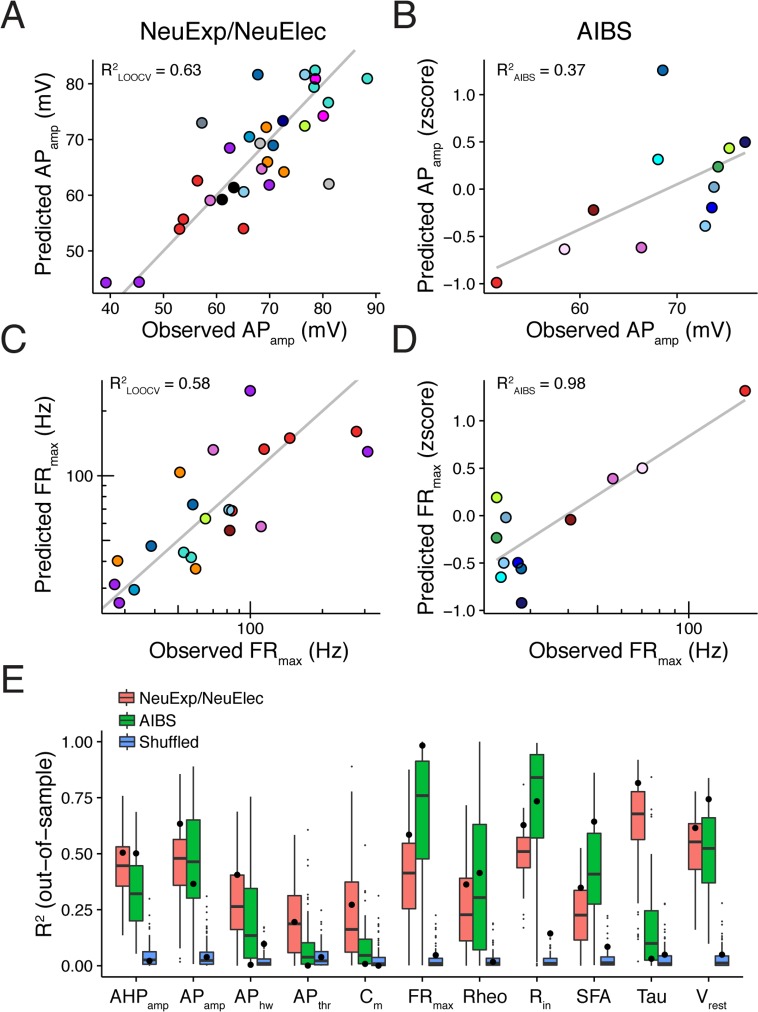
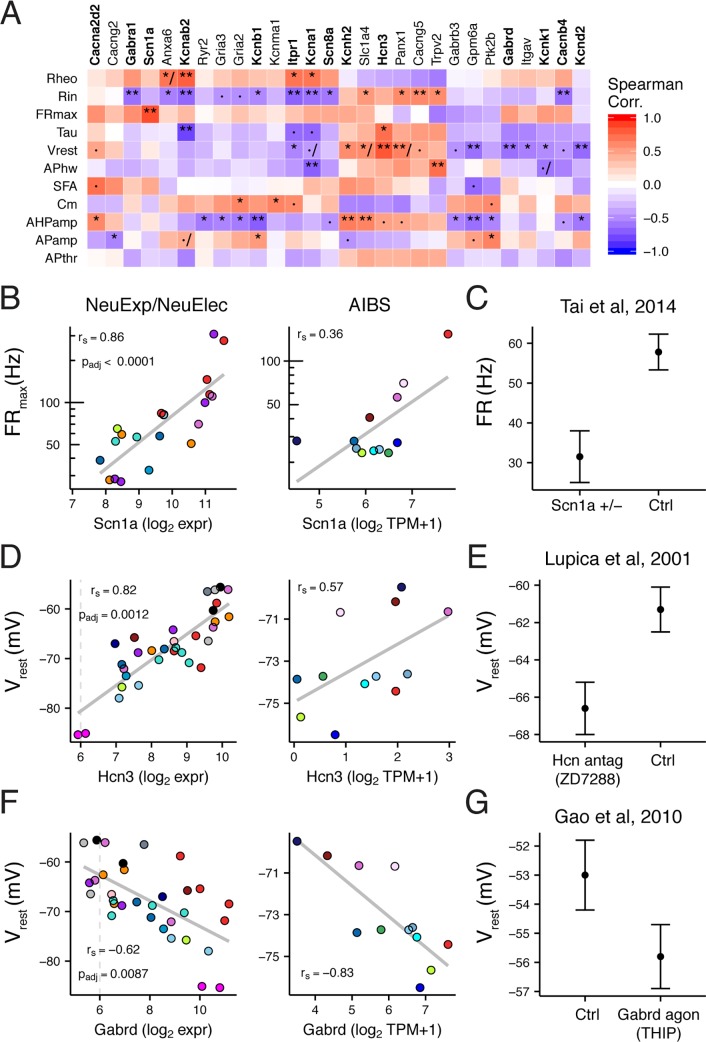
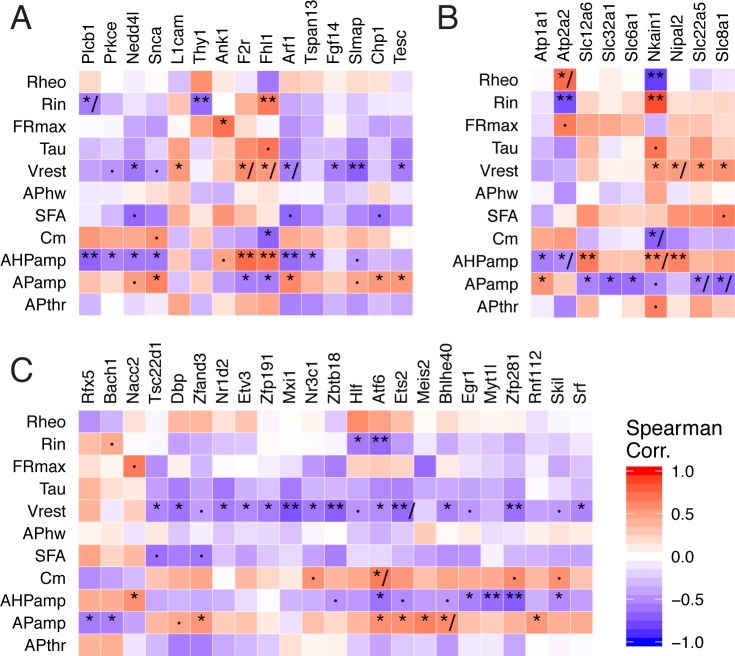
How neuronal diversity emerges from complex patterns of gene expression remains poorly understood. Here we present an approach to understand electrophysiological diversity through gene expression by integrating pooled- and single-cell transcriptomics with intracellular electrophysiology. Using neuroinformatics methods, we compiled a brain-wide dataset of 34 neuron types with paired gene expression and intrinsic electrophysiological features from publically accessible sources, the largest such collection to date. We identified 420 genes whose expression levels significantly correlated with variability in one or more of 11 physiological parameters. We next trained statistical models to infer cellular features from multivariate gene expression patterns. Such models were predictive of gene-electrophysiological relationships in an independent collection of 12 visual cortex cell types from the Allen Institute, suggesting that these correlations might reflect general principles relating expression patterns to phenotypic diversity across very different cell types. Many associations reported here have the potential to provide new insights into how neurons generate functional diversity, and correlations of ion channel genes like Gabrd and Scn1a (Nav1.1) with resting potential and spiking frequency are consistent with known causal mechanisms. Our work highlights the promise and inherent challenges in using cell type-specific transcriptomics to understand the mechanistic origins of neuronal diversity.


Conflict of interest statement

The authors have declared that no competing interests exist.

Figures

Fig 1
Fig 1. Correlating cell type-specific gene expression with electrophysiological diversity.
A) Illustration of transcriptomic and ephys data compilation by cell type (left) and correlation analysis of single gene expression by ephys parameter diversity (right). B) Top row: Gene expression levels of Nkain1 across 34 neuron types sampled from the combined NeuroExpresso/NeuroElectro dataset. Each dot reflects a unique transcriptomic sample collected from purified cells and y-axis is in units of log2 expression (i.e., each increment reflects a 2-fold change in expression level). Dashed line at 6 indicates approximate level of background expression. Bottom row: Input resistance values for the same cell types in top row. Individual dots reflect population mean electrophysiological values manually curated from individual articles represented in the NeuroElectro database, following experimental condition normalization. C) Same data as in B, but data has been summarized by the mean (expression, x-axis) or median (ephys, y-axis) value within each cell type. rs indicates Spearman rank correlation and padj indicates Benjamini Hochberg false discovery rate. Note that cell types with high Rin, such as cerebellar granule cells and midbrain dopaminergic cells, express high levels of Nkain1 whereas cell types with low Rin, including neocortical and hippocampal pyramidal cells, express low levels of Nkain1. D) Corresponding summary data from the Allen Institute for Brain Science (AIBS) Cell Types dataset. Dots reflect averaged values from 12 individual mouse cre-lines and are detailed in Table 2. Expression values are based on single-cell RNAseq (scRNAseq), quantified as Transcripts Per Million (TPM). Ephys values are based on single-cell characterization in vitro.
Fig 2
Fig 2. Identification and validation of transcriptomic—electrophysiological correlations.
A) Count of genes significantly correlated with various electrophysiological properties, broken down by statistical significance of Benjamini-Hochberg FDR-adjusted correlation p-values (padj). Names and descriptions of ephys properties are provided in S1 Table. B) Comparison of correlations calculated using NeuroExpresso/ NeuroElectro discovery dataset (NeuExp/NeuElec, x-axis) versus correlations calculated using Allen Institute validation dataset (AIBS, y-axis). Dots reflect correlation values of individual genes. Subpanels indicate correlations computed across various electrophysiological properties and p-values are provided in Table 3.
Fig 3
Fig 3. Multivariate gene expression can predict cell type-specific electrophysiological parameters.
A) Comparison of observed action potential amplitudes (APamp; x-axis) to predicted values (y-axis) using gene expression-based statistical models trained using the NeuroExpresso/NeuroElectro discovery dataset. The y-value of each point (a cell type) is based on leave-one-out cross-validation (LOOCV). R2LOOCV indicates the calculated R2 across the set of cell type predictions and grey line indicates the unity line. B) Same as A, but observed and predicted values are based on the AIBS validation dataset. Ephys predictions on y-axis are made by applying the discovery dataset-based models (as in A) to the AIBS-dataset multivariate gene expression profiles. R2AIBS is calculated across the set of predictions made for the AIBS cell types and grey line indicates best linear fit. C,D) Same as A and B, but for maximum firing rate (FRmax). E) Summarized performance of gene expression-based statistical models for predicting ephys parameters. Large dots indicate the R2LOOCV from the NeuExp/NeuElec discovery dataset (pink), R2AIBS values from the validation dataset (green), and R2LOOCV values on a version of the NeuExp/NeuElec discovery dataset where cell type labels were randomly shuffled (blue). Boxplots are based on 100 bootstrap resamples of the discovery dataset and small dots indicate boxplot outliers.
Fig 4
Fig 4. Ion channel specific gene-electrophysiological correlations and literature evidence for causal regulation.
A) Heatmap showing NeuExp/NeuElec dataset gene-ephys correlations for ion channel genes. Genes filtered for those with at least one significant ephys correlation (padj < 0.05) and with validation supported in AIBS dataset. Gene names in bold indicate those we found to be previously studied for specific predicted ephys properties, based on our literature search. Symbols within heatmap: ·, padj <0.1; *, padj <0.05; **, padj <0.01; /, indicates inconsistency between discovery and AIBS validation dataset. B) Correlation between cell type-specific Scn1a (Nav1.1) gene expression and maximum firing rate (FRmax) from discovery dataset (NeuExp/NeuElec, left) and Allen Institute dataset (AIBS, right). Grey trend lines indicate linear fit. C) Replotted data from [33], showing evoked firing rates at 300 pA current injection for parvalbumin positive interneurons in control and Scn1a heterozygous mice (Scn1a +/-). Data plotted as mean +/- SEM. D) Same as B, but for Hcn3 and resting membrane potential (Vrest). E) Replotted data from [34], where Vrest from CA1 OLM interneurons was measured before and after the application of ZD7288, a selective antagonist of HCN channels. F) Same as B, but for Gabrd and Vrest. G) Replotted data from [35], showing Vrest recorded from dorsal motor nucleus of vagus neurons after application of THIP, a selective agonist of Gabrd-mediated tonic inhibition.
Fig 5
Fig 5. Summary of gene-ephys correlations for selected functional gene sets.
A) Genes regulating ion channels and transporter function. B) Ion transporters. C) Transcription factors. Genes filtered for those with at least one statistically significant correlation with an ephys property (padj < 0.05) and validating in AIBS dataset. Symbols within heatmap: ·, padj <0.1; *, padj <0.05; **, padj <0.01; /, indicates inconsistency between discovery and AIBS dataset.

References

    1. Padmanabhan K, Urban NN. Intrinsic biophysical diversity decorrelates neuronal firing while increasing information content. Nat Neurosci. 2010;13: 1276–1282. doi: 10.1038/nn.2630 - DOI - PMC - PubMed
    1. Tripathy SJ, Padmanabhan K, Gerkin RC, Urban NN. Intermediate intrinsic diversity enhances neural population coding. Proc Natl Acad Sci. 2013;110: 8248–8253. doi: 10.1073/pnas.1221214110 - DOI - PMC - PubMed
    1. Bernard G, Shevell MI. Channelopathies: A Review. Pediatr Neurol. 2008;38: 73–85. doi: 10.1016/j.pediatrneurol.2007.09.007 - DOI - PubMed
    1. Klassen T, Davis C, Goldman A, Burgess D, Chen T, Wheeler D, et al. Exome sequencing of ion channel genes reveals complex profiles confounding personal risk assessment in epilepsy. Cell. 2011;145: 1036–1048. doi: 10.1016/j.cell.2011.05.025 - DOI - PMC - PubMed
    1. Tai C, Abe Y, Westenbroek RE, Scheuer T, Catterall WA. Impaired excitability of somatostatin- and parvalbumin-expressing cortical interneurons in a mouse model of Dravet syndrome. Proc Natl Acad Sci. 2014;111: E3139–E3148. doi: 10.1073/pnas.1411131111 - DOI - PMC - PubMed

LinkOut - more resources