. 2017 Nov 1;9(11):3122-3136.
doi: 10.1093/gbe/evx218.

Lateralized Feeding Behavior is Associated with Asymmetrical Neuroanatomy and Lateralized Gene Expressions in the Brain in Scale-Eating Cichlid Fish

Affiliations

Lateralized Feeding Behavior is Associated with Asymmetrical Neuroanatomy and Lateralized Gene Expressions in the Brain in Scale-Eating Cichlid Fish

Hyuk Je Lee et al. Genome Biol Evol. .

Abstract

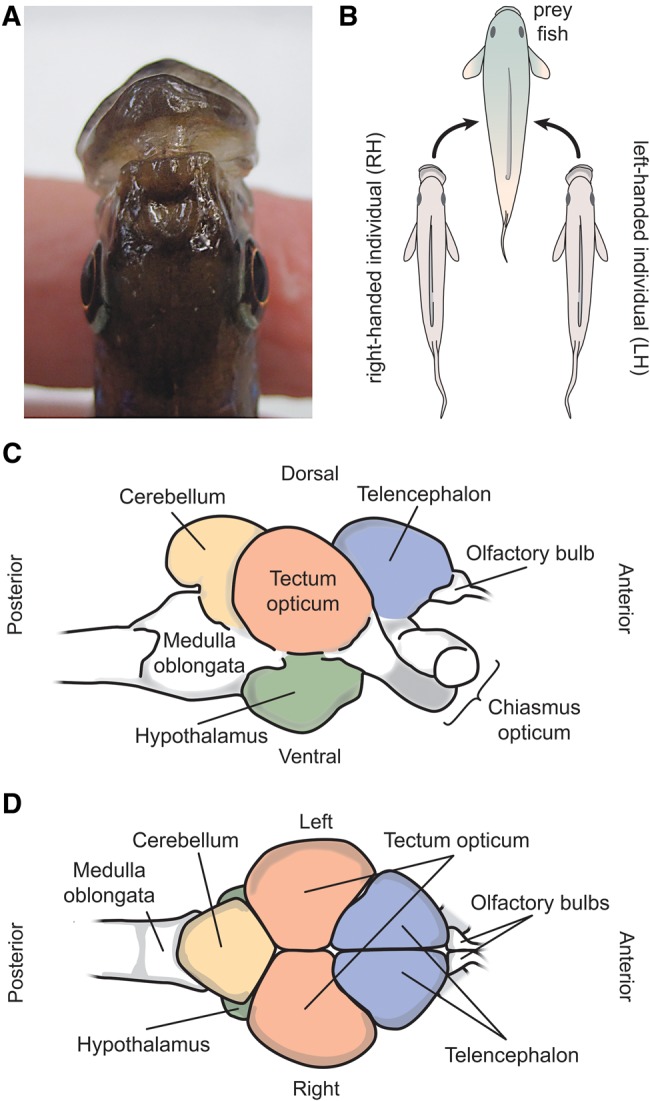
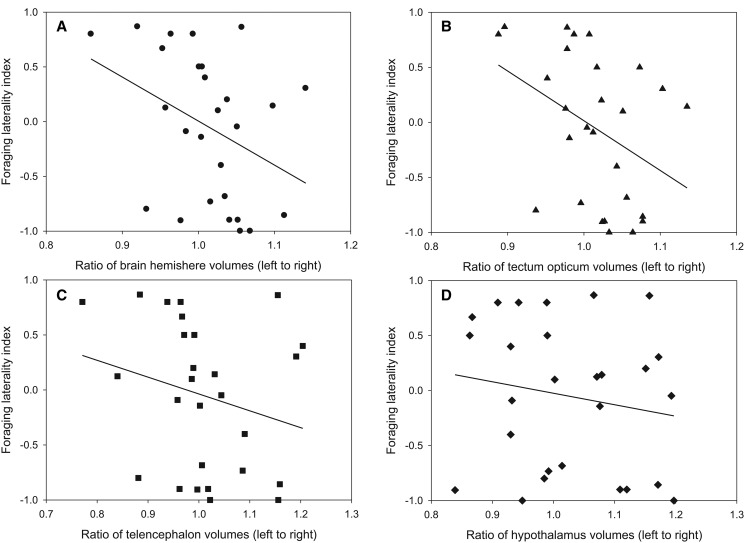
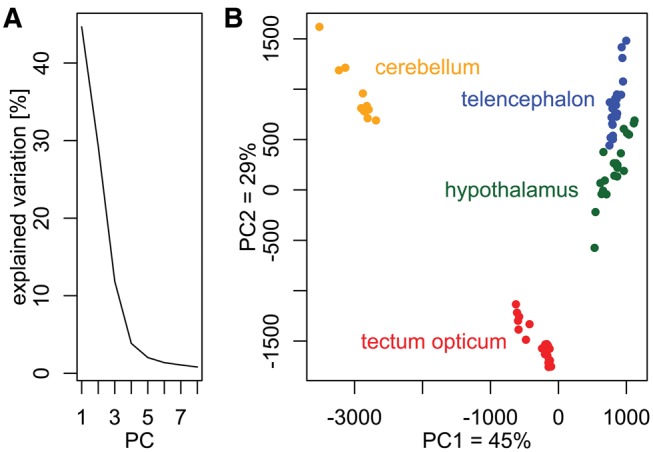
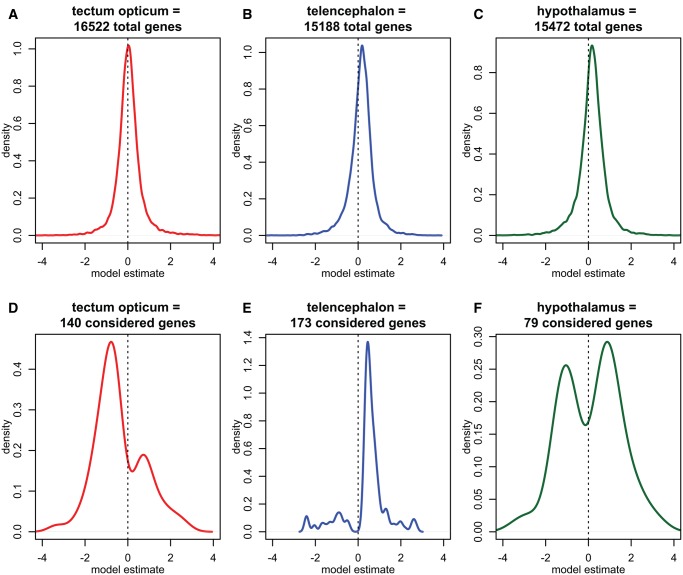
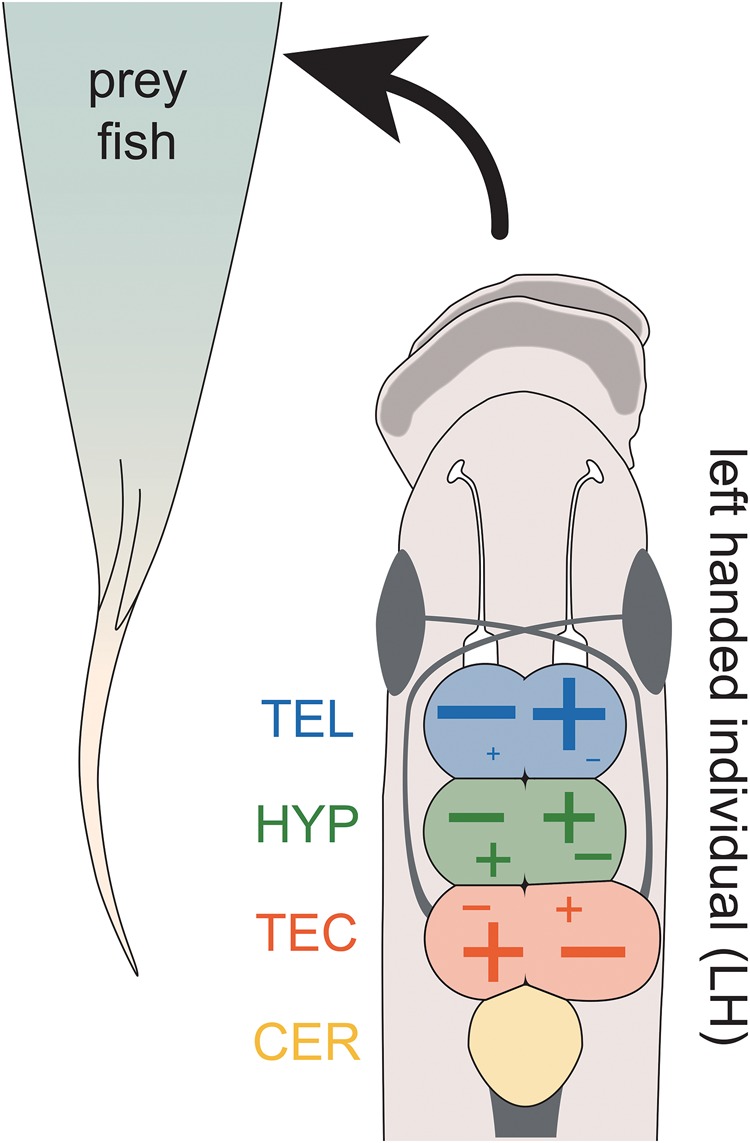
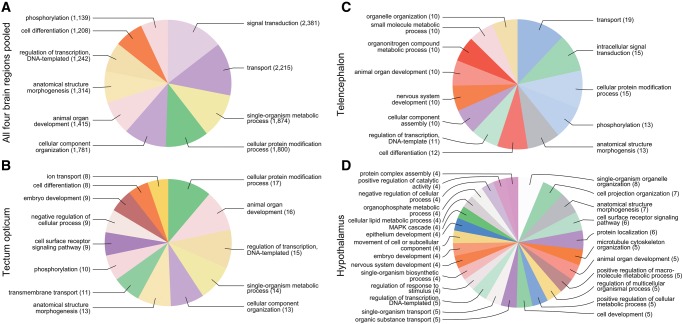
Lateralized behavior ("handedness") is unusual, but consistently found across diverse animal lineages, including humans. It is thought to reflect brain anatomical and/or functional asymmetries, but its neuro-molecular mechanisms remain largely unknown. Lake Tanganyika scale-eating cichlid fish, Perissodus microlepis show pronounced asymmetry in their jaw morphology as well as handedness in feeding behavior-biting scales preferentially only from one or the other side of their victims. This makes them an ideal model in which to investigate potential laterality in neuroanatomy and transcription in the brain in relation to behavioral handedness. After determining behavioral handedness in P. microlepis (preferred attack side), we estimated the volume of the hemispheres of brain regions and captured their gene expression profiles. Our analyses revealed that the degree of behavioral handedness is mirrored at the level of neuroanatomical asymmetry, particularly in the tectum opticum. Transcriptome analyses showed that different brain regions (tectum opticum, telencephalon, hypothalamus, and cerebellum) display distinct expression patterns, potentially reflecting their developmental interrelationships. For numerous genes in each brain region, their extent of expression differences between hemispheres was found to be correlated with the degree of behavioral lateralization. Interestingly, the tectum opticum and telencephalon showed divergent biases on the direction of up- or down-regulation of the laterality candidate genes (e.g., grm2) in the hemispheres, highlighting the connection of handedness with gene expression profiles and the different roles of these brain regions. Hence, handedness in predation behavior may be caused by asymmetric size of brain hemispheres and also by lateralized gene expressions in the brain.

Keywords: Perissodus microlepis; behavioral genetics/genomics; left-right asymmetry; neural structures; tectum opticum; telencephalon.


Figures

<sc>Fig</sc>. 1.
Fig. 1.
—A textbook example of a correlation between mouth asymmetry and lateralized foraging behavior in the scale-eating cichlid fish, Perissodus microlepis, from Lake Tanganyika. Note that this expected relationship is sometimes less strong in laboratory-reared fish (Lee et al. 2012; in the current study). (A) Dorsal view of left-bending mouth morph of this species. (B) Right-bending morphs preferentially attack left flanks of the prey fish (right-handed [RH]), and left-bending morphs prefer to feed from right flanks (left-handed [LH]). (C) Lateral and (D) Dorsal illustration of a Perissodus microlepis brain. Brains were dissected and the paired structures, hypothalamus, tectum opticum, and telencephalon, and the unpaired one, cerebellum, were used for gene expression analyses.
<sc>Fig</sc>. 2.
Fig. 2.
—Relationship between brain anatomical left–right asymmetry and lateralized foraging behavior in P. microlepis. (A) A significant negative correlation was detected between ratio of brain hemisphere volumes (left to right) and foraging laterality index [Spearmans’ rho (ρ) =  −0.394, N = 27, P = 0.042]. The brain structures used for the estimates of brain hemisphere volume include tectum opticum (B), telencephalon (C), and hypothalamus (D). At the brain-structure level, only the tectum opticum showed a significant negative relationship (ρ =  −0.455, N = 27, P = 0.017).
<sc>Fig</sc>. 3.
Fig. 3.
—PCA (Principal Component Analysis) of normalized count data from all 81 RNA samples. (A) A scree plot showing the percentage of explained variation per principal component (PC). The first eight PCs explained ∼95% of all variation of the dataset. (B) Scatter-plot of PC1 and PC2 (∼74% of variation). Gene expression profiles were distinct among the four brain regions, particularly the cerebellum, and the tectum opticum was different from the telencephalon and the hypothalamus, which had somewhat more similar loadings on PC1 and PC2.
<sc>Fig</sc>. 4.
Fig. 4.
—Density plots of linear model slopes for the three paired brain regions. (AC) Density plots of the linear regression model slopes (i.e., the slope estimate) of all genes tested in the respective brain region prior to candidate gene selection. (DF) Density plots of the linear regression model slopes of selected candidate genes per brain region. (D) Most candidate genes of the tectum opticum region had a negative model slope, that is, the more behavioral laterality a fish showed, the relatively higher the gene was expressed in the brain hemisphere facing its prey. (E) In the telencephalon almost all candidate genes had a positive model slope, that is, were relatively down-regulated in the brain side facing the prey. (F) Fewest candidate genes were detected in the hypothalamus, in which slightly more genes had a positive slope than a negative slope.
<sc>Fig</sc>. 5.
Fig. 5.
—Neuroanatomical and transcriptional patterns reflect behavioral laterality in P. microlepis. The more lateralized feeding behavior, the larger the hemisphere of the tectum opticum (TEC) that is processing the information of the body side facing the prey fish. Expression differences in the candidate genes between brain hemisphere regions were increased with increasing behavioral laterality. However, the direction of up- (+) or down- (−) regulation in candidate genes showed divergent biases among the brain regions as illustrated. In the telencephalon (TEL), ∼85% of candidate genes showed an increase in the hemisphere fold-change with an increasing feeding laterality index (FLI), that is, most genes were relatively up-regulated in the brain hemisphere not facing the prey fish. This trend was less pronounced in the hypothalamus (HYP) where only ∼60% of genes were relatively upregulated in the same hemisphere and was completely reversed in the tectum opticum (TEC) where most genes were relatively up-regulated in the hemisphere facing the prey fish.
<sc>Fig</sc>. 6.
Fig. 6.
—Gene ontology (GO) term analysis on biological processes of all genes (A) pooled across all four brain regions, and on genes with a linear relationship to behavioral laterality in the paired (B) tectum opticum, (C) telencephalon, and (D) hypothalamus. GO term composition suggests that laterality candidate genes belong to different biological processes and their composition is brain region specific.

References

    1. Ades C, Ramires EN.. 2002. Asymmetry of leg use during prey handling in the spider Scytodes globula (Scytodidae). J Insect Behav. 15:563–570.http://dx.doi.org/10.1023/A:1016337418472 - DOI
    1. Al-Akel AS, Guthrie DM, Banks JR.. 1986. Motor responses to localized electrical stimulation of the tectum in the freshwater perch (Perca fluviatilis). Neuroscience 19(4):1381–1391.http://dx.doi.org/10.1016/0306-4522(86)90150-8 - DOI - PubMed
    1. Alcock J. 2009. Animal behavior. Sunderland: Sinauer Associates.
    1. Aubin-Horth N, Landry CR, Letcher BH, Hofmann HA.. 2005. Alternative life histories shape brain gene expression profiles in males of the same population. Proc Biol Sci. 272(1573):1655–1662. - PMC - PubMed
    1. Bianco IH, Wilson SW.. 2009. The habenular nuclei: a conserved asymmetric relay station in the vertebrate brain. Philos Trans R Soc Lond B Biol Sci. 364(1519):1005–1020. - PMC - PubMed

Publication types