. 2018 Jan 4;46(D1):D726-D735.
doi: 10.1093/nar/gkx967.

EBI Metagenomics in 2017: enriching the analysis of microbial communities, from sequence reads to assemblies

Affiliations

EBI Metagenomics in 2017: enriching the analysis of microbial communities, from sequence reads to assemblies

Alex L Mitchell et al. Nucleic Acids Res. .

Abstract

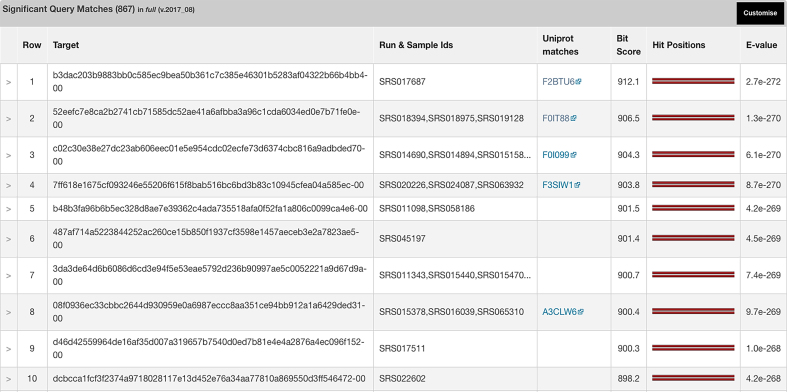
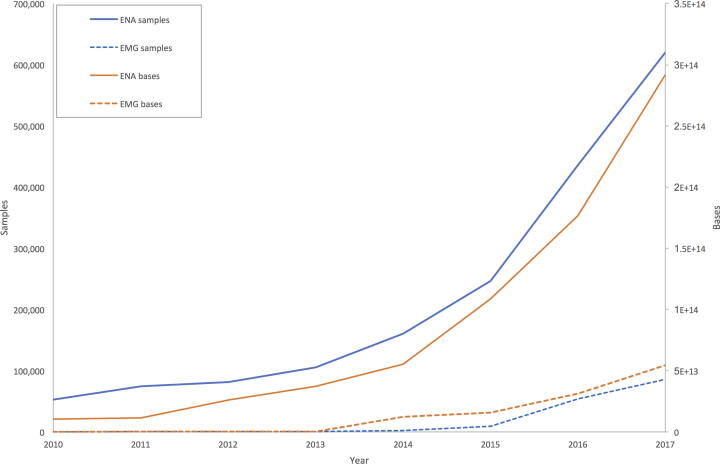
EBI metagenomics (http://www.ebi.ac.uk/metagenomics) provides a free to use platform for the analysis and archiving of sequence data derived from the microbial populations found in a particular environment. Over the past two years, EBI metagenomics has increased the number of datasets analysed 10-fold. In addition to increased throughput, the underlying analysis pipeline has been overhauled to include both new or updated tools and reference databases. Of particular note is a new workflow for taxonomic assignments that has been extended to include assignments based on both the large and small subunit RNA marker genes and to encompass all cellular micro-organisms. We also describe the addition of metagenomic assembly as a new analysis service. Our pilot studies have produced over 2400 assemblies from datasets in the public domain. From these assemblies, we have produced a searchable, non-redundant protein database of over 50 million sequences. To provide improved access to the data stored within the resource, we have developed a programmatic interface that provides access to the analysis results and associated sample metadata. Finally, we have integrated the results of a series of statistical analyses that provide estimations of diversity and sample comparisons.


Figures

Figure 1.
Figure 1.
Illustration of the number of projects and runs analysed from each biome. The number of projects and runs from different study types are shown on consecutive log axes. This figure was produced using the iTOL server (44).
Figure 2.
Figure 2.
Schematic representations of the EBI metagenomics pipeline versions 3.0 (A) and 4.0 (B). Tools and reference databases updated in each release are indicated by a magenta circle and described in detail within the text. Processing steps are indicated in the colour rounded boxes (yellow, blue, green), tools in dark grey boxes and databases in light grey boxes. Input and output files as white squares. The combined gene caller component is indicated as CGC.
Figure 3.
Figure 3.
Krona plots showing taxonomic classification of run ERR771104 from Ocean Sampling Day 2014 (ENA project accession PRJEB8682). (A) Produced using version 2.0 of the pipeline and (B) using version 4.0. Prokaryotic taxonomic lineages are shown in red, eukaryotic in blue and unclassified in grey. The total number of 16S rRNA/SSU input sequences was similar in each case (976 with version 2.0 versus 1008 with version 4.0).
Figure 4.
Figure 4.
Correlation between temperature (A) and depth (B) and photosynthesis-related GO term counts, normalized by number of InterPro annotations, for Tara Oceans project PRJEB1787. Metadata and annotations were retrieved from the API and combined on the fly to generate the visualizations.
Figure 5.
Figure 5.
HMMER search results using the assembled peptide database. Searching the full length subdivision of the assembled peptide database with an arginine deiminase from Streptococcus sanguinis SK1057 (UniProt identifier: F2BTU6) identified over 800 sequences with a significant match (E-value < 1e–10) to the query sequence, with <9% (78 sequences) having an identical counterpart in UniProtKB.
Figure 6.
Figure 6.
Growth of metagenomics data housed in ENA and processed by EBI Metagenomics (EMG). This graph shows the cumulative growth of environmental data in the two resources (ENA: solid lines, EMG: dashed lines) according to two different metrics: numbers of samples (blue) and number of bases (orange).

References

    1. Wilson M.C., Mori T., Rückert C., Uria A.R., Helf M.J., Takada K., Gernert C., Steffens U.A.E., Heycke N., Schmitt S. et al. . An environmental bacterial taxon with a large and distinct metabolic repertoire. Nature. 2014; 506:58–62. - PubMed
    1. Spang A., Saw J.H., Jørgensen S.L., Zaremba-Niedzwiedzka K., Martijn J., Lind A.E., van Eijk R., Schleper C., Guy L., Ettema T.J.G.. Complex archaea that bridge the gap between prokaryotes and eukaryotes. Nature. 2015; 521:173–179. - PMC - PubMed
    1. Burstein D., Harrington L.B., Strutt S.C., Probst A.J., Anantharaman K., Thomas B.C., Doudna J.A., Banfield J.F.. New CRISPR-Cas systems from uncultivated microbes. Nature. 2017; 542:237–241. - PMC - PubMed
    1. Ovchinnikov S., Park H., Varghese N., Huang P.-S., Pavlopoulos G.A., Kim D.E., Kamisetty H., Kyrpides N.C., Baker D.. Protein structure determination using metagenome sequence data. Science. 2017; 355:294–298. - PMC - PubMed
    1. Chen J., Wright K., Davis J.M., Jeraldo P., Marietta E.V., Murray J., Nelson H., Matteson E.L., Taneja V.. An expansion of rare lineage intestinal microbes characterizes rheumatoid arthritis. Genome Med. 2016; 8:43. - PMC - PubMed

Publication types