. 2017 Oct 24;21(4):1102-1115.
doi: 10.1016/j.celrep.2017.10.013.

Tracking the Same Neurons across Multiple Days in Ca2+ Imaging Data

Affiliations

Tracking the Same Neurons across Multiple Days in Ca2+ Imaging Data

Liron Sheintuch et al. Cell Rep. .

Abstract

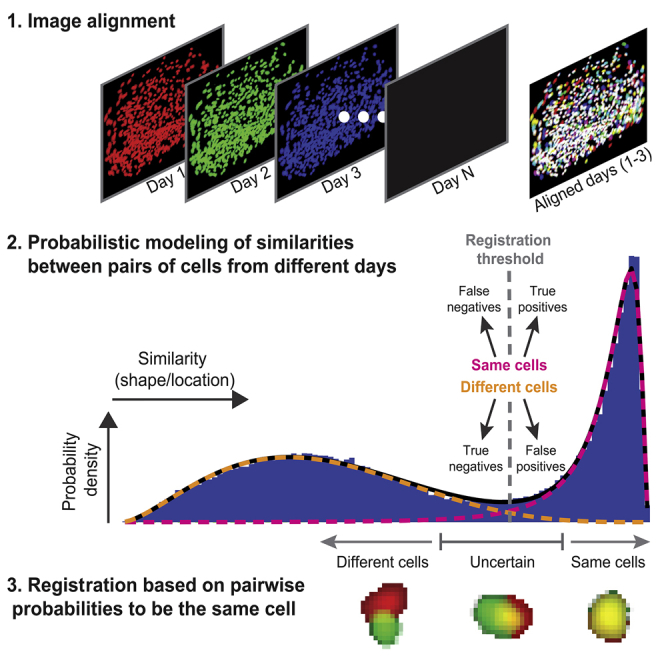
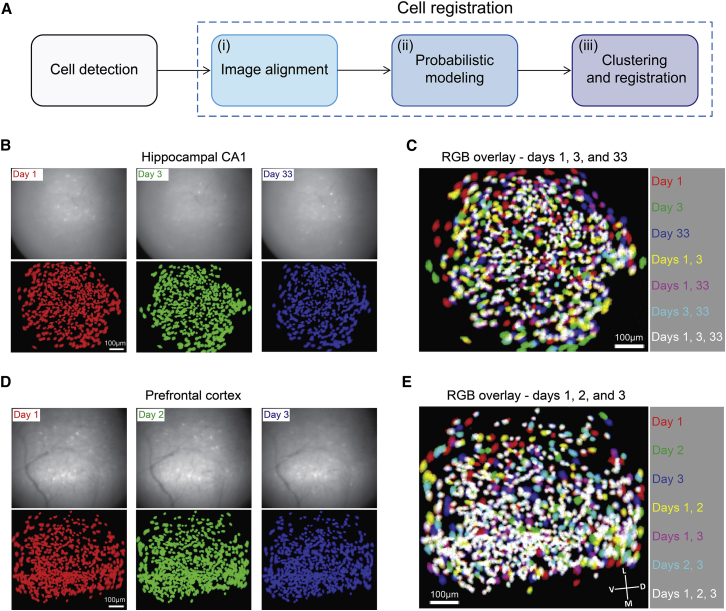
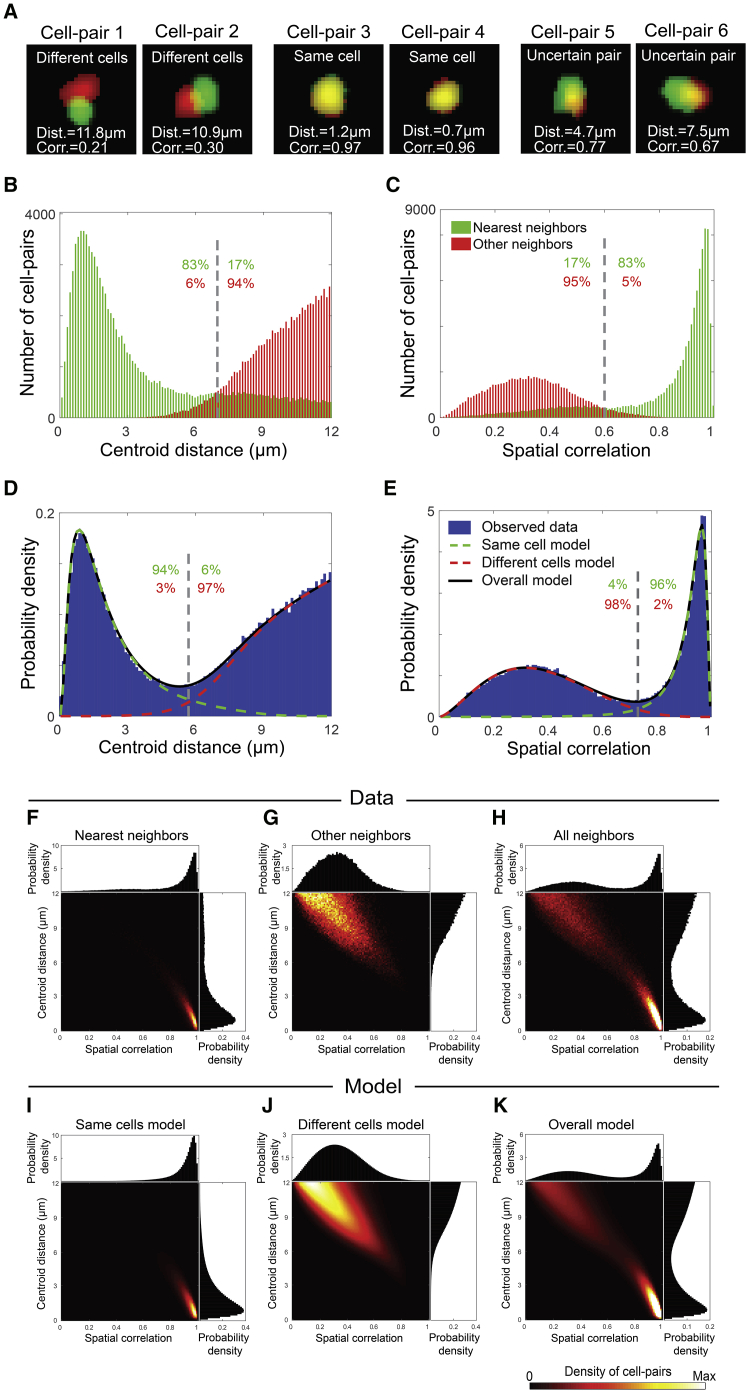
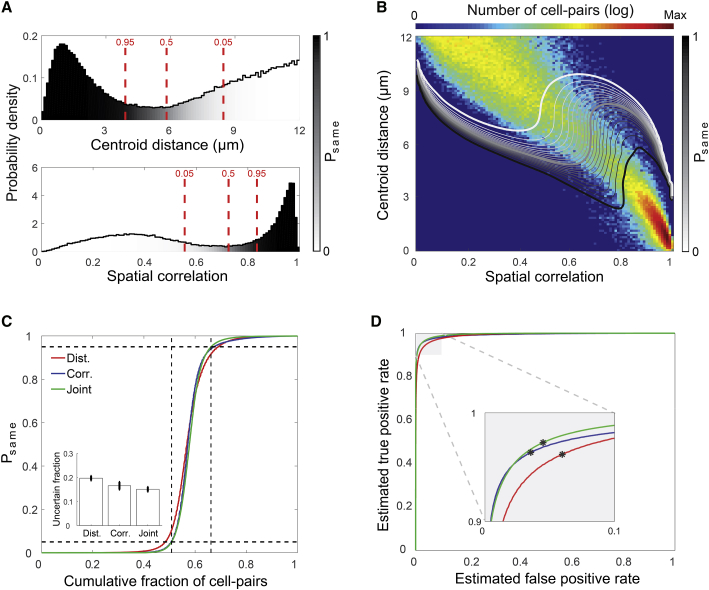
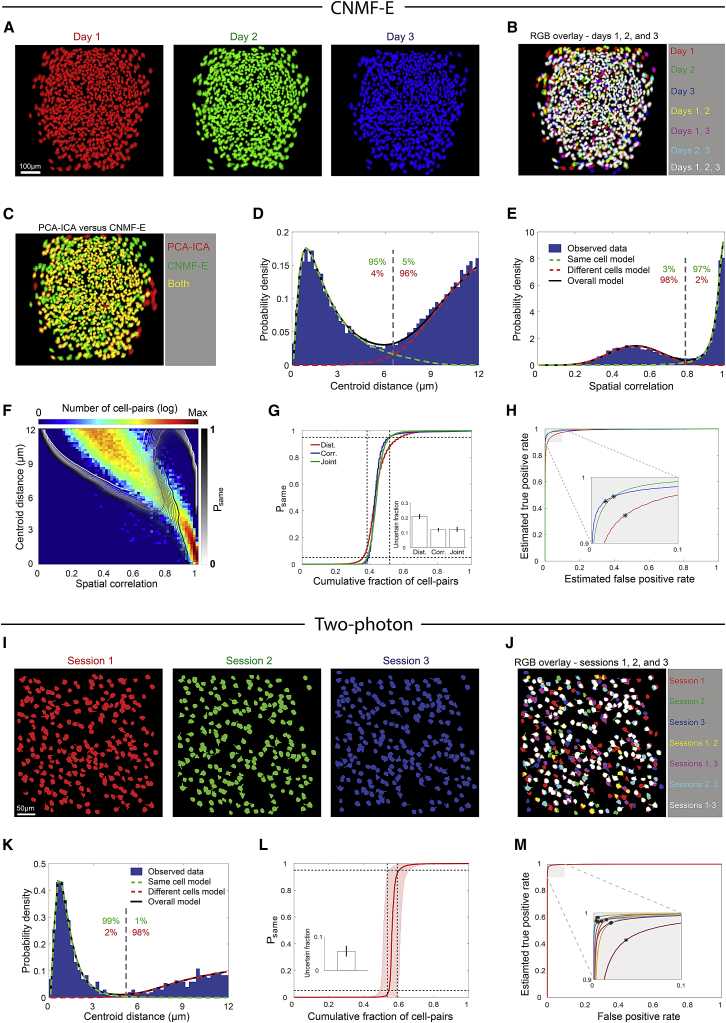
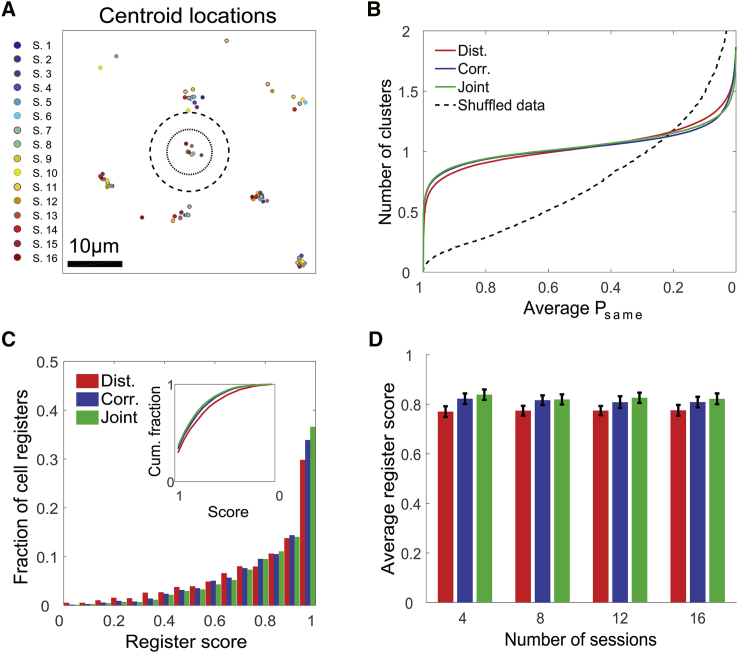
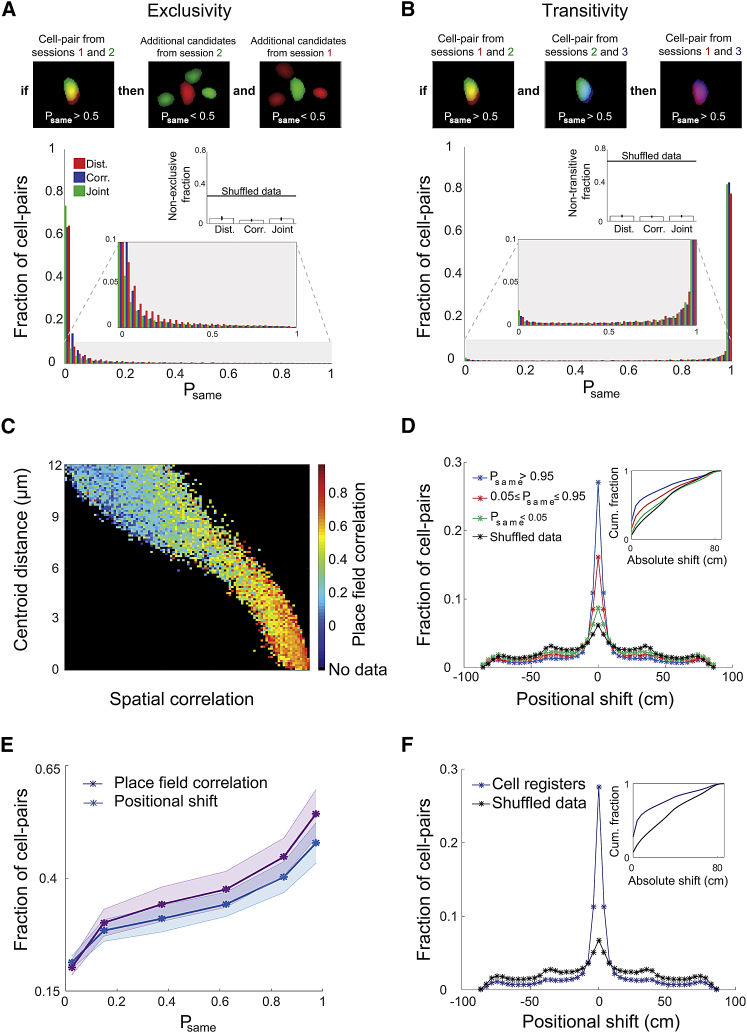
Ca2+ imaging techniques permit time-lapse recordings of neuronal activity from large populations over weeks. However, without identifying the same neurons across imaging sessions (cell registration), longitudinal analysis of the neural code is restricted to population-level statistics. Accurate cell registration becomes challenging with increased numbers of cells, sessions, and inter-session intervals. Current cell registration practices, whether manual or automatic, do not quantitatively evaluate registration accuracy, possibly leading to data misinterpretation. We developed a probabilistic method that automatically registers cells across multiple sessions and estimates the registration confidence for each registered cell. Using large-scale Ca2+ imaging data recorded over weeks from the hippocampus and cortex of freely behaving mice, we show that our method performs more accurate registration than previously used routines, yielding estimated error rates <5%, and that the registration is scalable for many sessions. Thus, our method allows reliable longitudinal analysis of the same neurons over long time periods.

Keywords: GCaMP6; calcium imaging; cell registration; fluorescence imaging; hippocampus; image alignment; microendoscopy; miniature microscopes; place cells; two-photon microscopy.


Figures

None
Graphical abstract
Figure 1
Figure 1
Cells Maintain Their Locations and Shapes over Weeks (A–E) In (A), the main steps in the cell registration procedure are indicated. (B and D) Top: representative single frames from raw fluorescence data of imaging sessions recorded on three different days. Bottom: projection of all spatial footprints for the same three sessions, indicated in red, green, and blue. (B) Hippocampal CA1. (D) Prefrontal cortex. (C and E) Overlays of the aligned spatial footprint maps shown for (C) hippocampal CA1, as shown in (B), and for (E) prefrontal cortex, as shown in (D). D, dorsal; L, lateral; M, medial; V, ventral. Data were recorded in the hippocampal CA1 of a Thy1-GCaMP6f transgenic mouse (B and C) and in the prefrontal cortex of a CaMKII-GCaMP6s transgenic mouse (D and E) while freely exploring the same environments. See also Figures S1 and S2.
Figure 2
Figure 2
Distributions of Spatial Footprint Similarities Modeled as a Weighted Sum of Two Subpopulations (A) Six examples of candidates to be the same cell, with their measured centroid distances (Dist.) and spatial correlations (Corr.). The spatial footprints are shown in red (session 1) and green (session 2). (B and C) Distribution of centroid distances (B) and spatial correlations (C) between pairs of nearest neighbors (green) and other neighbors (red) across sessions. Gray dashed lines show the intersection between the two distributions. The fraction of nearest neighbors (green) or other neighbors (red) above and below these intersections are indicated. (D and E) Distributions of centroid distances (D) and spatial correlations (E) between all neighboring cell-pairs (blue bars) and the modeled distributions of same cells (dashed green curves), different cells (dashed red curves), and their weighted sum (solid black curves). Gray dashed lines show the intersection between the two models. Estimated fractions of same cells (green) or different cells (red) above and below these intersections are indicated. (F–H) Joint and marginal distributions of centroid distances and spatial correlations between pairs of nearest neighbors (F), other neighbors (G), and all neighbors (H) across sessions. (I–K) Modeled joint and marginal distributions of centroid distances and spatial correlations for same cells (I), different cells (J), and their weighted sum (K). In (H) and (K), the color scale was set to reach 0.25 of the maximal value to enable visualization of both subpopulations. Data and models in all panels are for 16 sessions recorded on 8 different days in the hippocampal CA1 of a mouse while freely exploring the same environments. See also Figures S3, S4, S5, and S6.
Figure 3
Figure 3
Modeling the Data Supports Reliable Cell Registration across Pairs of Sessions (A and B) Shown in (A): distributions of centroid distances (top) and spatial correlations (bottom) between neighboring cell-pairs. The grayscale color code indicates the probability for two cells from two different sessions to be the same cell (Psame). Red lines show Psame = 0.05, Psame = 0.5, and Psame = 0.95. (B) Contours of Psame overlaid on the joint distribution of centroid distances and spatial correlations for neighboring cell-pairs. Numbers of cell-pairs are displayed in a logarithmic scale. The Psame = 0.05, Psame = 0.5, and Psame = 0.95 contours are highlighted by thicker white, gray, and black curves, respectively. Data in (A) and (B) are the same as in Figure 2. (C and D) Shown in (C): the cumulative fraction of cell-pairs as a function of the estimated Psame for the centroid distances (red), spatial correlations (blue), and joint (green) models. Black dashed horizontal lines represent the Psame = 0.05 and Psame = 0.95 levels, while the vertical lines show the joint model’s intersection with those probabilities, indicating the fraction of uncertain registrations. Inset: the fraction of cell-pairs in the uncertain registration range (mean ± SEM). (D) Estimated ROC curves for the centroid distances (red), spatial correlations (blue), and joint (green) models. Inset: zoom-in on the near-optimal part of the ROC. Black asterisks represent the Psame = 0.5 threshold. Data in (C) and (D) were pooled from 12 mice.
Figure 4
Figure 4
The Cell Registration Method Is Applicable to Different Types of Imaging Data (A–H) Registration is applicable to cells detected using CNMF-E. (A) Projection of all spatial footprints for three imaging sessions recorded on three different days, indicated in red, green, and blue. (B) Overlay of the aligned spatial footprint maps shown in (A). (C) Overlay of spatial footprint maps detected using PCA-ICA (red) and CNMF-E (green) for the same session. (D and E) Distributions of centroid distances (D) and spatial correlations (E) between all neighboring cell-pairs (blue bars) and the modeled distributions of same cells (dashed green curves), different cells (dashed red curves), and their weighted sum (solid black curves). Gray dashed lines show the intersection between the two distributions. Estimated fractions of same cells (green) or different cells (red) above and below these intersections are indicated. (F) Contours of Psame overlaid on the joint distribution of centroid distances and spatial correlations for neighboring cell-pairs. Numbers of cell-pairs are displayed in a logarithmic scale. The Psame = 0.05, Psame = 0.5, and Psame = 0.95 contours are highlighted by thicker white, gray, and black curves, respectively. (G) The cumulative fraction of cell-pairs as a function of the estimated Psame for the centroid distances (red), spatial correlations (blue), and joint (green) models. Black dashed horizontal lines represent the Psame = 0.05 and Psame = 0.95 levels, while the vertical lines show the joint model’s intersection with those probabilities. Inset: the fraction of cell-pairs in the uncertain registration range (mean ± SEM). (H) Estimated ROC curves for the centroid distances (red), spatial correlations (blue), and joint (green) models. Inset: zoom-in on the near-optimal part of the ROC. Black asterisks represent the Psame = 0.5 threshold. Data in (G) and (H) were pooled from five mice. (I–M) Registration is applicable to two-photon imaging data. (I) Projection of all spatial footprints for three imaging sessions recorded on three different days, indicated in red, green, and blue. (J) Overlay of the aligned spatial footprint maps shown in (I). (K) Distribution of centroid distances for neighboring cell-pairs (blue bars) and the modeled distribution of same cells (dashed green curve), different cells (dashed red curve), and their weighted sum (solid black curve). (L) Cumulative fraction of cell-pairs as a function of the estimated Psame for the centroid distances model (average ± SD represented by the red curve and shaded red area). Black dashed horizontal lines represent the Psame = 0.05 and Psame = 0.95 levels, while the vertical lines show the model’s intersection with those probabilities. Inset: the fraction of cell-pairs in the uncertain registration range (mean ± SEM). (M) Average estimated ROC curve. Inset: zoom-in on the near-optimal part of the ROC obtained for each mouse individually. Black asterisks represent the Psame = 0.5 threshold. Two-photon data in (I)–(M) were obtained from the Allen Brain Observatory, 2016, based on experiments consisting of three sessions recorded on three different days in the visual cortex of head-fixed behaving mice. Data in (L) and (M) were pooled from 10 mice.
Figure 5
Figure 5
Accurate Cell Registration Is Scalable for a Large Number of Sessions (A) Centroid locations of cells from 16 different sessions taken from a small part of the FOV. The inner circle represents a radius of 4 μm, and the outer (dashed) circle represents a radius of 7 μm. (B) The number of candidate clusters per cell remains ∼1 over a wide range of average Psame values for the centroid distances (red), spatial correlations (blue), and joint (green) models but not for the shuffled data (black dashed curve). (C) Distribution of register scores for the centroid distances (red), spatial correlations (blue), and joint (green) models. Inset: cumulative fraction of cell registers as a function of the register score reversed from 1 to 0. (D) Register score as a function of the number of registered sessions for the centroid distances (red), spatial correlations (blue), and joint (green) models (mean ± SEM). Data in (B) and (C) were pooled from 12 mice. Data in (D) were pooled from five mice. See also Figure S7.
Figure 6
Figure 6
Validation Based on the Exclusivity and Transitivity Principles and on Place-Field Stability across Days (A and B) Internal consistency between the model and the data. Exclusivity (A) and transitivity (B) measures for the centroid distances (red), spatial correlations (blue), and joint (green) models. (A) Top: illustration of the exclusivity principle. Bottom: distribution of Psame with additional pairing candidates, computed for cell-pairs from different sessions with Psame > 0.5. Insets: bottom, zoom-in on the lower area of the distribution; top, fraction of non-exclusive cell-pairs, i.e., Psame > 0.5 (mean ± SEM). (B) Top: illustration of the transitivity principle. Bottom: distribution of Psame for cell-pairs from different sessions, where each had Psame > 0.5 with the same cell from a third session. Insets: bottom, zoom-in on the lower area of the distribution; top, fraction of non-transitive cell-pairs, i.e., Psame < 0.5 (mean ± SEM). Data in (A) and (B) were pooled from an N of 12 mice. (C–F) Validation based on place-field stability across days. (C) Average place-field correlation between cell-pairs across days given their centroid distances and spatial correlations. The black area represents centroid distances and spatial correlations with no cell-pairs. (D) Distribution of place-field positional shifts across days for cell-pairs with Psame > 0.95 (blue), 0.05 ≤ Psame ≤ 0.95 (red), and Psame < 0.05 (green) and for shuffled data (black). Inset: the cumulative fraction of cell-pairs as a function of the absolute value of the positional shift. (E) Average fraction of neighboring cell-pairs with positional shifts ≤6 cm (blue) or place-field correlations >0.5 (purple) increase with Psame (linear regression: r2 = 0.94, p = 0.0015; and r2 = 0.93, p = 0.0018, respectively; SD is indicated with a shaded area). (F) Distribution of place-field positional shifts for cell-pairs taken from cell registers (blue) and shuffled data (black). Inset: the cumulative fraction of cell-pairs as a function of the absolute value of the positional shift. Data in (C)–(F) were pooled from an N of 5 mice. See also Movie S1.
Figure 7
Figure 7
Validation Based on Simulated Data (A) Distribution of centroid distances for neighboring cell-pairs (blue bars) and the modeled distribution of same cells (dashed green curve), different cells (dashed red curve), and their weighted sum (solid black curve). Estimated fractions of same cells (green) or different cells (red) above and below the intersection are indicated. (B) Estimated ROC curve. Inset: zoom-in on the near-optimal part of the ROC. Asterisks represent the actual true-positive and false-positive rates obtained with a registration threshold of Psame = 0.5 (blue), centroid distance of 5 μm (black), and centroid distance of 6 μm (dark gray). (C) Error rate (weighted average of false-positive and false-negative rates) as a function of the noise level, for a registration threshold of Psame = 0.5 (blue) and different centroid distance thresholds (shades of gray). Inset: the error rate obtained with the best centroid distance threshold (red dashed line) relative to the error rate obtained with a Psame value of 0.5 (black dashed line). Noise level is the mean centroid distance between the spatial footprints of the same cell in different sessions. (D) Measured fractions of neurons with stable coding as a function of the noise level, for a registration threshold of Psame = 0.5 (blue) and different centroid distance thresholds (shades of gray), compared to the true stability level and the stability fraction for shuffled data (red lines). (E) The significance of the difference between the measured stability and the shuffled data as a function of the true population effect size, for registration with a threshold of Psame = 0.5 (blue) and with different centroid distance thresholds (shades of gray), compared to an error-free measurement (magenta). Inset: zoom-in on the area with a P of 0.05. Effect size is the difference between the mean stability of the population and shuffled data divided by the stability SD. For (A), (B), and (E), a noise level of 3.2 μm was used.

References

    1. Bansal N., Blum A., Chawla S. Correlation clustering. Mach. Learn. 2004;56:89–113.
    1. Barretto R.P.J., Ko T.H., Jung J.C., Wang T.J., Capps G., Waters A.C., Ziv Y., Attardo A., Recht L., Schnitzer M.J. Time-lapse imaging of disease progression in deep brain areas using fluorescence microendoscopy. Nat. Med. 2011;17:223–228. - PMC - PubMed
    1. Berdyyeva T., Otte S., Aluisio L., Ziv Y., Burns L.D., Dugovic C., Yun S., Ghosh K.K., Schnitzer M.J., Lovenberg T., Bonaventure P. Zolpidem reduces hippocampal neuronal activity in freely behaving mice: a large scale calcium imaging study with miniaturized fluorescence microscope. PLoS ONE. 2014;9:e112068. - PMC - PubMed
    1. Burgess C.R., Ramesh R.N., Sugden A.U., Levandowski K.M., Minnig M.A., Fenselau H., Lowell B.B., Andermann M.L. Hunger-dependent enhancement of food cue responses in mouse postrhinal cortex and lateral amygdala. Neuron. 2016;91:1154–1169. - PMC - PubMed
    1. Cai D.J., Aharoni D., Shuman T., Shobe J., Biane J., Song W., Wei B., Veshkini M., La-Vu M., Lou J. A shared neural ensemble links distinct contextual memories encoded close in time. Nature. 2016;534:115–118. - PMC - PubMed

LinkOut - more resources