. 2017 Oct 24;21(4):953-965.
doi: 10.1016/j.celrep.2017.10.010.

In Vivo Translatome Profiling in Spinal Muscular Atrophy Reveals a Role for SMN Protein in Ribosome Biology

Affiliations

In Vivo Translatome Profiling in Spinal Muscular Atrophy Reveals a Role for SMN Protein in Ribosome Biology

Paola Bernabò et al. Cell Rep. .

Abstract

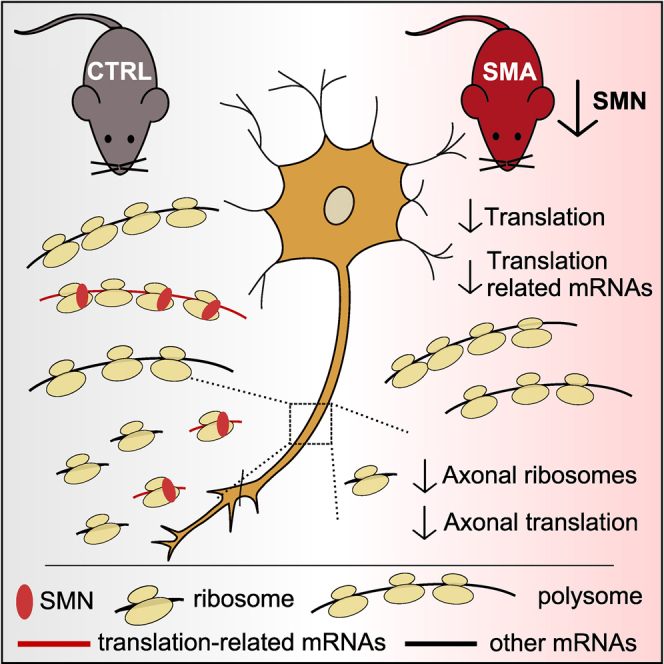
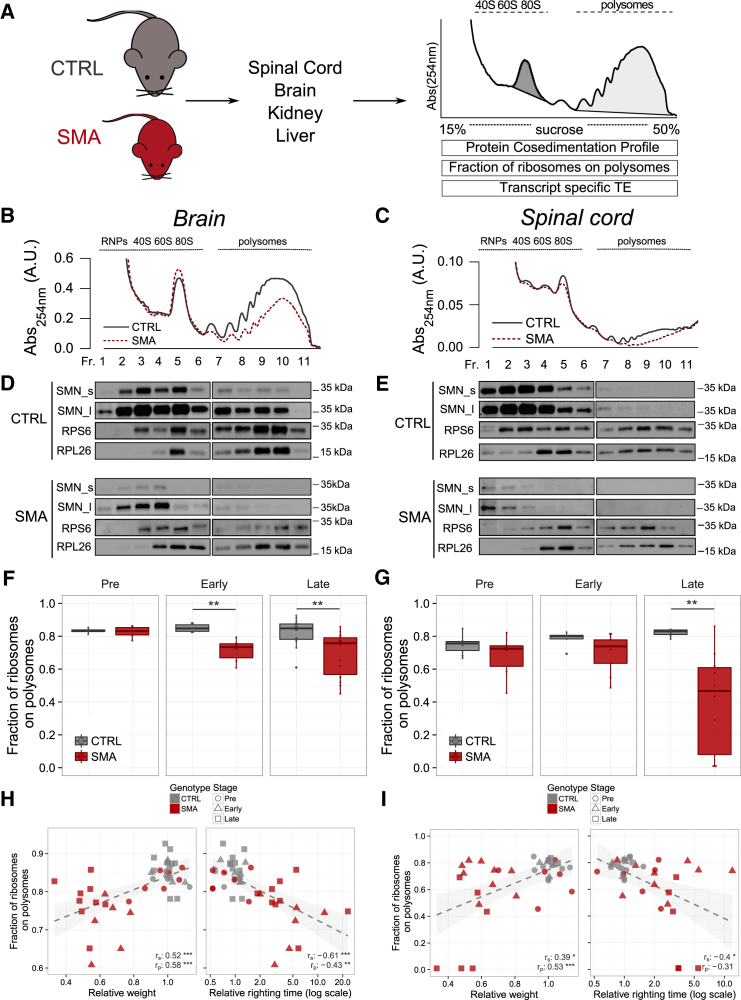
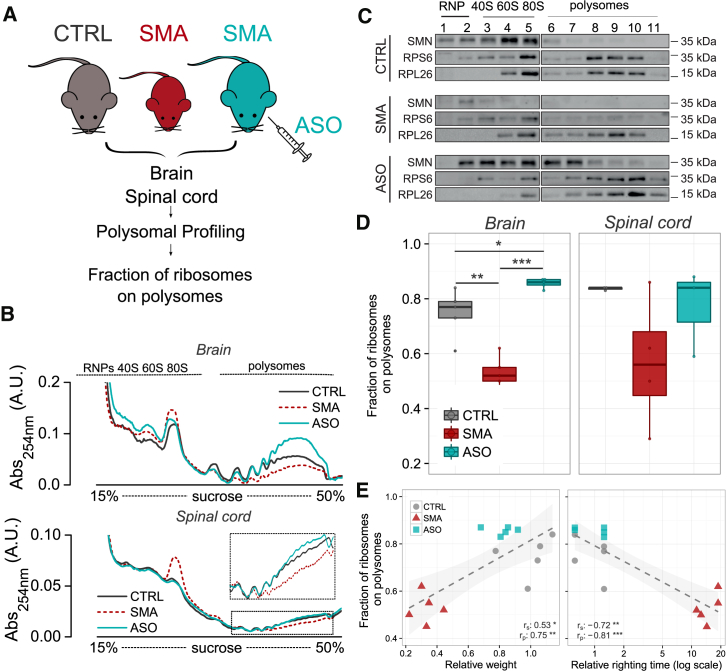
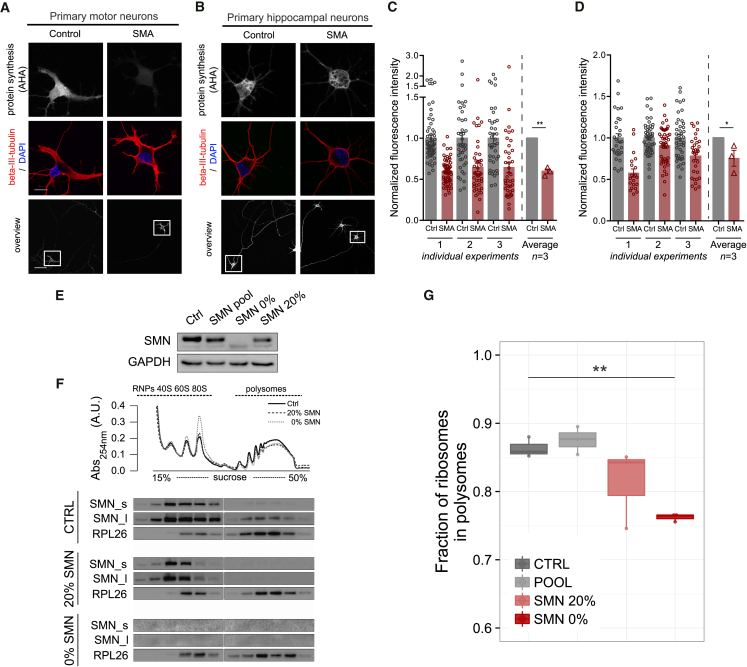
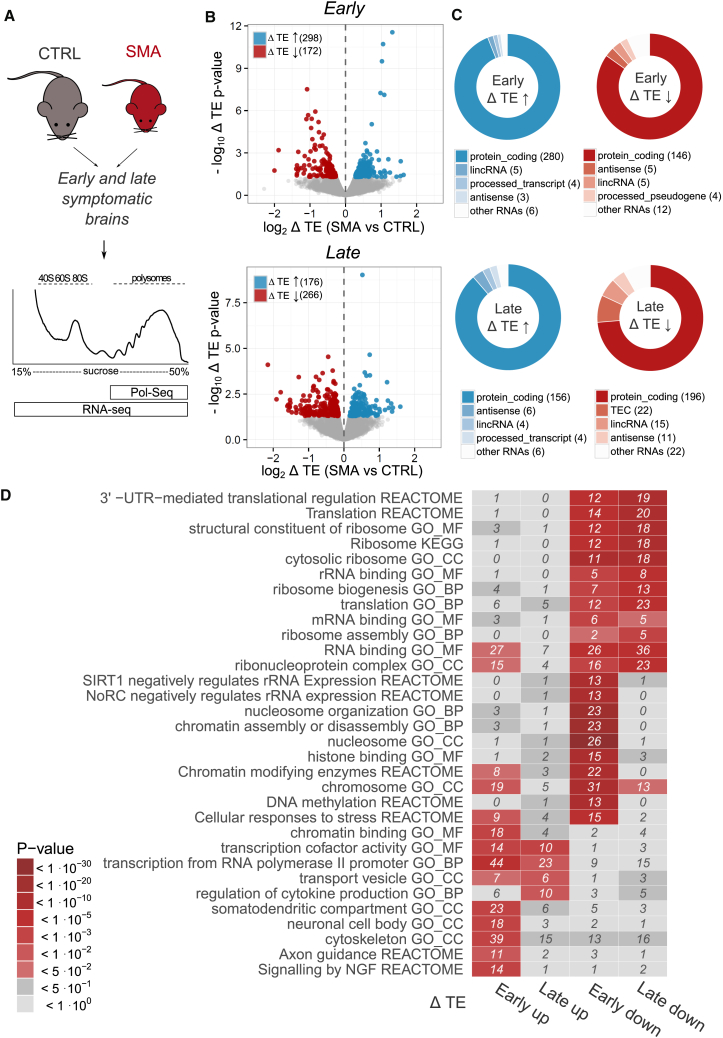
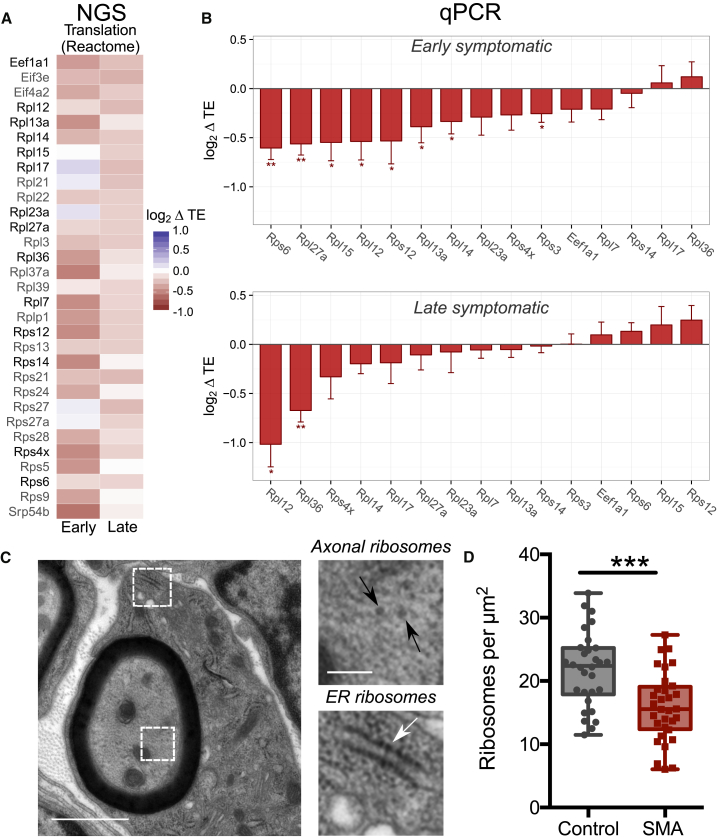
Genetic alterations impacting ubiquitously expressed proteins involved in RNA metabolism often result in neurodegenerative conditions, with increasing evidence suggesting that translation defects can contribute to disease. Spinal muscular atrophy (SMA) is a neuromuscular disease caused by low levels of SMN protein, whose role in pathogenesis remains unclear. Here, we identified in vivo and in vitro translation defects that are cell autonomous and SMN dependent. By determining in parallel the in vivo transcriptome and translatome in SMA mice, we observed a robust decrease in translation efficiency arising during early stages of disease. We provide a catalogue of RNAs with altered translation efficiency, identifying ribosome biology and translation as central processes affected by SMN depletion. This was further supported by a decrease in the number of ribosomes in SMA motor neurons in vivo. Overall, our findings suggest ribosome biology as an important, yet largely overlooked, factor in motor neuron degeneration.

Keywords: SMN; motor neuron disease; neurodegeneration; polysomal profiling; ribosome; spinal muscular atrophy; translatome.


Figures

None
Graphical abstract
Figure 1
Figure 1
Translation Is Impaired in Symptomatic SMA Nervous Tissues (A) Experimental design and analyses using polysomal profiles from control (CTRL) and SMA mouse tissues. (B and C) Sucrose gradient absorbance profiles from CTRL and SMA brains and spinal cords (late symptomatic). (D and E) Co-sedimentation profiles of SMN and ribosome markers RPS6 and RPL26 under the corresponding sucrose gradient. The signal of SMN along the profile is shown for short (SMN_s) and long (SMN_l) exposure times of acquisition. (F and G) Comparison between the fraction of ribosomes in polysomes (FRP) in CTRL and SMA mouse brains (F) and spinal cords (G) at three stages of disease (brain: pre-symptomatic, CTLR n = 4, SMA n = 7; early symptomatic: CTLR n = 6, SMA n = 6; late symptomatic: CTRL n = 16, SMA n = 14; spinal cord: pre-symptomatic: CTRL n = 7, SMA n = 6; early symptomatic: CTLR n = 5, SMA n = 9; late symptomatic: CTLR n = 7, SMA n = 10, p < 0.05, ∗∗p < 0.01, ∗∗∗p < 0.001, two-tailed t test). (H and I) Relationship between body weight (left) or righting time (right) and the corresponding FRP, obtained from CTRL and SMA mouse brains (H) and spinal cords (I). Each point corresponds to one mouse. Spearman and Pearson correlations between are indicated (p < 0.05, ∗∗p < 0.01, ∗∗∗p < 0.001, correlation test). See also Figure S1 and Data S1.
Figure 2
Figure 2
Treatment with ASO Recovers SMN Expression and Translation Defects in SMA Tissues (A) Experimental design. (B) Representative polysomal profiles obtained from brains (top) and spinal cords (bottom) in each experimental group. (C) Representative polysomal profiles obtained from CTRL, SMA, and SMA-ASO mouse brains (late symptomatic) and corresponding co-sedimentation profiles from each experimental group for SMN, RPS6, and RPL26. (D) FRP from CTRL, late-symptomatic SMA and SMA-ASO brains (left) and spinal cords (right) (CTRL, n = 5; SMA, n = 5; ASO, n = 5, p < 0.05, ∗∗p < 0.01, ∗∗∗p < 0.001, two-tailed t test). (E) Relationship between body weight (left) or righting time (right) and the corresponding FRP, obtained from CTRL, SMA, and ASO-treated mouse brains. Each point corresponds to one mouse. Spearman and Pearson correlations are indicated. (p < 0.05, ∗∗p < 0.01, ∗∗∗p < 0.001, correlation test). See also Figure S2.
Figure 3
Figure 3
Translation Defects are Cell Autonomous and Dependent on SMN Loss (A and B) Primary motor neurons (A) and primary hippocampal neurons (B) from control and SMA embryos were stained to reveal overall morphology (beta-III-tubulin, red) and nuclear integrity (DAPI, blue). Protein synthesis was visualized by labelling newly synthesized proteins with L-azidohomoalanine (AHA, gray scale, scale bars: 50 μm (overview), 10 μm (cell bodies; beta-III-tubulin/DAPI and AHA). DAPI, 4’,6-diamindion-2-phenylindole). (C) AHA fluorescence intensity values in individual primary motor neurons in three independent preparations: SMA (n = 43, 41, and 56) and control (n = 42, 40, and 56). (D) AHA fluorescence intensity values in individual primary hippocampal neurons in three independent preparations: SMA (n = 29, 50, and 48) and control (n = 20, 48, and 32) (∗∗p < 0.01, p < 0.05, Student’s t test; error bars ± SEM.). (E) SMN levels in NSC-34 native (CTRL), the pool of cells expressing different levels of SMN (POOL), and two specific clones expressing 20% and 0% of SMN. (F) Representative polysomal profiles from NSC-34 native (CTRL) and the two clones expressing 20% and 0% of SMN. Co-sedimentation profiles of SMN and RPL26 are shown. The signal of SMN is shown for short (SMN_s) and long (SMN_l) exposure times of acquisition. (G) Comparison between the FRP in NSC-34 native and expressing 20% and 0% of SMN (CTRL: n = 3; 20%: n = 3; 0%: n = 3). Significant decreases were identified with one-tailed t test (∗∗p < 0.01). See also Figure S3.
Figure 4
Figure 4
Identification of RNAs with Defective Translation Efficiency Reveals Functional Clusters of RNAs with Altered Translation in SMA (A) Experimental design for POL-seq and RNA-seq profiling on brains from late symptomatic SMA and control mice. (B) Volcano plot displaying translation efficiency variations (x axis) and associated p values (y axis) in early symptomatic (top) and late symptomatic (bottom) SMA brains compared to controls. Genes with statistically significant variations in TE are labelled according to the direction of the change: up (blue) or down (red) regulation in SMA. (C) RNA subtypes of genes with significantly altered TE in early- (top) and late-symptomatic (bottom) SMA mice. (D) Heatmap with top enriched terms (from Gene Ontology) and pathways (from KEGG and Reactome). Enrichment analysis was performed on genes with significant changes of TE in early- and late-symptomatic SMA brains. The number of genes contributing to the enrichment is indicated in each tile. See also Figure S4 and Data S2 and S3.
Figure 5
Figure 5
Translation Alterations in SMA Reveal Links between SMN and Ribosome Biology (A) Heatmap displaying all genes with altered translation efficiency (ΔTE) in SMA brains and annotated under the “Translation” Reactome pathway, significantly enriched in Figure 4D. The majority of genes belong to the family of ribosomal proteins. Genes further analyzed by qPCR are highlighted in black. (B) qPCR-derived variations of translation efficiency for ribosomal proteins and one elongation factor from (A) in early (top) and late (bottom) symptomatic mouse brains. Mean value ± SEM is shown; three to four biological replicates and two to six technical replicates; all genes were normalized to the geometric mean of actin and cyclophilin a; one-tailed t test; p < 0.05, ∗∗p < 0.01, ∗∗∗p < 0.001. (C) Representative electron micrograph of a large diameter (motor) axon in the intercostal nerve from a P5 SMA mouse (black arrowheads: axonal ribosomes; white arrowhead, ER ribosomes). (D) Counts of axonal ribosomes revealed a decrease in the density of ribosomes in SMA mouse axons compared to controls (n = 30 axon profiles; N = 3 mice per genotype; ∗∗∗p < 0.001, two-tailed t test). See also Figure S5.

References

    1. Anand M., Chakraburtty K., Marton M.J., Hinnebusch A.G., Kinzy T.G. Functional interactions between yeast translation eukaryotic elongation factor (eEF) 1A and eEF3. J. Biol. Chem. 2003;278:6985–6991. - PubMed
    1. Bäumer D., Lee S., Nicholson G., Davies J.L., Parkinson N.J., Murray L.M., Gillingwater T.H., Ansorge O., Davies K.E., Talbot K. Alternative splicing events are a late feature of pathology in a mouse model of spinal muscular atrophy. PLoS Genet. 2009;5:e1000773. - PMC - PubMed
    1. Béchade C., Rostaing P., Cisterni C., Kalisch R., La Bella V., Pettmann B., Triller A. Subcellular distribution of survival motor neuron (SMN) protein: possible involvement in nucleocytoplasmic and dendritic transport. Eur. J. Neurosci. 1999;11:293–304. - PubMed
    1. Blokhuis A.M., Koppers M., Groen E.J.N., van den Heuvel D.M.A., Dini Modigliani S., Anink J.J., Fumoto K., van Diggelen F., Snelting A., Sodaar P. Comparative interactomics analysis of different ALS-associated proteins identifies converging molecular pathways. Acta Neuropathol. 2016;132:175–196. - PMC - PubMed
    1. Brina D., Miluzio A., Ricciardi S., Clarke K., Davidsen P.K., Viero G., Tebaldi T., Offenhäuser N., Rozman J., Rathkolb B. eIF6 coordinates insulin sensitivity and lipid metabolism by coupling translation to transcription. Nat. Commun. 2015;6:8261. - PMC - PubMed