. 2017 Oct 24;21(4):966-978.
doi: 10.1016/j.celrep.2017.09.093.

Duct- and Acinar-Derived Pancreatic Ductal Adenocarcinomas Show Distinct Tumor Progression and Marker Expression

Affiliations

Duct- and Acinar-Derived Pancreatic Ductal Adenocarcinomas Show Distinct Tumor Progression and Marker Expression

Rute M M Ferreira et al. Cell Rep. .

Abstract

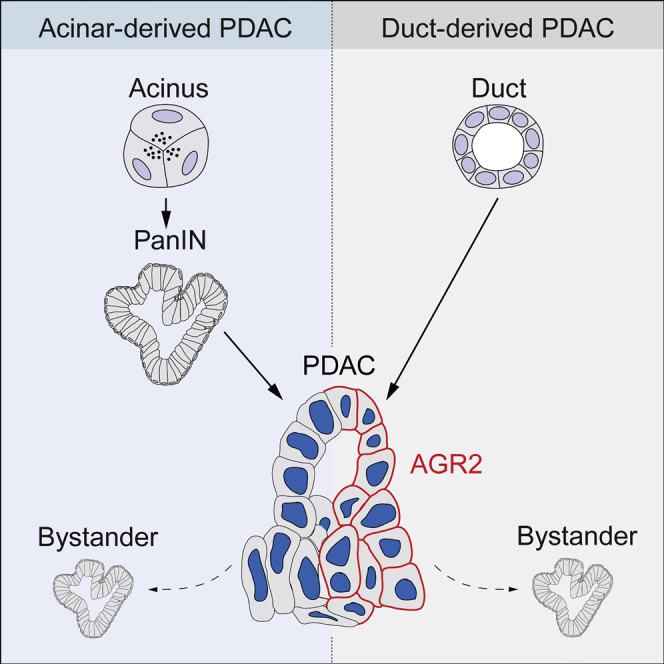
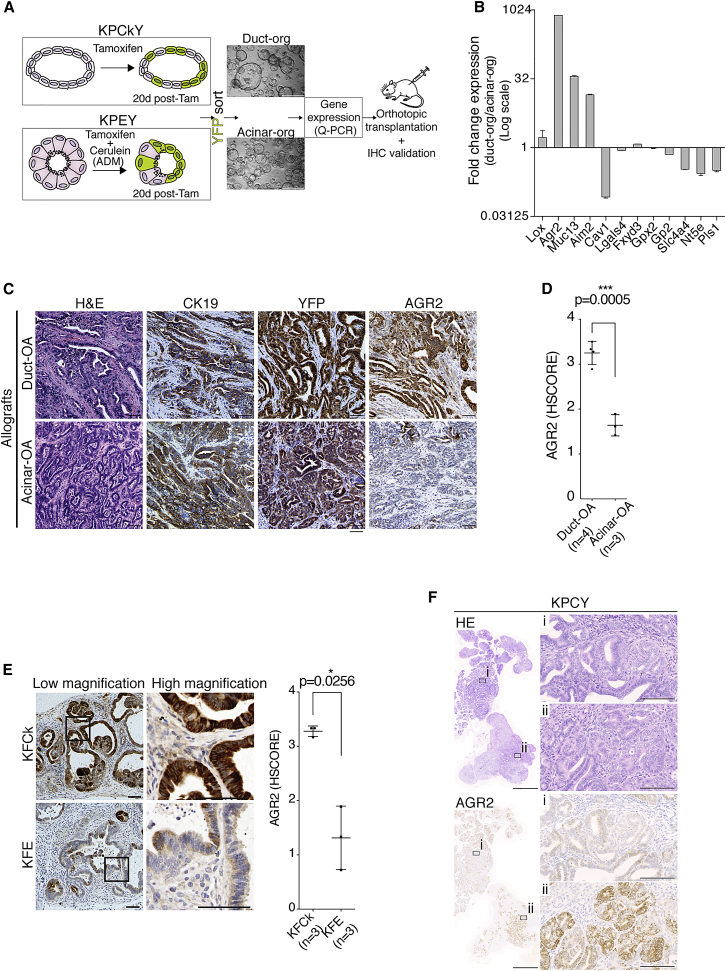
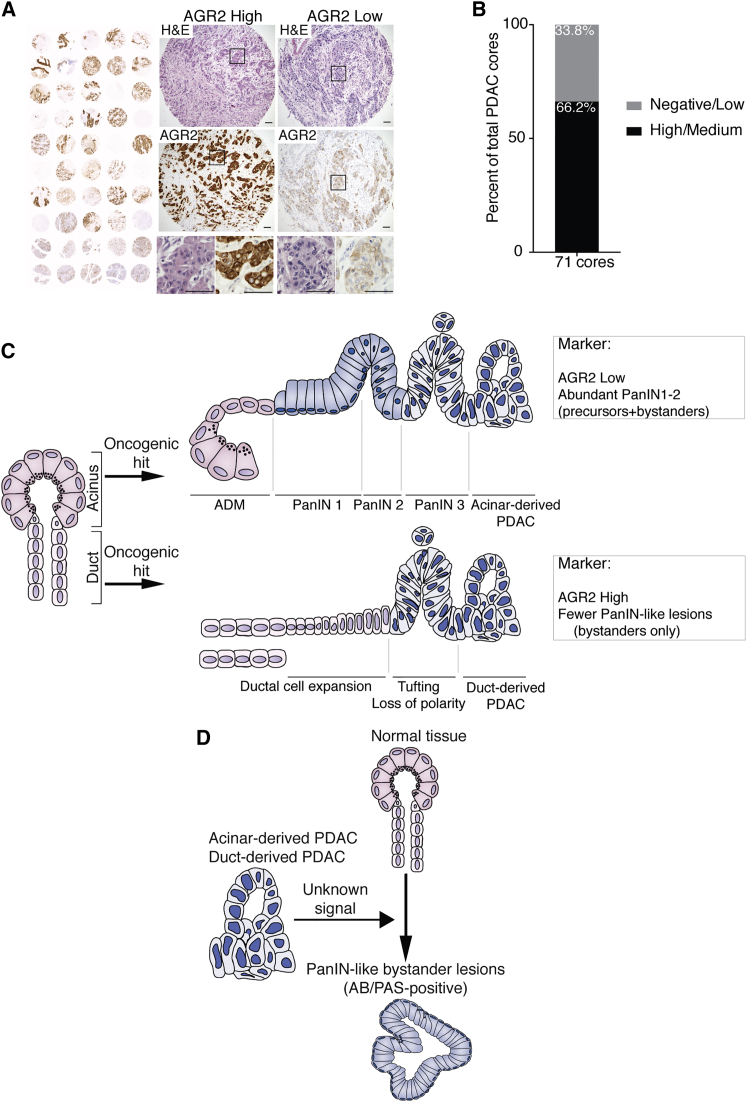
The cell of origin of pancreatic ductal adenocarcinoma (PDAC) has been controversial. Here, we show that identical oncogenic drivers trigger PDAC originating from both ductal and acinar cells with similar histology but with distinct pathophysiology and marker expression dependent on cell of origin. Whereas acinar-derived tumors exhibited low AGR2 expression and were preceded by pancreatic intraepithelial neoplasias (PanINs), duct-derived tumors displayed high AGR2 and developed independently of a PanIN stage via non-mucinous lesions. Using orthotopic transplantation and chimera experiments, we demonstrate that PanIN-like lesions can be induced by PDAC as bystanders in adjacent healthy tissues, explaining the co-existence of mucinous and non-mucinous lesions and highlighting the need to distinguish between true precursor PanINs and PanIN-like bystander lesions. Our results suggest AGR2 as a tool to stratify PDAC according to cell of origin, highlight that not all PanIN-like lesions are precursors of PDAC, and add an alternative progression route to the current model of PDAC development.

Keywords: AGR2; PDAC; PanINs; cell of origin; mouse models; pancreatic cancer; progression.


Figures

None
Graphical abstract
Figure 1
Figure 1
Fbw7 Embryonic Deletion Drastically Accelerates KRasG12D-Induced Murine PDAC and Induces an Initial Ductal Transformation (A) Schematic representation of the KFC (KRasLSL-G12D/wt; Fbw7F/F; Pdx1-Cre) mouse model. Cre expression is driven by the Pdx1 promoter. Black triangles indicate loxP sites. Asterisk indicates G12D point mutation. (B) Immunofluorescence staining of CK19 and pH3 in pancreas of Pdx1-Cre control and KFC mice at postnatal day 0 (P0). White arrowheads indicate pH3+ duct cells; yellow arrowheads indicate pH3+ acinar cells. (C) Quantification of pH3+ cells in acinar or ductal compartments of three P0 Pdx1-Cre and three KFC mice (as a percentage of total cells in that compartment). Mice were obtained from two independent litters. Each data point represents one pancreatic region used for quantification. Graph shows mean values ± SD. The p values were calculated using Welch’s t test (n = 3). (D) Time-course analysis of tumor development in KFC mice. (1–3) H&E low-magnification images. Black boxes indicate area magnified in images 4–6. White box highlights presence of mitotic figures in KFC ductal cells at P0. White arrows show mitotic figures. Black arrow shows loss of polarity (nuclear orientation). Black dotted lines highlight duct cell dysplasia. White dotted lines highlight pseudostratified epithelium. (7–11) CK19 IHC analysis of ductal cells (7–9) and acinar cells (10–11). For each time point, two litters, each comprising at least two KFC animals, were analyzed. Scale bars in panels 1–3 represent 100 μm. Scale bars in panels 4–11 represent 50 μm. See also Figures S1 and S2.
Figure 2
Figure 2
Carcinoma Initiated in Duct Cells Progresses Independently of Low-Grade PanIN Formation (A) Schematic representation of the KFCk (KRasLSL-G12D/wt; Fbw7F/F; Ck19-CreER) mouse and time-course experimental approach. Black triangles indicate loxP sites; asterisk indicates the G12D mutation. (B) Histological analysis of KFCk-derived carcinoma 2 months after tamoxifen treatment. Boxes indicate enlarged regions. (C) IHC analysis of wild-type (WT) 8-week-old pancreas and time-course analysis of carcinoma development in the KFCk model. Regions of interest marked in low-magnification H&E images are analyzed for AB/PAS staining and Ck19 immunological staining below. Black dashed line highlights ductal dysplasia. Black arrowheads indicate loss of cell polarity. At least seven animals per time point were used, and four tissue sections per animal were obtained for H&E and immunostaining. (D) Quantification of the histological progression of duct-derived tumors from the KFCk model. At least three mice per time point and three tissue sections per mouse were used. Ducts exhibiting dysplasia, tufting, or loss of polarity were counted in one category only. Bars indicate mean + SD. The percentage of ducts with stromal expansion (stromal layer thicker than 50 μm) was quantified separately (line graph shows mean ± SD). Data points indicate individual tissue sections. All scale bars represent 100 μm. See also Figure S3.
Figure 3
Figure 3
PanIN and PanIN-like Lesions Are Fundamentally Different and Occur at Different Stages of Tumor Development (A) Schematic representation of KFE (KRasLSL-G12D/wt; Fbw7F/F; Ela1-CreERT2) mice and experimental approach. Black triangles indicate loxP sites; asterisk indicates G12D mutation. (B) Histological analysis of acinar-derived tumors and corresponding CK19 IHC stain 6 months after cerulein treatment. (C) Histological analysis of KFE pancreas 1 month after cerulein treatment and corresponding CK19 and AB/PAS stain. Black box indicates region enlarged on the right. (D) AB/PAS representative images of acinar-derived (KFE) and duct-derived (KFCk) tumors, 6 and 2 months after tamoxifen treatment, respectively, and respective quantifications of AB/PAS-positive PanIN-like lesions per 10 mm2 of pancreatic area. Black arrows show AB/PAS-positive lesions. Black box indicates region enlarged on the right. At least three mice per genotype and three tissue sections per mouse were used. Bar chart shows mean + SD. Data points indicate scores for individual mice (n = 3 KFE mice; n = 11 KFCK mice). The p values were calculated using Welch’s t test. (E) Schematic representation of the KFEY (KRasLSL-G12D/wt; Fbw7F/F; Ela1-CreERT2; Rosa26-LSL-YFP) and KFCkY (KRasLSL-G12D/wt; Fbw7F/F; Ck19-CreER; Rosa26-LSL-YFP) mice and experimental approach. KFEY mice were treated as in Figure 3A and KFCkY mice as in Figure 2A. (F) Co-stain of YFP and AB/PAS on tumor sections from KFEY and KFCkY pancreas, 6 and 2 months after tamoxifen treatment, respectively. Quantification shows YFP-positive and -negative AB/PAS-positive PanIN-like lesions per 10 mm2 of pancreatic area. At least three mice per genotype and two tissue sections per mouse were used. Bar chart shows mean + SD. Data points indicate scores for individual mice (n = 3 KFEY mice; n = 10 KFCk mice). The p values were calculated using Welch’s t test. Scale bars represent 50 μm in (F) and 100 μm for the remaining panels.
Figure 4
Figure 4
PDAC Oncogenesis Promotes Low-Grade PanIN-like Lesion Formation in Adjacent Wild-Type Tissues (A) Schematic representation of the allograft experimental approach. PDAC organoids from 5-week-old KPCY (KRasLSL-G12D/wt; p53F/F; Pdx1-Cre; Rosa26-LSL-YFP) mice were sorted for YFP before transplantation. (B) Histological analysis of orthotopic allograft tumors 20 days post-transplantation on serial sections. Two independent procedures were performed with four mice each. Black dashed line delineates YFP-PDAC. (C) Schematic representation of the chimera experimental approach. KPCY (KRasLSL-G12D/wt; p53F/F; Pdx1-Cre; Rosa26-LSL-YFP) embryonic stem cells were injected into C57BL/6J Gt(ROSA)26Sortm9(CAG-tdTomato)Hze mouse blastocysts to generate chimeras with a low contribution of YFP-expressing KPC cells in tdTomato+ healthy tissues. (D) Histological analysis of 4-month-old chimeric pancreas on serial sections. Black dashed line delineates the invasive front of the tumor. Black boxes in (B) and (D) indicate high-mag regions. All scale bars represent 100 μm.
Figure 5
Figure 5
AGR2 Level and Extent of Expression Indicates Tumor Cell of Origin (A) Experimental approach to identify and validate potential cell of origin markers. Micrographs depict organoids used for gene expression analysis, derived from YFP-sorted cells from KPCkY and KPEY mice 20 days after in vivo recombination using tamoxifen (Tam). (B) Relative expression of selected genes used for PDAC classification in duct- and acinar-derived organoids, analyzed by qRT-PCR. Bar chart shows mean + SD. (C) Histological analysis of orthotopic allograft (OA) tumors generated from duct- (KPCkY) and acinar-derived (KPEY) organoids. (D) AGR2 blinded histological score (HScore) for four duct-OA tumors and three acinar-OA tumors, two sections per tumor. Dot plot shows mean ± SD. (E) AGR2 IHC stain of pancreatic pre-neoplastic lesions of three KFCk and three KFE animals, two sections per tumor, and respective HScore. Black boxes indicate high-mag regions. Dot plot shows mean ± SD. (F) H&E and IHC stain for AGR2 on PDAC from KPCY animals (KRasLSL-G12D/wt; p53F/F; Pdx1-Cre; Rosa26-LSL-YFP). Magnifications of AGR2 negative (i) and positive (ii) regions are shown. Scale bars represent 100 μm except for micrographs in (A) and in (F) (left panels), which are 500 μm and 2 mm, respectively. The p values were calculated using Welch’s t test. See also Figures S4 and S5.
Figure 6
Figure 6
Human PDAC Tumors Show Distinct AGR2 Expression and Model Comparing Duct- and Acinar-Derived Tumors (A) Representative histological (H&E) and IHC analysis of AGR2 in human tumors on PDAC tissue microarray (Pa1002a, US Biomax), showing one AGR2 high core and one AGR2 low core. Black boxes indicate magnified regions shown below. (B) Quantification of AGR2 high/medium and low/negative PDAC tumor cores from two independent TMAs (Pa1001a and P1002a). (C) Schematic summary of duct-derived versus acinar-derived pancreatic tumor progression. Acinar cells respond to oncogenic hits by undergoing acinar-to-ductal metaplasia (ADM) that progresses to PanIN lesions (1–3) and culminates in PDAC. In contrast, duct cells harboring oncogenic mutations do not evolve into PanIN lesions but increase proliferation, leading to a crowding of the duct network and deformation of the ductal structures. Ductal transformation progresses to a stage resembling a non-mucinous carcinoma in situ that culminates in PDAC formation. Mature tumors from different origins are morphologically similar but can be distinguished by their levels and pattern of AGR2 expression and by the frequency of PanIN-like lesions. Duct cell-derived tumors are almost entirely AGR2-positive and present a reduced number of PanIN-like lesions, whereas acinar cell-derived PDAC only present focal AGR2-positive regions and show abundant low-grade PanINs. (D) Schematic representation of the origin of non-precursor PanIN-like lesions. The presence of developed PDAC induces the formation of PanIN-like bystander lesions originating from wild-type tissue. These are the only low-grade PanIN-like lesions found in duct-derived PDAC, but they are also present in PDAC from other cell origins. See also Figure S6.

References

    1. Bailey J.M., Hendley A.M., Lafaro K.J., Pruski M.A., Jones N.C., Alsina J., Younes M., Maitra A., McAllister F., Iacobuzio-Donahue C.A., Leach S.D. p53 mutations cooperate with oncogenic Kras to promote adenocarcinoma from pancreatic ductal cells. Oncogene. 2016;35:4282–4288. - PubMed
    1. Bardeesy N., Aguirre A.J., Chu G.C., Cheng K.H., Lopez L.V., Hezel A.F., Feng B., Brennan C., Weissleder R., Mahmood U. Both p16(Ink4a) and the p19(Arf)-p53 pathway constrain progression of pancreatic adenocarcinoma in the mouse. Proc. Natl. Acad. Sci. USA. 2006;103:5947–5952. - PMC - PubMed
    1. Behringer R.R., Gertsenstein M., Nagy K.V., Nagy A. Cold Spring Harbor Laboratory Press; 2003. Manipulating the Mouse Embryo: A Laboratory Manual.
    1. Brembeck F.H., Schreiber F.S., Deramaudt T.B., Craig L., Rhoades B., Swain G., Grippo P., Stoffers D.A., Silberg D.G., Rustgi A.K. The mutant K-ras oncogene causes pancreatic periductal lymphocytic infiltration and gastric mucous neck cell hyperplasia in transgenic mice. Cancer Res. 2003;63:2005–2009. - PubMed
    1. Brosens L.A., Hackeng W.M., Offerhaus G.J., Hruban R.H., Wood L.D. Pancreatic adenocarcinoma pathology: changing “landscape.”. J. Gastrointest. Oncol. 2015;6:358–374. - PMC - PubMed