. 2017 May 30;8(42):71845-71858.
doi: 10.18632/oncotarget.18286. eCollection 2017 Sep 22.

A peptide antagonist of Prep1-p160 interaction improves ceramide-induced insulin resistance in skeletal muscle cells

Affiliations

A peptide antagonist of Prep1-p160 interaction improves ceramide-induced insulin resistance in skeletal muscle cells

Ilaria Cimmino et al. Oncotarget. .

Abstract

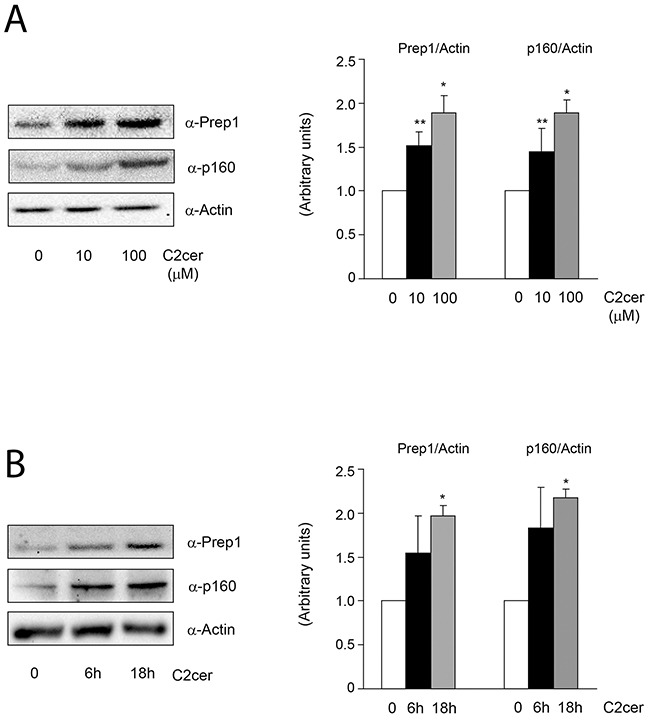
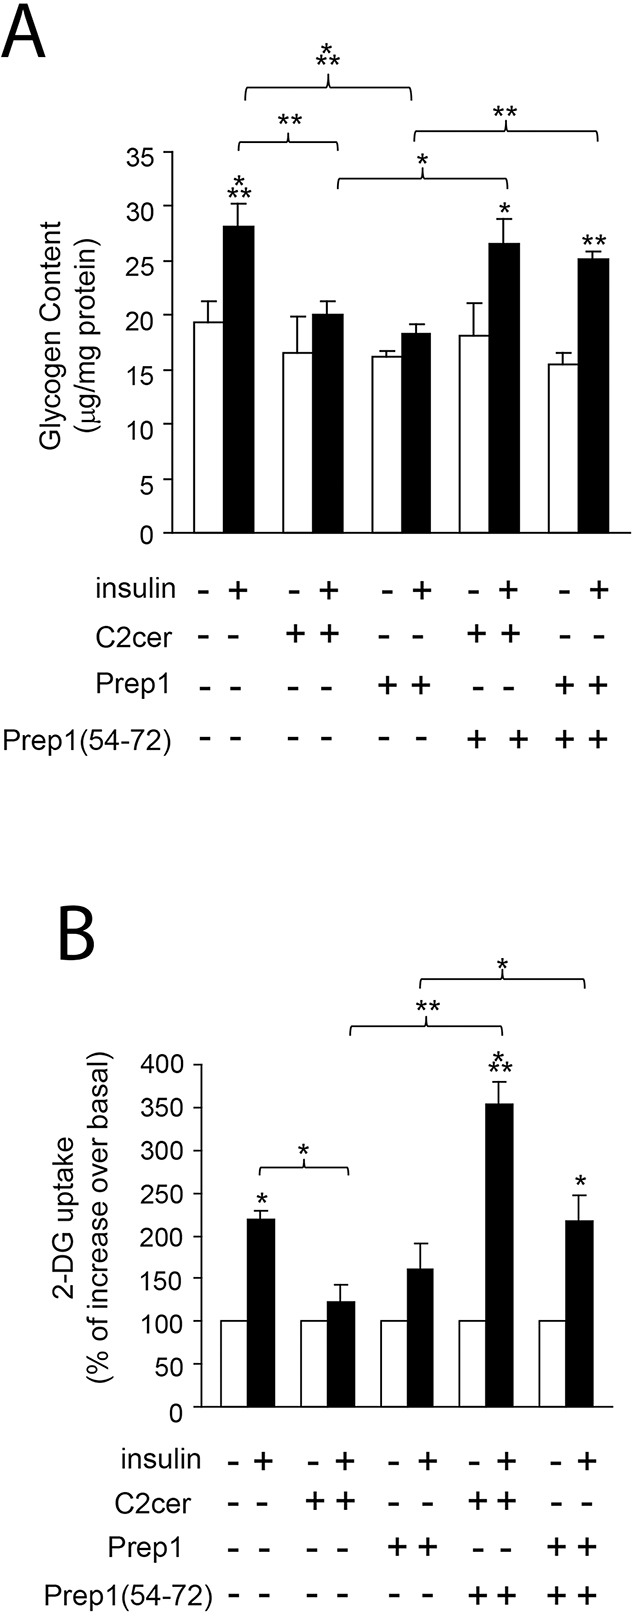
Prep1 is a homeodomain transcription factor belonging to the TALE protein family. Its overexpression affects glucose metabolism in several tissues. In particular, in skeletal muscle tissue the interaction of Prep1 with its cofactor p160 impairs GLUT4 expression and glucose uptake. In this study, we show that ceramides (C2cer), a class of lipids antagonizing insulin signalling, increase the levels of Prep1 and p160 in a dose and time-dependent fashion in L6 cells and induce their association by 80%. We find that C2cer exposure inhibits insulin receptor, IRS1 and Akt phosphorylation and reduces insulin-stimulated glycogen content and glucose uptake by 1.3- and 2.1-fold, respectively. The synthetic Prep1(54-72) peptide, mimicking the Prep1 region involved in the interaction with p160, reduces in vitro Prep1-p160 binding in a dose-dependent way (IC50 = 0.20μM). In C2cer-treated L6 cells, 10μM Prep1(54-72) restores insulin signalling impaired by ceramide treatment. Prep1 overexpressing L6 cells display similar metabolic alterations observed in ceramide-treated L6 cells and the presence of Prep1(54-72) mitigates these events. All these findings suggest that disruption of the Prep1/p160 molecular interaction enhances insulin sensitivity impaired by ceramides in skeletal muscle cells and indicate this complex as an important target for type 2 diabetes.

Keywords: Prep1; Prep1(54-72) peptide; ceramide; insulin signalling; p160.


Conflict of interest statement

CONFLICTS OF INTEREST All authors have no conflicts of interest.

Figures

Figure 1
Figure 1. Effect of ceramides dose-response and time-course on Prep1 and p160 protein levels
L6 skeletal muscle cells were treated with different concentration of C2cer (10μM and 100μM for 18h) (A) and for different time (10μM for 6h and 18h) (B). Protein lysates were analyzed by Western blot using antibodies for Prep1, p160 and for the beta-actin, as a loading control. Blots were detected by ECL and autoradiography. The autoradiographs are representative of four independent experiments. Asterisks denote statistically significant differences (*p<0.05; **p<0.01).
Figure 2
Figure 2. Effect of ceramides on Prep1 and p160 mRNA expression and of Prep1-p160 coprecipitation
L6 cells were treated with C2cer (10μM) for 18h and Prep1 (A) or p160 (B) mRNA levels were analyzed by real-time RT-PCR analysis. Data were normalized by the amount of GAPDH mRNA, used as internal control. Bars represent the mean ± SD of three independent experiments, each performed in triplicate. (C) L6 cells were treated with cycloheximide (CHX) at 40μg/mL concentration for 18h and the lysates were analyzed by Western blot with anti-p160 and beta-actin. The autoradiograph shown is representative of three different experiments and subjected to densitometric analysis. (D) Protein lysates from L6 cells treated with C2cer as indicated, were immunoprecipitated with Prep1 antibody and immunoblotted with p160 or Prep1 antibodies. The autoradiograph shown is representative of three different experiments and subjected to densitometric analysis. Asterisks denote statistically significant differences (*p<0.05; **p<0.01).
Figure 3
Figure 3. Design and in vitro effects of Prep1(54-72) peptide on Prep1/p160 association
(A) Binding curves of Prep1(59-72) and Prep1(54-72) peptides to p16020-160 by ELISA-like assays. Biotinylated peptides at several concentrations were added in triplicate to a 96-well plate coated with p16020-160 (0.1μM). Experiments were performed at least twice and the average results fitted using GraphPad Prism. Fitting of data with a one-site binding model provided a KD value of 0.18μM ± 0.04 and 1.25μM ± 0.08 for Prep1(54-72) and Prep1(59-72) respectively. (B) Competition binding experiments. His6-tagged-p16020-160 at 0.25μM was incubated with Prep1(59-72) and Prep1(54-72) at concentrations ranging between 0.001÷10μM and added to a 96-well plate coated with Prep145-155 (0.10μM). Results are the average of three independent experiments. (C) L6 cells were incubated with increasing concentrations of the fluorescein-conjugated peptide (FITC-Prep1(54-72)) and peptide uptake was detected by FACS analysis of fluorescein-labeled cells. Bars represent the mean ± SD of four independent experiments. (D) L6 muscle cells incubated with Prep1(54-72) were stimulated with C2cer (10μM) for 18h. Protein lysates were immunoprecipitated with Prep1 antibodies and analyzed by Western blot using antibodies for p160 or for Prep1. (E) An aliquot of the lysate was used to measure protein expression of Prep1 and p160 and the beta-actin used as loading control. The blots were detected by ECL and autoradiography. The autoradiograph is representative of three independent experiments. Asterisks denote statistically significant differences (*p<0.05; **p<0.01).
Figure 4
Figure 4. Prep1(54-72) peptide restores the insulin signaling inhibited by C2cer and Prep1
L6 cells were stimulated with insulin (100nM) and incubated with Prep1(54-72) in presence of C2cer at 10μM for 18h (A-B) or stable transfection of Prep1 (C-D). Protein lysates were immunoprecipitated with specific IR or IRS1 antibodies and analyzed by Western blot using antibodies for phosphotyrosines (pY) and beta-actin as loading control. Blots were detected by ECL and autoradiography. The autoradiographs are representative of three independent experiments. Asterisks denote statistically significant differences (*p<0.05; **p<0.01).
Figure 5
Figure 5. Effect of Prep1(54-72) peptide on Akt phosphorylation and PGC-1α and GLUT4 protein levels
(A-B) L6 control and Prep1 overexpressing cells were stimulated with Insulin (100nM) and/or C2cer (10μM) and incubated with Prep1(54-72). Protein lysates were analyzed by Western blot using antibodies for pAkt, Akt and for the beta-actin, as a loading control. (C) PGC-1α and GLUT4 protein levels were measured by using specific antibodies for these proteins and beta-actin antibody was used as loading control. Blots were detected by ECL and autoradiography. The autoradiographs are representative of four independent experiments. Asterisks denote statistically significant differences (*p<0.05; **p<0.01; ***p<0.001).
Figure 6
Figure 6. Effect of Prep1(54-72) peptide on glycogen content and 2-DG uptake
L6 control and Prep1 overexpressing cells were stimulated with Insulin (100nM) and/or C2cer (10μM) and incubated with Prep1(54-72). (A) Glycogen content and (B) 2-DG uptake were measured as described in methods. Bars represent the mean ± SD of three independent experiments. Asterisks denote statistically significant differences (*p<0.05; **p<0.01; ***p<0.001).
Figure 7
Figure 7. Schematic representation of Prep1(54-72) peptide action on insulin signaling impaired by ceramides
(A) Ceramides increase both Prep1 and p160 expression and induce the coprecipitation between the two proteins. Prep1/p160 complex impairs insulin signaling and reduces PGC-1α and GLUT4 expression, leading to a decrease of glycogen synthesis and 2DG-uptake. (B) Incubation of the L6 cells with Prep1(54-72) (in red) mimicking the region of Prep1 which interacts with p160, displaces the protein-protein binding and improves the ceramide-mediated insulin signaling impairment.

References

    1. Lin Y, Sun Z. Current views on type 2 diabetes. J Endocrinol. 2010;204:1–11. - PMC - PubMed
    1. Summers SA. Ceramides in insulin resistance and lipotoxicity. Prog Lipid Res. 2006;45:42–72. - PubMed
    1. Kanety H, Hemi R, Papa MZ, Karasik A. Sphingomyelinase and ceramide suppress insulin-induced tyrosine phosphorylation of the insulin receptor substrate-1. The Journal of biological chemistry. 1996;271:9895–9897. - PubMed
    1. Obanda DN, Hernandez A, Ribnicky D, Yu Y, Zhang XH, Wang ZQ, Cefalu WT. Bioactives of Artemisia dracunculus L. mitigate the role of ceramides in attenuating insulin signaling in rat skeletal muscle cells. Diabetes. 2012;61:597–605. - PMC - PubMed
    1. Hajduch E, Balendran A, Batty IH, Litherland GJ, Blair AS, Downes CP, Hundal HS. Ceramide impairs the insulin-dependent membrane recruitment of protein kinase B leading to a loss in downstream signalling in L6 skeletal muscle cells. Diabetologia. 2001;44:173–183. - PubMed

LinkOut - more resources