Chronic high dose of captopril induces depressive-like behaviors in mice: possible mechanism of regulatory T cell in depression
- PMID: 29069807
- PMCID: PMC5641150
- DOI: 10.18632/oncotarget.19879
Chronic high dose of captopril induces depressive-like behaviors in mice: possible mechanism of regulatory T cell in depression
Abstract
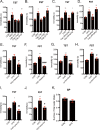
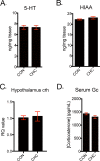
Major depression has various types of symptoms and disease courses with inconsistent response to monoamine-related antidepressants. Thus, monoamine theory may not be the only pathophysiologic pathway relevant to depression. Recently, it has been suggested that regulatory T cell (Treg) is associated with depression. Based on our previous study that showed decreased regulatory T cell (Treg) population following chronic high-dose captopril (CHC, 40 mg/kg/day * 21 days) administration, we examined whether CHC alone can induce depressive-like behaviors in mice even without stressful stimuli. In this study, we found that CHC induced depressive-like behaviors in tail suspension test (TST) and forced swimming test (FST) without systemic illness, while it did not induce anhedonic behavior, anxiety-like behaviors, or sociality-related behavior. The depressive-like behaviors were rescued by either CHC washout or antidepressant. CHC caused reduction in foxp3 and gata3 mRNA expression in the lymph nodes with elevation in plasma IL-1β and IL-6. Interestingly, CHC increased serum angiotensin II level. In the hippocampus, CHC increased TNF-α and IL-6 mRNA expression with microglia activation while reduced glucocorticoid receptor expression. However, CHC did not affect to hippocampal kynurenine pathway, serotonin level, hypothalamic corticotropin-releasing hormone mRNA level, or serum corticosterone level. Consequently, we propose that CHC may induce a specific form of depressive-like behaviors via Treg reduction and microglial activation.
Keywords: angiotensin II; captopril; cytokines; depression; regulatory T cell.
Conflict of interest statement
CONFLICTS OF INTEREST We have no conflicts of interest to declare.
Figures


Similar articles
-
Salvianolic acid B ameliorates depressive-like behaviors in chronic mild stress-treated mice: involvement of the neuroinflammatory pathway.Acta Pharmacol Sin. 2016 Sep;37(9):1141-53. doi: 10.1038/aps.2016.63. Epub 2016 Jul 18. Acta Pharmacol Sin. 2016. PMID: 27424655 Free PMC article.
-
Depressive-like behavior induced by tumor necrosis factor-α in mice.Neuropharmacology. 2012 Jan;62(1):419-26. doi: 10.1016/j.neuropharm.2011.08.018. Epub 2011 Aug 18. Neuropharmacology. 2012. PMID: 21867719
-
Antidepressant-like activity of the adenosine A(2A) receptor antagonist, istradefylline (KW-6002), in the forced swim test and the tail suspension test in rodents.Pharmacol Biochem Behav. 2013 Dec;114-115:23-30. doi: 10.1016/j.pbb.2013.10.022. Epub 2013 Nov 4. Pharmacol Biochem Behav. 2013. PMID: 24201052
-
IL-4/10 prevents stress vulnerability following imipramine discontinuation.J Neuroinflammation. 2015 Oct 31;12:197. doi: 10.1186/s12974-015-0416-3. J Neuroinflammation. 2015. PMID: 26521132 Free PMC article.
-
Possible involvement of microglial P2RY12 and peripheral IL-10 in postpartum depression.Front Cell Neurosci. 2023 Jun 15;17:1162966. doi: 10.3389/fncel.2023.1162966. eCollection 2023. Front Cell Neurosci. 2023. PMID: 37396924 Free PMC article.
Cited by
-
SGK1-FoxO1 Signaling Pathway Mediates Th17/Treg Imbalance and Target Organ Inflammation in Angiotensin II-Induced Hypertension.Front Physiol. 2018 Nov 15;9:1581. doi: 10.3389/fphys.2018.01581. eCollection 2018. Front Physiol. 2018. PMID: 30524295 Free PMC article.
-
Human umbilical cord-derived mesenchymal stem cells alleviate schizophrenia-relevant behaviors in amphetamine-sensitized mice by inhibiting neuroinflammation.Transl Psychiatry. 2020 Apr 27;10(1):123. doi: 10.1038/s41398-020-0802-1. Transl Psychiatry. 2020. PMID: 32341334 Free PMC article.
-
Role of brain renin-angiotensin system in depression: A new perspective.CNS Neurosci Ther. 2024 Apr;30(4):e14525. doi: 10.1111/cns.14525. Epub 2023 Nov 12. CNS Neurosci Ther. 2024. PMID: 37953501 Free PMC article. Review.
-
Anti-Inflammatory Activities of Captopril and Diuretics on Macrophage Activity in Mouse Humoral Immune Response.Int J Mol Sci. 2021 Oct 21;22(21):11374. doi: 10.3390/ijms222111374. Int J Mol Sci. 2021. PMID: 34768805 Free PMC article.
-
Immunomodulatory Effects of RAAS Inhibitors: Beyond Hypertension and Heart Failure.Biomedicines. 2025 Jul 21;13(7):1779. doi: 10.3390/biomedicines13071779. Biomedicines. 2025. PMID: 40722848 Free PMC article. Review.
References
-
- Ferrari AJ, Charlson FJ, Norman RE, Patten SB, Freedman G, Murray CJ, Vos T, Whiteford HA. Burden of depressive disorders by country, sex, age, and year: findings from the global burden of disease study 2010. PLoS Med. 2013;10:e1001547. https://doi.org/10.1371/journal.pmed.1001547 - DOI - PMC - PubMed
-
- Moussavi S, Chatterji S, Verdes E, Tandon A, Patel V, Ustun B. Depression, chronic diseases, and decrements in health: results from the World Health Surveys. Lancet. 2007;370:851–8. https://doi.org/10.1016/S0140-6736(07)61415-9 - DOI - PubMed
-
- Krishnan V, Nestler EJ. The molecular neurobiology of depression. Nature. 2008;455:894–902. https://doi.org/10.1038/nature07455 - DOI - PMC - PubMed
-
- Baghai TC, Moller HJ, Rupprecht R. Recent progress in pharmacological and non-pharmacological treatment options of major depression. Curr Pharm Des. 2006;12:503–15. https://doi.org/10.2174/138161206775474422 - DOI - PubMed
-
- Ruhe HG, Huyser J, Swinkels JA, Schene AH. Switching antidepressants after a first selective serotonin reuptake inhibitor in major depressive disorder: a systematic review. J Clin Psychiatry. 2006;67:1836–55. - PubMed
LinkOut - more resources
Full Text Sources
Other Literature Sources
Miscellaneous

