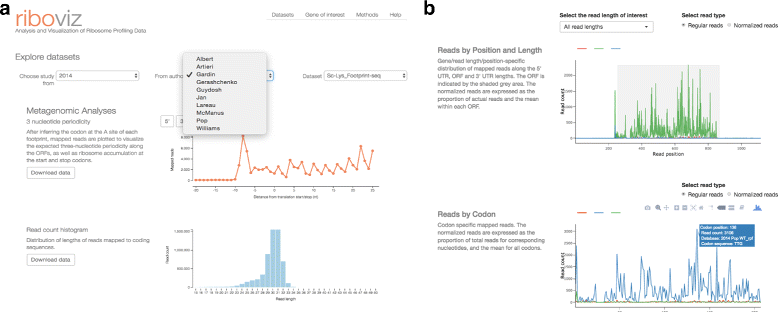
riboviz: analysis and visualization of ribosome profiling datasets
- PMID: 29070028
- PMCID: PMC5657068
- DOI: 10.1186/s12859-017-1873-8
riboviz: analysis and visualization of ribosome profiling datasets
Abstract
Background: Using high-throughput sequencing to monitor translation in vivo, ribosome profiling can provide critical insights into the dynamics and regulation of protein synthesis in a cell. Since its introduction in 2009, this technique has played a key role in driving biological discovery, and yet it requires a rigorous computational toolkit for widespread adoption.
Description: We have developed a database and a browser-based visualization tool, riboviz, that enables exploration and analysis of riboseq datasets. In implementation, riboviz consists of a comprehensive and flexible computational pipeline that allows the user to analyze private, unpublished datasets, along with a web application for comparison with published yeast datasets. Source code and detailed documentation are freely available from https://github.com/shahpr/RiboViz . The web-application is live at www.riboviz.org.
Conclusions: riboviz provides a comprehensive database and analysis and visualization tool to enable comparative analyses of ribosome-profiling datasets. This toolkit will enable both the community of systems biologists who study genome-wide ribosome profiling data and also research groups focused on individual genes to identify patterns of transcriptional and translational regulation across different organisms and conditions.
Keywords: Database; Ribosome profiling; Translation quantification; Visualization and comparison tool-kit.
Conflict of interest statement
Ethics approval and consent to participate
Not applicable.
Consent for publication
Not applicable.
Competing interests
The authors declare that they have no competing interests.
Publisher’s Note
Springer Nature remains neutral with regard to jurisdictional claims in published maps and institutional affiliations.
Figures
References
-
- Csárdi G. Franks A. Choi DS. Airoldi EM. Drummond DA Accounting for experimental noise reveals that mRNA levels, amplified by post-transcriptional processes, largely determine steady-state protein levels in yeast. PLoS Genet. 2015;11(5):e1005206. doi: 10.1371/journal.pgen.1005206. - DOI - PMC - PubMed
MeSH terms
Grants and funding
LinkOut - more resources
Full Text Sources
Other Literature Sources
Molecular Biology Databases


