

Assessment of iron status in settings of inflammation: challenges and potential approaches
- PMID: 29070567
- PMCID: PMC5701714
- DOI: 10.3945/ajcn.117.155937
Assessment of iron status in settings of inflammation: challenges and potential approaches
Abstract
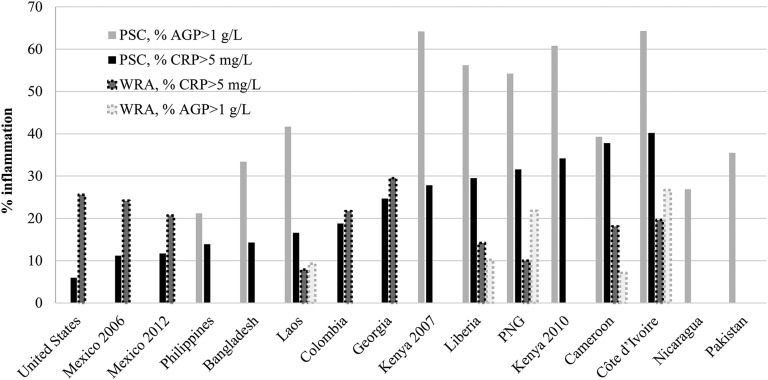
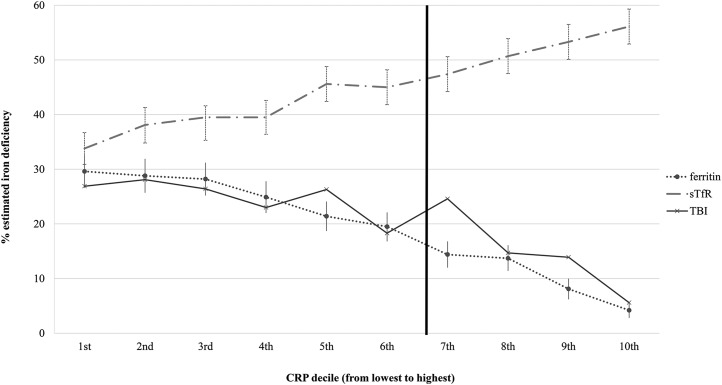
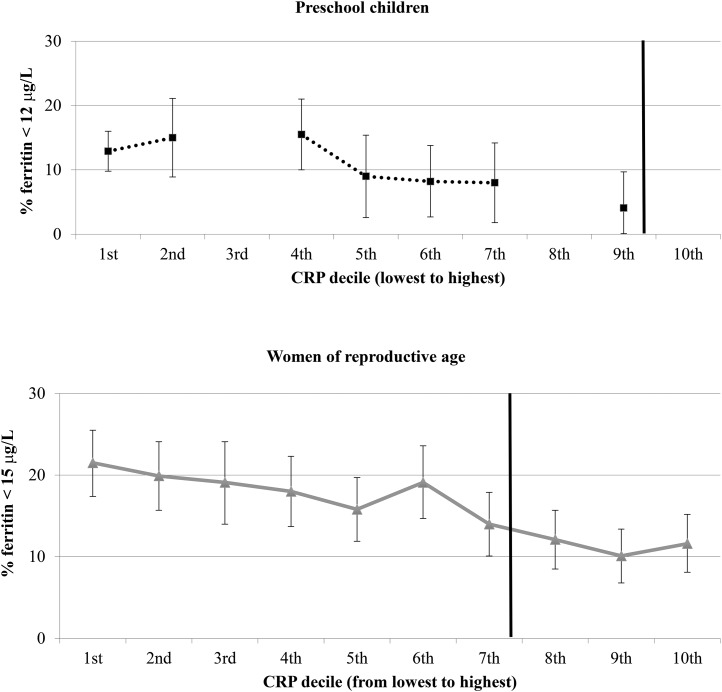
The determination of iron status is challenging when concomitant infection and inflammation are present because of confounding effects of the acute-phase response on the interpretation of most iron indicators. This review summarizes the effects of inflammation on indicators of iron status and assesses the impact of a regression analysis to adjust for inflammation on estimates of iron deficiency (ID) in low- and high-infection-burden settings. We overviewed cross-sectional data from 16 surveys for preschool children (PSC) (n = 29,765) and from 10 surveys for nonpregnant women of reproductive age (WRA) (n = 25,731) from the Biomarkers Reflecting the Inflammation and Nutritional Determinants of Anemia (BRINDA) project. Effects of C-reactive protein (CRP) and α1-acid glycoprotein (AGP) concentrations on estimates of ID according to serum ferritin (SF) (used generically to include plasma ferritin), soluble transferrin receptor (sTfR), and total body iron (TBI) were summarized in relation to infection burden (in the United States compared with other countries) and population group (PSC compared with WRA). Effects of the concentrations of CRP and AGP on SF, sTfR, and TBI were generally linear, especially in PSC. Overall, regression correction changed the estimated prevalence of ID in PSC by a median of +25 percentage points (pps) when SF concentrations were used, by -15 pps when sTfR concentrations were used, and by +14 pps when TBI was used; the estimated prevalence of ID in WRA changed by a median of +8 pps when SF concentrations were used, by -10 pps when sTfR concentrations were used, and by +3 pps when TBI was used. In the United States, inflammation correction was done only for CRP concentrations because AGP concentrations were not measured; regression correction for CRP concentrations increased the estimated prevalence of ID when SF concentrations were used by 3 pps in PSC and by 7 pps in WRA. The correction of iron-status indicators for inflammation with the use of regression correction appears to substantially change estimates of ID prevalence in low- and high-infection-burden countries. More research is needed to determine the validity of inflammation-corrected estimates, their dependence on the etiology of inflammation, and their applicability to individual iron-status assessment in clinical settings.
Keywords: infection; inflammation; iron status; preschool children; serum ferritin; soluble transferrin receptor; total-body iron stores; women of reproductive age.
Figures
References
-
- White KC. Anemia is a poor predictor of iron deficiency among toddlers in the United States: for heme the bell tolls. Pediatrics 2005;115:315–20. - PubMed
-
- World Health Organization. Micronutrients database [Internet]. [cited 2017 Jun 26]. Available from: http://www.who.int/vmnis/database/en/.
-
- Office of Disease Prevention and Health Promotion. Healthy People 2020 [Internet]. [cited 2017 Jun 26]. Available from: https://www.healthypeople.gov/2020/topics-objectives/topic/nutrition-and....
Publication types
MeSH terms
Substances
Grants and funding
LinkOut - more resources
Full Text Sources
Other Literature Sources
Medical
Research Materials
Miscellaneous
