. 2017 Dec 8;292(49):20100-20112.
doi: 10.1074/jbc.M117.815001. Epub 2017 Oct 25.

The E3 ubiquitin ligase SCFFBXL14 complex stimulates neuronal differentiation by targeting the Notch signaling factor HES1 for proteolysis

Affiliations

The E3 ubiquitin ligase SCFFBXL14 complex stimulates neuronal differentiation by targeting the Notch signaling factor HES1 for proteolysis

Fangfang Chen et al. J Biol Chem. .

Abstract

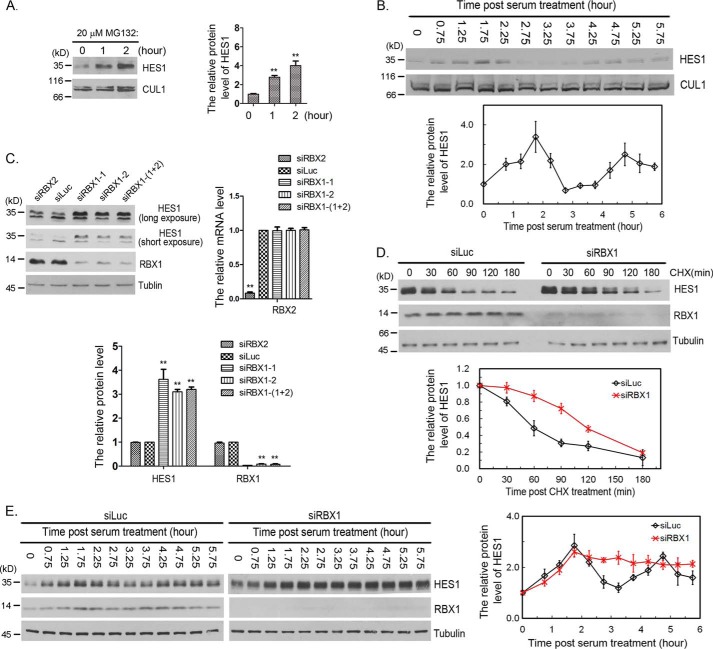
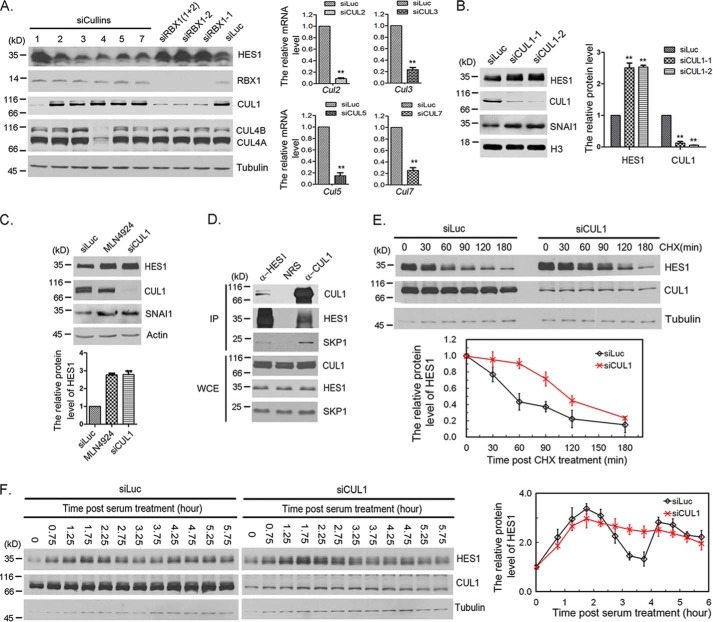
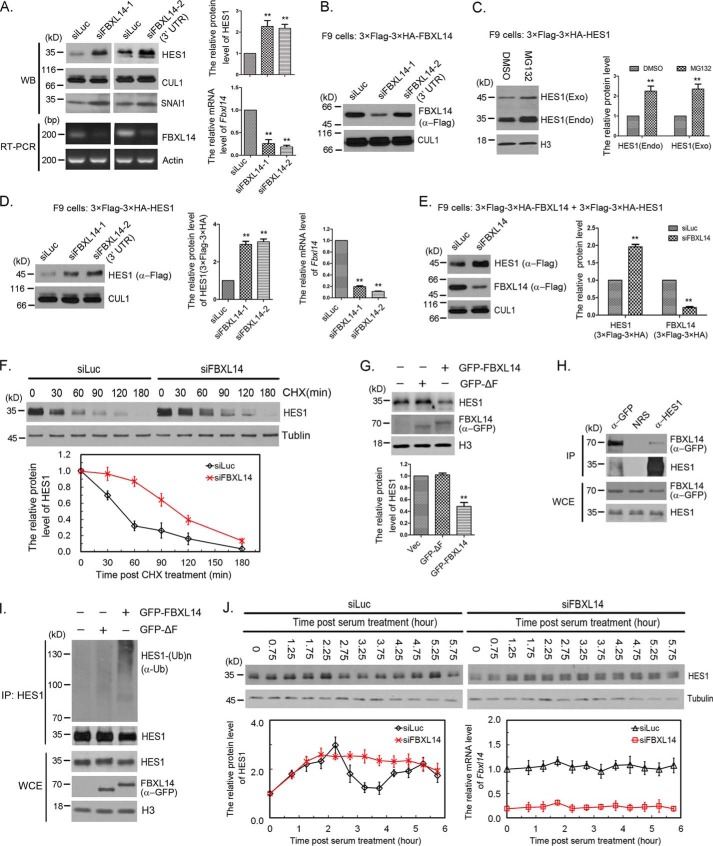
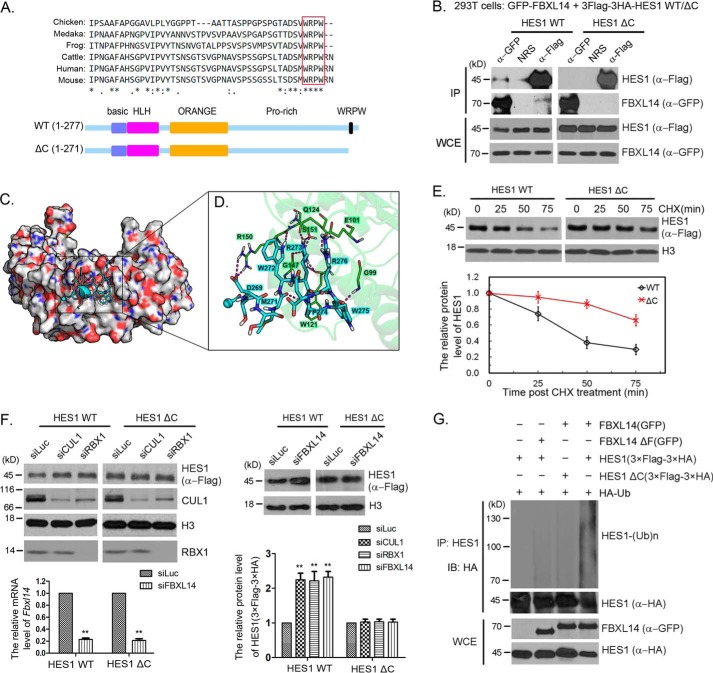
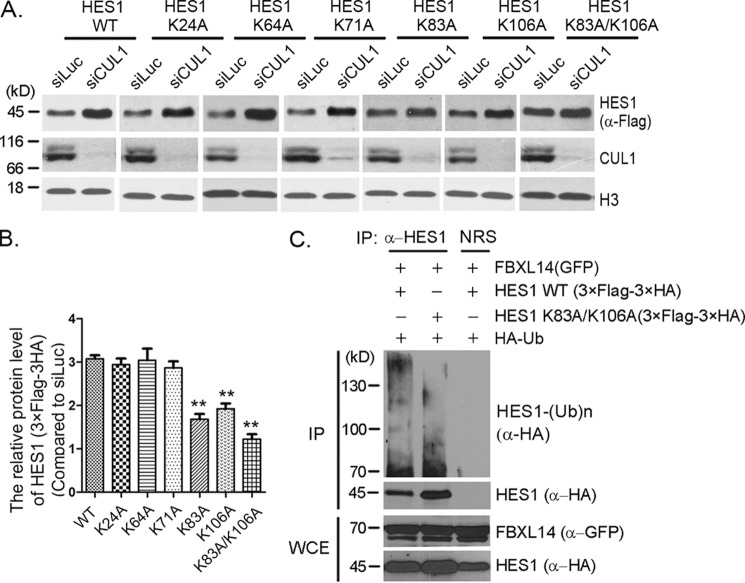
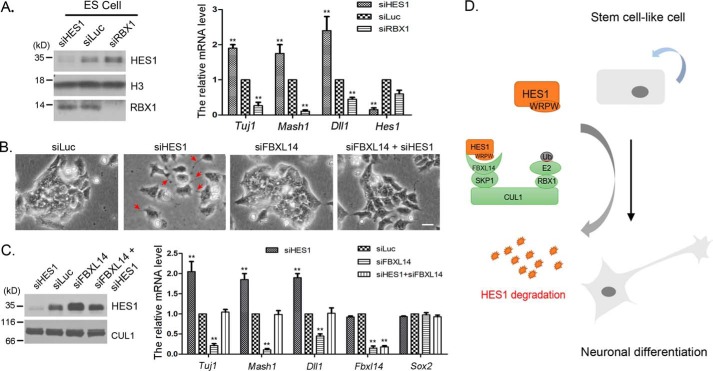
Molecular oscillators are important cellular regulators of, for example, circadian clocks, oscillations of immune regulators, and short-period (ultradian) rhythms during embryonic development. The Notch signaling factor HES1 (hairy and enhancer of split 1) is a well-known repressor of proneural genes, and HES1 ultradian oscillation is essential for keeping cells in an efficiently proliferating progenitor state. HES1 oscillation is driven by both transcriptional self-repression and ubiquitin-dependent proteolysis. However, the E3 ubiquitin ligase targeting HES1 for proteolysis remains unclear. Based on siRNA-mediated gene silencing screening, co-immunoprecipitation, and ubiquitination assays, we discovered that the E3 ubiquitin ligase SCFFBXL14 complex regulates HES1 ubiquitination and proteolysis. siRNA-mediated knockdown of the Cullin-RING E3 ubiquitin ligases RBX1 or CUL1 increased HES1 protein levels, prolonged its half-life, and dampened its oscillation. FBXL14, an F-box protein for SCF ubiquitin ligase, associates with HES1. FBXL14 silencing stabilized HES1, whereas FBXL14 overexpression decreased HES1 protein levels. Of note, the SCFFBXL14 complex promoted the ubiquitination of HES1 in vivo, and a conserved WRPW motif in HES1 was essential for HES1 binding to FBXL14 and for ubiquitin-dependent HES1 degradation. HES1 knockdown promoted neuronal differentiation, but FBXL14 silencing inhibited neuronal differentiation induced by HES1 ablation in mES and F9 cells. Our results suggest that SCFFBXL14 promotes neuronal differentiation by targeting HES1 for ubiquitin-dependent proteolysis and that the C-terminal WRPW motif in HES1 is required for this process.

Keywords: E3 ubiquitin ligase; FBXL14; HES1 oscillation; SCF ubiquitin ligase; neurodifferentiation; proteolysis; small interfering RNA (siRNA); ubiquitylation (ubiquitination).


Conflict of interest statement

The authors declare that they have no conflicts of interest with the contents of this article

Figures

Figure 1.
Figure 1.
RBX1 regulated HES1 stability and oscillation. A, MG132 stabilized HES1 in F9 cells. F9 cells were treated with 20 μm MG132 for the indicated times, and the cell lysates were analyzed by immunoblotting with antibody for HES1. CUL1 was taken as loading control. Right panel, the relative protein levels of HES1 in blots were quantified by Gel-Pro analyzer 4, which was normalized to CUL1. The means and error bars were generated from three independent experiments. Error bars indicated S.D. The statistical differences between control group (0 h) and experimental groups (1 and 2 h) were measured by paired two-sided Student's t test (**, p < 0.01). B, serum-induced HES1 oscillation. F9 cells were serum-starved for 24 h, and HES1 protein levels were examined at the indicated times once serum was supplemented. Bottom panel, the relative protein level of HES1 was measured as in A. The means and error bars (S.D.) were from three independent experiments. C, silencing of RBX1 resulted in stabilization of HES1. F9 cells were transfected with 50 nm luciferase, RBX2, or RBX1 siRNAs for 48 h, and cells were harvested for immunoblotting using specific antibodies. Bottom panel, the relative protein levels of HES1 and RBX1 were quantified and normalized to tubulin. The mRNA level of RBX2 was examined using quantitative real-time PCR (right panel). The means and error bars (S.D.) were generated from three independent experiments. The significance of statistical difference between control group (Luc) and experimental groups (RBX1 and RBX2) were calculated as in A. D, knocking down of RBX1 postponed the degradation of HES1. F9 were transfected with siRNA targeting to Luc or RBX1 for 45 h. Then cells were treated with CHX (100 μg/ml) for the indicated times, and the protein levels of HES1, RBX1, and tubulin were determined by Western blotting. Bottom panel, the relative protein level of HES1 was quantified and normalized to tubulin. The experiment was biologically repeated at least five times. E, silencing of RBX1 dampened HES1 oscillation. F9 cells were transfected with luciferase or RBX1 siRNAs for 24 h and then cultured for another 18.5 h with serum retraction to starve cells. The protein level of HES1 was examined at the indicated times once serum was supplemented to the medium. Right panel, the quantification of relative protein level of HES1. The experiment was biologically repeated at least five times.
Figure 2.
Figure 2.
CUL1 regulated HES1 stability and oscillation. A, Cullin family screening by siRNA. F9 cells were transfected with 50 nm Luc, RBX1, or Cullins siRNAs as indicated for 48 h, and the cells were harvested for Western blotting. Right panel, the mRNA level of CUL2, CUL3, CUL5, and CUL7 was examined using quantitative real-time PCR. The error bars represent S.D. from three independent experiments. The statistical difference was measured by paired two-sided Student's t test (**, p < 0.01). B, CUL1 regulated HES1 stability. F9 cells were transfected with 50 nm Luc or CUL1 (CUL1-1 and CUL1-2) siRNAs for 48 h, and the cells were harvested for Western blotting. The quantification of protein levels of HES1 and CUL1 were measured as in Fig. 1A. The error bars represent S.D. from three independent experiments. C, SCF is the major E3 ligase involved in HES1 degradation among CRL E3 ligases. F9 cells were transfected with 50 nm Luc and CUL1 siRNAs for 48 h or treated with 0.5 μm MLN4924 for 12 h, and cells were harvested for Western blotting. The quantification of protein levels of HES1 was measured as in Fig. 1A. The error bars represent S.D. from three independent experiments. The statistical difference was measured as in Fig. 1A. D, SCF complex interacted with HES1. F9 cells were treated with 20 μm MG132 for 3 h, the cells were harvested and analyzed by co-immunoprecipitation (IP) and Western blotting using antibodies against HES1, CUL1, and SKP1. Rabbit IgG (normal rabbit serum, NRS) was taken as negative control. Immunoblots of whole-cell extracts (WCE) are shown at the bottom. E, silencing of CUL1 resulted in stabilization of HES1. F9 cells were transfected with luciferase or CUL1 siRNAs for 45 h, and the cells were treated with CHX (100 μg/ml) for the indicated times. The protein levels of HES1, CUL1, and tubulin were determined by Western blotting. Bottom panel, the relative protein level of HES1 was quantified and normalized to tubulin. F, silencing of CUL1 disrupted HES1 oscillation. F9 cells were transfected with luciferase or CUL1 siRNAs for 24 h followed by serum-withdrawal starvation for 18.5 h. The cells were harvested at the indicated times once serum was supplemented. The protein level of HES1 was examined at the indicated times once serum was supplemented to the medium. Right panel, the quantification of relative protein level of HES1. The experiment was biologically repeated at least five times.
Figure 3.
Figure 3.
FBXL14 was the F-box for SCF complex-mediated HES1 ubiquitination and degradation. A, FBXL14 regulated HES1 stability. The protein levels of HES1 and CUL1 were determined by Western blotting using indicated antibodies (left panel) and quantified (right panel). The quantification of protein levels of HES1 were measured as in Fig. 1A. FBXL14 mRNA inhibition was assessed by semi-quantitative RT-PCR. Right panel, the mRNA level of FBXL14 was examined using quantitative real-time PCR. The error bars represent S.D. from five independent experiments. The statistical difference between control group (Luc) and experimental groups (FBXL14) was measured by paired two-sided Student's t test (**, p < 0.01). B, the efficacy of FBXL14 siRNAs. Stably expressing 3× FLAG–3× HA–FBXL14 F9 cells were transfected with 50 nm FBXL14-1 or FBXL14-2 siRNAs as indicated for 45 h, and the cells were harvested for Western blotting. The protein levels of exogenous FBXL14 and CUL1 were determined by Western blotting as indicated. C, the protein level and stability of exogenous and endogenous HES1 in stably expressing 3× FLAG–3× HA–HES1 F9 cells. The protein levels of exogenous and endogenous HES1 were determined by Western blotting using anti-HES1 antibody (left panel) and quantified as in Fig. 1A, which was normalized to histone H3 (right panel). The statistical difference between control group (DMSO) and experimental groups (MG132) was measured as in A. D, FBXL14 regulated the stability of exogenous HES1. Stably expressing 3× FLAG–3× HA–HES1 F9 cells were transfected with luciferase or FBXL14 (FBXL14-1 and FBXL14-2) siRNAs for 45 h. The protein levels of exogenous HES1 (3× FLAG–3× HA) and CUL1 were determined by Western blotting using indicated antibodies (left panel) and quantified (middle panel). Right panel, the mRNA level of FBXL14 was examined and quantified as in A. The error bars represent S.D. from three independent experiments. The statistical difference between control group (Luc) and experimental groups (FBXL14) was measured as in A. E, deletion of FBXL14 stabilized exogenous HES1. Stably co-expressing 3× FLAG–3× HA–HES1 and 3× FLAG–3× HA–FBXL14 F9 cells were transfected with FBXL14 (FBXL14-1) or luciferase siRNAs for 45 h, and cell lysates were immunoblotted using anti-FLAG antibody. Right panel, the protein levels of exogenous HES1 (3× FLAG–3× HA) and FBXL14 (3× FLAG–3× HA) were quantified. The error bars represent S.D. from three independent experiments. The statistical difference between control group (Luc) and experimental groups (FBXL14) was measured as in A. F, silencing of FBXL14 resulted in stabilization of HES1. F9 cells were transfected with luciferase or FBXL14 siRNAs for 45 h, and the cells were treated with CHX (100 μg/ml) for the indicated times. The protein levels of HES1 and tubulin were determined by Western blotting. Bottom panel, the relative protein level of HES1 was quantified and normalized to tubulin. G, FBXL14 promoted HES1 degradation. F9 cells were transfected with pEGFP-C2 (Vec), pEGFPC2–FBXL14 ΔF, or pEGFPC2–FBXL14 for 48 h, and endogenous HES1 and exogenous FBXL14 were detected by Western blotting. Bottom panel, the protein levels of HES1 was quantified. The error bars represent S.D. from three independent experiments. The statistical difference between control group (Vec) and experimental groups (GFP-ΔF and GFP–FBXL14) was measured as in A. H, FBXL14 interacted with HES1. F9 cells were transfected with pEGFPC2–FBXL14 for 48 h, and the cells were treated with 20 μm MG132 for 3 h, harvested, and analyzed by co-immunoprecipitation (IP) and Western blotting. The experiment was biologically repeated at least three times. I, SCF complex promoted HES1 polyubiquitination in vivo. GFP–FBXL14, GFP–FBXL14 ΔF, and pEGFP-C2 were expressed in F9 cells for 44 h, and MG132 was added 3 h before cell harvesting to stabilize ubiquitylated protein. Lysates were immunoprecipitated with HES1 antibody under denaturing conditions (radioimmune precipitation assay buffer), and immunocomplexes were analyzed with the indicated antibodies. Immunoblots of whole-cell extracts were shown at the bottom. J, silencing of FBXL14 disrupted HES1 oscillation. F9 cells were transfected with luciferase or FBXL14 siRNAs for 24 h followed by serum-withdrawal starvation for 18.5 h. The cells were harvested at the indicated times once serum was supplemented. The protein level of HES1 was examined at the indicated times once serum was supplemented to the medium. Bottom panel, the quantification of relative protein level of HES1 and the relative mRNA level of Fbxl14. The experiment was biologically repeated at least five times.
Figure 4.
Figure 4.
The WRPW motif was required for HES1 ubiquitination and degradation. A, highly conserved WRPW motif and schematic diagram for HES1 ΔC mutant. Six amino acids were deleted on the C-terminal of HES1. B, deletion of WRPW motif reduced the interaction between HES1 and FBXL14. 293T cells were co-transfected with pEGFPC2–FBXL14 and pMSCV–3× FLAG–3× HA–HES1 or pMSCV–3× FLAG–3× HA–HES1 ΔC. Co-immunoprecipitation (IP) was performed using anti-GFP and anti-FLAG antibodies. The experiment was biologically repeated at least three times. C, predicted binding mode of FBXL14 and the WRPW motif. Peptide-binding interface of the FBXL14 leucine-rich domain, from the MD simulation. The CH3 group of blocked acetyl at N terminus is shown as a sphere. Carboxyl oxygen and amino nitrogen atoms are colored red and blue, respectively. D, detailed view of the key interactions between the WRPW motif and FBXL14 leucine-rich domain. E, the WRPW motif was critical for HES1 degradation. Stably expressing 3× FLAG–3× HA–HES1 WT or 3× FLAG–3× HA–HES1 ΔC F9 cells were treated with CHX for the indicated times, and then the cells were harvested for Western blotting to detect the protein level changes of HES1. The error bars represent S.D. from three independent experiments. F, SCFFBXL14 complex did not degrade HES1 ΔC mutant. Stably expressing 3× FLAG–3× HA–HES1 or 3× FLAG–3× HA–HES1 ΔC mutant F9 cells were transfected with luciferase, RBX1, CUL1, or FBXL14 siRNAs. Cell lysates were immunoblotted (IB) for the indicated proteins. The protein levels in the blots were quantified and plotted at the bottom. The error bars represent S.D. from three independent experiments. The significance of statistical difference was calculated by paired two-sided Student's t test (**, p < 0.01). G, WRPW motif was essential for SCFFBXL14 catalyzing HES1 ubiquitination. 293T cells were co-transfected with pMSCV–3× FLAG–3× HA–HES1 or pMSCV–3× FLAG–3× HA–HES1 ΔC, pEGFPC2–FBXL14, or pEGFPC2–FBXL14 ΔF and pRK5-HA-Ub as indicated for 44 h followed by incubated with MG132 for 4 h, and the cells were harvested for immunoprecipitation using anti-HES1 antibody under denaturing condition and immunoblotted with anti-HA antibody. Whole-cell extracts (WCE) were immunoblotted with anti-GFP and anti-HA antibodies to indicate expression of exogenous FBXL14 and HES1. The experiment was biologically repeated at least three times.
Figure 5.
Figure 5.
Lysines 83 and 106 were potential ubiquitination sites for SCFFBXL14-mediated HES1 ubiquitination. A, lysine mutants screening. Stably expressing 3× FLAG–3× HA–HES1 WT or mutants (as indicated) F9 cells were transfected with luciferase or CUL1 siRNAs for 45 h, and cell lysates were immunoblotted using indicated antibodies. Histone H3 was taken as loading control. B, quantification of the relative protein levels of HES1 and mutants in A. The quantification of protein levels was measured as in Fig. 1A. The statistical difference between the control group (WT) and experimental groups (K24A, K64A, K71A, K83A, K106A, and K83A/K106A) was measured. The error bars represent S.D. from three independent experiments. The significance of statistical difference was calculated by paired two-sided Student's t test (**, p < 0.01). C, HES1 was ubiquitinated by FBXL14 through lysines 83 and 106. 293T cells were co-transfected with pMSCV–3× FLAG–3× HA–HES1 or pMSCV–3× FLAG–3× HA-0HES1 (K83A/K106A), pEGFPC2–FBXL14, and pRK5-HA-Ub as indicated for 44 h followed by incubation with MG132 for 4 h, and the cells were harvested for immunoprecipitation (IP) using anti-HES1 antibody under denaturing condition and immunoblotted with anti-HA antibody. Whole-cell extracts (WCE) were immunoblotted with anti-GFP and anti-HA antibodies to indicate expression of exogenous FBXL14 and HES1. The experiment was biologically repeated at least three times.
Figure 6.
Figure 6.
The degradation of HES1 mediated by SCFFBXL14 regulated mES cell differentiation. A, HES1 regulated the differentiation of ES cells. Mouse ES cells were transfected with luciferase, RBX1, and HES1 siRNAs for 36 h, and mRNA was isolated. The expression of Tuj1, Mash1, Hes1, and Dll1 were quantified by RT-qPCR). The error bars represent S.D. from three independent experiments. B, co-silencing of FBXL14 reversed the branch-like phenotype induced by HES1 knockdown. F9 cells were transfected with siRNAs as indicated for 48 h, and the representative micrograph is shown. Scale bar, 25 μm. Red arrowheads indicate branch-like structure induced by HES1 knockdown. C, silencing of FBXL14 down-regulated the expression of neuronal marker genes. F9 cells were transfected with siRNAs as indicated for 36 h, and mRNA was extracted. The mRNA levels of Tuj1, Mash1, Dll1, Fbxl14, and Sox2 were quantitated by RT-qPCR. The error bars represent S.D. from three independent experiments. D, schematic diagram for SCFFBXL14 regulating HES1 degradation and cell differentiation. The WRPW motif of HES1 could interacted with FBXL14, which mediated HES1 degradation and promoted stem cell-like cells neural differentiation.

References

    1. Dunlap J. C. (1999) Molecular bases for circadian clocks. Cell 96, 271–290 - PubMed
    1. Schibler U., and Sassone-Corsi P. (2002) A web of circadian pacemakers. Cell 111, 919–922 - PubMed
    1. Tyson J. J., Chen K., and Novak B. (2001) Network dynamics and cell physiology. Nat. Rev. Mol. Cell Biol. 2, 908–916 - PubMed
    1. Paszek P., Ryan S., Ashall L., Sillitoe K., Harper C. V., Spiller D. G., Rand D. A., and White M. R. (2010) Population robustness arising from cellular heterogeneity. Proc. Natl. Acad. Sci. U.S.A. 107, 11644–11649 - PMC - PubMed
    1. Pourquié O. (2003) The segmentation clock: converting embryonic time into spatial pattern. Science 301, 328–330 - PubMed

Publication types