. 2017 Oct 25;9(413):eaaj2347.
doi: 10.1126/scitranslmed.aaj2347.

Transplantation of wild-type mouse hematopoietic stem and progenitor cells ameliorates deficits in a mouse model of Friedreich's ataxia

Affiliations

Transplantation of wild-type mouse hematopoietic stem and progenitor cells ameliorates deficits in a mouse model of Friedreich's ataxia

Celine J Rocca et al. Sci Transl Med. .

Abstract

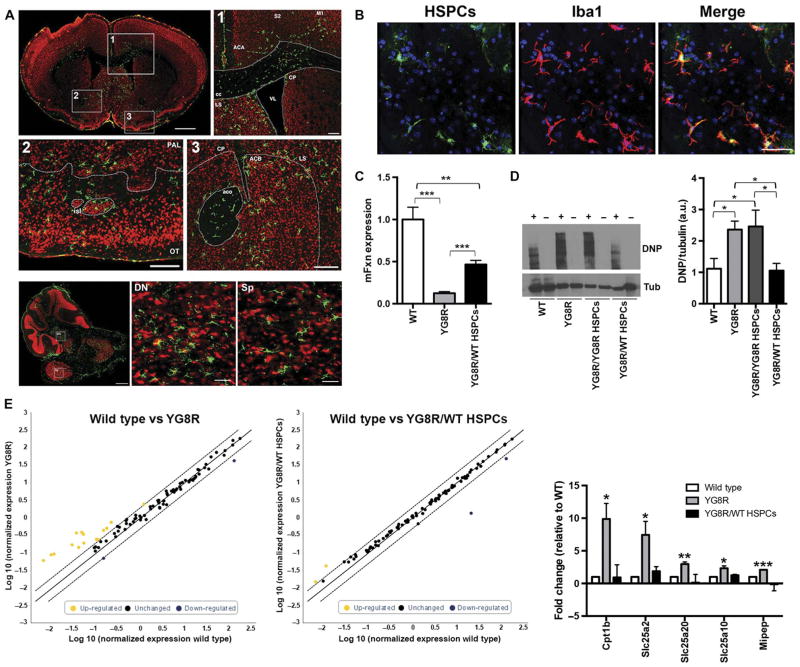
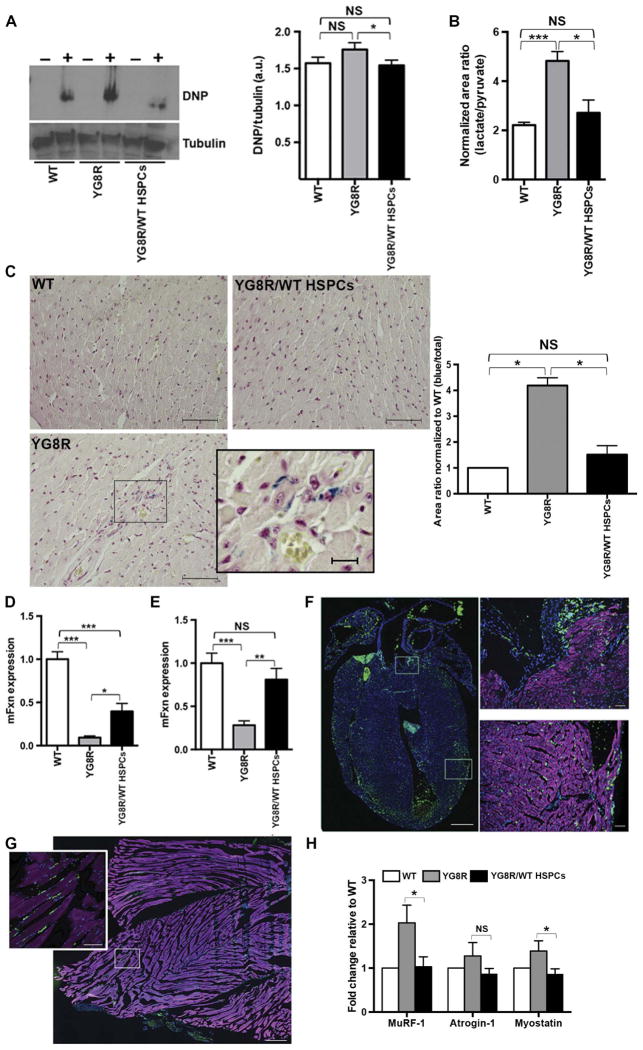
Friedreich's ataxia (FRDA) is an incurable autosomal recessive neurodegenerative disease caused by reduced expression of the mitochondrial protein frataxin due to an intronic GAA-repeat expansion in the FXN gene. We report the therapeutic efficacy of transplanting wild-type mouse hematopoietic stem and progenitor cells (HSPCs) into the YG8R mouse model of FRDA. In the HSPC-transplanted YG8R mice, development of muscle weakness and locomotor deficits was abrogated as was degeneration of large sensory neurons in the dorsal root ganglia (DRGs) and mitochondrial capacity was improved in brain, skeletal muscle, and heart. Transplanted HSPCs engrafted and then differentiated into microglia in the brain and spinal cord and into macrophages in the DRGs, heart, and muscle of YG8R FRDA mice. We observed the transfer of wild-type frataxin and Cox8 mitochondrial proteins from HSPC-derived microglia/macrophages to FRDA mouse neurons and muscle myocytes in vivo. Our results show the HSPC-mediated phenotypic rescue of FRDA in YG8R mice and suggest that this approach should be investigated further as a strategy for treating FRDA.


Conflict of interest statement

Competing interests: S.C. is inventor on a patent entitled “Methods of treating mitochondrial disorders” (#20378-201301) and is a shareholder of GenStem Therapeutics Inc. All other authors declare that they have no competing interests.

Figures

Fig. 1
Fig. 1. Neurobehavioral testing in YG8R mice transplanted with wild-type mouse HSPCs
(A) Neurobehavioral testing (open field, rotarod, gait, and grip strength) was performed for wild-type (WT) mice (n = 16), nontransplanted YG8R control mice (YG8R; n = 4), YG8R mice transplanted with YG8R mfxn−/− hFXN+ HSPCs (YG8R/ YG8R HSPCs; n = 5), and YG8R mice transplanted with wild-type HSPCs (YG8R/WT HSPCs; n = 13) at both 5 and 9 months of age. Locomotor activity was tested using an open-field test, coordination was tested using a rotarod test, gait was tested using an automated gait analysis system, and muscle strength was tested using a forelimb grip strength test. Data are means ± SEM. *P < 0.05, **P < 0.005 and ***P < 0.0005. For statistical comparison of three experimental groups, a mixed analysis of variance (ANOVA) with age of testing as a within-subjects variable was used, followed by independent sample t test. (B) Nissl-stained sections of the lumbar DRGs (L5) from representative 9-month-old wild-type mice (n = 15), YG8R control mice (n = 4), YG8R/YG8R HSPCs (n = 4), and YG8R/WT HSPCs (n = 11). Large vacuoles are shown by red arrows. Scale bars, 100 μm. Graph depicts total vacuolar area per DRG area (right). Data are means ± SEM. **P < 0.005 and ***P < 0.0005 (Mann-Whitney non-parametric test corrected for multiple testing by the Bonferroni correction). (C) Representative confocal images from a WT GFP+ HSPC-transplanted YG8R mouse 7 months after transplantation, stained with anti-GFP (green) and anti-NeuN (red) antibodies. Left: Image of a DRG. Scale bar, 100 μm (top). Magnified image with scale bar, 20 μm (below). Right: Images of cervical, thoracic, and lumbar spinal cord. Scale bars, 250 μm. (D) Confocal images of the DRG and spinal cord from a YG8R mouse transplanted with GFP+ HSPCs show engrafted cells (GFP; green) with neurons (NeuN; blue) and the Iba1 microglial marker (red). Scale bars, 30 μm.
Fig. 2
Fig. 2. Transplanted wild-type mouse HSPCs engraft throughout the YG8R mouse brain
(A) Representative transverse section of the brain of a YG8R mouse 7 months after transplantation with wild-type mouse GFP+ HSPCs, labeled with anti-GFP (green) and anti-NeuN (red) antibodies. Scale bar, 1 mm. Magnified image #1 of the brain shows the periventricular regions including the corpus callosum (cc), lateral septal nuclei (LS), caudate putamen (CP), anterior cingulate area (ACA), and the somatosensory cortex (M1 and S2). VL, lateral ventricle. Scale bar, 150 μm. Magnified image #2 of the mouse brain shows the ventral striatum including the anterior commissure (aco), nucleus accumbens (ACB), lateral septal nuclei, and caudate putamen. Scale bar, 150 μm. Magnified image #3 shows the ventral pallidum (PAL) and the ventral striatum, including the islands of Calleja (isl) and the olfactory tubercle (OT). Scale bar, 150 μm. Lower panels depict the gray and white matter of the brain stem and cerebellum. Scale bar, 500 μm. Insets magnify the dentate nucleus (DN) of the cerebellum and the spinal trigeminal nucleus (Sp) of the brain stem. Scale bar, 50 μm. (B) Confocal images of YG8R mouse brain labeled with anti-GFP (green), anti-Iba1 (red), and anti-NeuN (blue) antibodies. Scale bar, 30 μm. (C) Quantification of murine frataxin mRNA expression in the cerebellum from wild-type mice (n = 14), YG8R mice (n = 8), and YG8R mice transplanted with wild-type mouse HSPCs (n = 13). Data are represented as fold change relative to wild type normalized to glyceraldehyde-3-phosphate dehydrogenase (GAPDH). Data are means ± SEM. **P < 0.005 and ***P < 0.0005 (one-way ANOVA, followed by post hoc Student’s t test). (D) Representative Western blot showing protein oxidation in the cerebrum from one wild-type mouse, one YG8R nontransplanted mouse, one YG8R mouse transplanted with YG8R HSPCs (YG8R/YG8R HSPCs), and one YG8R mouse transplanted with wild-type HSPCs (YG8R/WT HSPCs), with (+) or without (−) a 2,4-dinitrophenylhydrazine (DNP) derivatization reagent. Cerebrum tissue from 9-month-old YG8R control mice (n = 4) and YG8R/YG8R HSPC mice (n = 4) was compared to that from wild-type mice (n = 6) and YG8R/WT HSPCs (n = 6). Data are means ± SEM. *P < 0.05 (one-tailed t test). Tub, tubulin; a.u., arbitrary units. (E) Scatterplots of mitochondrial gene expression changes in the cerebrum (n = 3) from wild-type animals compared to YG8R nontransplanted control mice (left) or YG8R/WT HSPCs mice (middle). The center line represents no change in gene expression, and up-regulated and down-regulated genes at a fold change of 2 or greater are noted by yellow and blue dots, respectively. mRNA changes that are significantly different between groups are represented on a separate bar graph (right). Data are means ± SEM. *P < 0.05, **P < 0.005, ***P < 0.0005, compared to wild-type mice (one-way ANOVA, followed by post hoc Student’s t test).
Fig. 3
Fig. 3. Transplanted wild-type mouse HSPCs are engrafted in the heart and muscle of YG8R recipient mice
(A) Representative Western blot showing protein oxidation in the skeletal muscle of one wild-type mouse, one YG8R control mouse (YG8R), and one YG8R mouse transplanted with wild-type mouse HSPCs (YGR8/WT HSPCs), with (+) or without (−) a 2,4-dinitrophenylhydrazine derivatization reagent. Nine-month-old YG8R control mice [which included nontransplanted YG8R mice (n = 4) and YG8R mice transplanted with YG8R HSPCs (n = 5)] were compared to wild-type mice (n = 16) and YG8R mice transplanted with wild-type mouse HSPCs (YG8R/WT HSPCs; n = 13). Error bars indicate SEM. *P < 0.05. NS, statistically nonsignificant (one-tailed t test). (B) Quantification of lactate and pyruvate by mass spectrometry (represented as a ratio) in muscle tissues from wild-type mice (n = 6), YG8R nontransplanted control mice (n = 3), and YG8R mice transplanted with wild-type mouse HSPCs (n = 5). Error bars indicate SEM. *P < 0.05 and ***P < 0.0005 (one-way ANOVA, followed by post hoc Student’s t test). (C) Representative Perl’s staining of heart sections from an 18-month-old wild-type mouse, YG8R nontransplanted mouse, and YG8R mouse transplanted with wild-type HSPCs; blue staining indicates iron deposition. Scale bars, 50 and 15 μm (inset). The associated bar graph shows iron quantification in heart sections from wild-type mice (n = 4), YG8R control mice [nontransplanted (n = 2) and YG8R mice transplanted with YG8R HSPCs (n = 2)], and YG8R mice transplanted with wild-type mouse HSPCs (n = 3). Error bars indicate SEM. *P < 0.05 (one-way ANOVA, followed by post hoc Student’s t test). (D and E) Quantification of murine frataxin mRNA expression in the heart (D) and skeletal muscle (E) from wild-type mice (n = 12), YG8R nontransplanted control mice (YG8R; n = 7), and YG8R mice transplanted with wild-type mouse HSPCs (YG8R/WT HSPCs; n = 11). Data are represented as fold change relative to wild-type normalized to GAPDH; error bars indicate SEM. *P < 0.05, **P < 0.005, ***P < 0.0005 (one-way ANOVA, followed by post hoc Student’s t test). (F) Heart section from a YG8R mouse 7 months after transplantation with wild-type mouse HSPCs, stained with anti-GFP (green) antibody, the cardiomyocyte marker anti–α-actinin (magenta) antibody, and 4′,6-diamidino-2-phenylindole (DAPI) nuclear stain (blue). Scale bar, 150 μm. Magnified images on the right show the left ventricle (bottom) and the base of the aorta (top). Scale bars, 50 μm. (G) Skeletal muscle section from a YG8R mouse 7 months after transplantation with wild-type mouse HSPCs, stained with anti-GFP (green) antibody, filamentous actin dye phalloidin (magenta) antibody, and DAPI nuclear stain (blue). Scale bar, 150 μm. Magnified image of the skeletal muscle (inset). Scale bar, 50 μm. (H) Quantification of murine MuRF-1, atrogin-1, and myostatin mRNA expression in the skeletal muscle from wild-type mice (n = 5), YG8R nontransplanted control mice (n = 5), and YG8R mice transplanted with wild-type mouse HSPCs (n = 5). Data are represented as fold change relative to wild-type normalized to GAPDH; error bars indicate SEM. *P < 0.05 (one-way ANOVA, followed by post hoc Student’s t test).
Fig. 4
Fig. 4. Wild-type mouse HSPC-derived cells deliver frataxin and Cox8 to FRDA cells in vitro and in vivo
(A and B) Representative frames from confocal imaging movies of YG8R mouse fibroblasts (F) cocultured with (A) primary macrophages (M) isolated from a DsRed Cox8-GFP transgenic mouse (video S2) or (B) IC-21 macrophages transduced with LV-hFXN-GFP and stained with a MitoTracker Red (video S3). Scale bars, 10 μm. (C) Representative confocal images of brain sections from a YG8R mouse transplanted with DsRed+ HSPCs (control; see video S4) and those of brain and spinal cord sections from a YG8R mouse transplanted with DsRed+/Cox8-GFP+ HSPCs at 7 months after transplantation, labeled with an anti-NeuN antibody (blue) (see fig. S4 for the DRG, heart, and muscle). White arrows depict Cox8-GFP in recipient mouse neurons in the brain and spinal cord (see videos S5 and S6 for 3D visualization). Scale bars, 10 μm. (D) Representative confocal images of a spinal cord section from a YG8R mouse transplanted with DsRed+/Cox8-GFP+ HSPCs at 7 months after transplantation, labeled with an anti-NeuN antibody (blue). White arrows depict Cox8-GFP within branch extensions of the DsRed+ microglial cell. Scale bar, 5 μm. (E) Quantification of neurons containing Cox8-GFP in the cervical spinal cord gray matter of YG8R mice transplanted with DsRed+/Cox8-GFP+ HSPCs at 7 months after transplantation (see fig. S4 for the description of the automatic unbiased quantification method). (F) Representative confocal images of brain and spinal cord sections from a YG8R mouse transplanted with DsRed+ HSPCs transduced with LV-hFXN-GFP at 7 months after transplantation and stained with anti-mCherry (red) and anti-NeuN (blue) antibodies. Scale bars, 10 μm.

References

    1. Campuzano V, Montermini L, Moltò MD, Pianese L, Cossée M, Cavalcanti F, Monros E, Rodius F, Duclos F, Monticelli A, Zara F, Cañizares J, Koutnikova H, Bidichandani SI, Gellera C, Brice A, Trouillas P, De Michele G, Filla A, De Frutos R, Palau F, Patel PI, Di Donato S, Mandel JL, Cocozza S, Koenig M, Pandolfo M. Friedreich’s ataxia: Autosomal recessive disease caused by an intronic GAA triplet repeat expansion. Science. 1996;271:1423–1427. - PubMed
    1. Koutnikova H, Campuzano V, Foury F, Dollé P, Cazzalini O, Koenig M. Studies of human, mouse and yeast homologues indicate a mitochondrial function for frataxin. Nat Genet. 1997;16:345–351. - PubMed
    1. Adinolfi S, Iannuzzi C, Prischi F, Pastore C, Iametti S, Martin SR, Bonomi F, Pastore A. Bacterial frataxin CyaY is the gatekeeper of iron-sulfur cluster formation catalyzed by IscS. Nat Struct Mol Biol. 2009;16:390–396. - PubMed
    1. Cook JD, Bencze KZ, Jankovic AD, Crater AK, Busch CN, Bradley PB, Stemmler AJ, Spaller MR, Stemmler TL. Monomeric yeast frataxin is an iron-binding protein. Biochemistry. 2006;45:7767–7777. - PMC - PubMed
    1. Gakh O, Park S, Liu G, Macomber L, Imlay JA, Ferreira GC, Isaya G. Mitochondrial iron detoxification is a primary function of frataxin that limits oxidative damage and preserves cell longevity. Hum Mol Genet. 2006;15:467–479. - PubMed

MeSH terms

Substances