. 2017 Oct 25;9(413):eaan5325.
doi: 10.1126/scitranslmed.aan5325.

Evolution-informed forecasting of seasonal influenza A (H3N2)

Affiliations

Evolution-informed forecasting of seasonal influenza A (H3N2)

Xiangjun Du et al. Sci Transl Med. .

Abstract

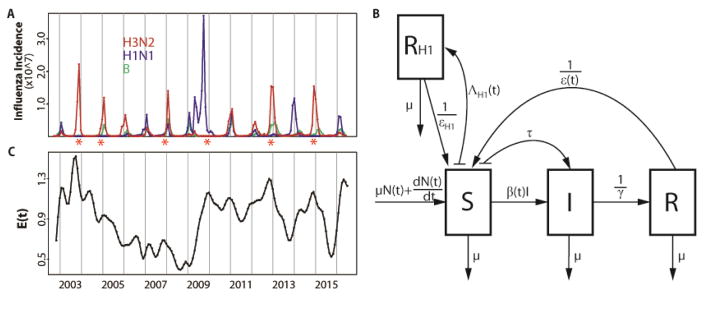
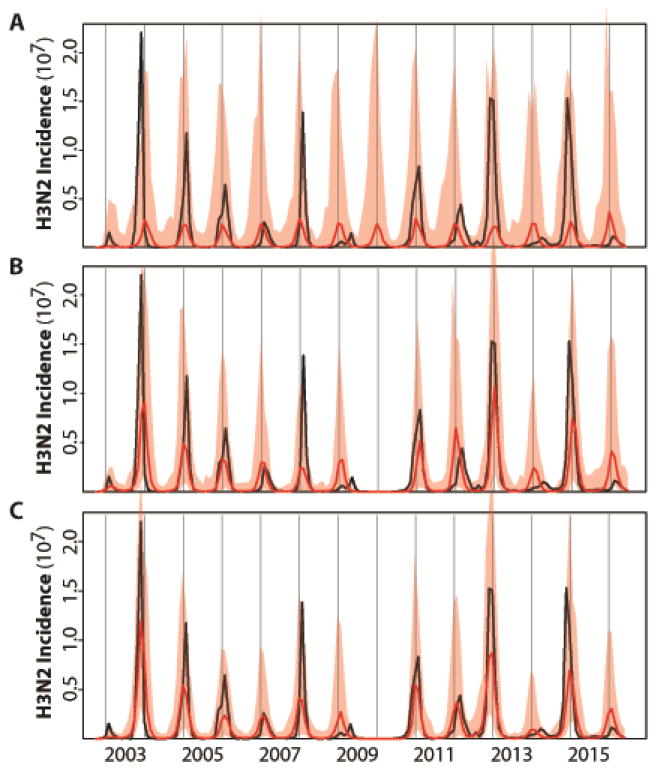
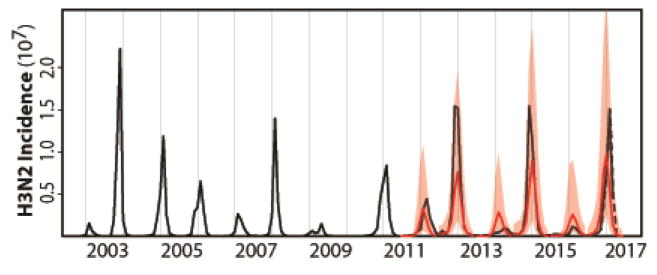
Interpandemic or seasonal influenza A, currently subtypes H3N2 and H1N1, exacts an enormous annual burden both in terms of human health and economic impact. Incidence prediction ahead of season remains a challenge largely because of the virus' antigenic evolution. We propose a forecasting approach that incorporates evolutionary change into a mechanistic epidemiological model. The proposed models are simple enough that their parameters can be estimated from retrospective surveillance data. These models link amino acid sequences of hemagglutinin epitopes with a transmission model for seasonal H3N2 influenza, also informed by H1N1 levels. With a monthly time series of H3N2 incidence in the United States for more than 10 years, we demonstrate the feasibility of skillful prediction for total cases ahead of season, with a tendency to underpredict monthly peak epidemic size, and an accurate real-time forecast for the 2016/2017 influenza season.


Figures

Figure 1
Figure 1
Data and model. (A) Monthly influenza incidence data for the US between October 2002 and June 2016. Red, blue and green curves are for subtype H3N2, subtype H1N1 and type B respectively. Seasons with an antigenic cluster transition were marked with asterisks. (B) Diagram for the epidemiological model. A classical susceptible-infected-recovered-susceptible (SIRS) epidemic model was used to represent the population dynamics of H3N2 incidence. The SIRS model is a compartmental formulation that follows the number of individuals into three classes, for susceptible (S), infected (I) and recovered (R) individuals respectively. People die at a constant rate μ. N(t) is the population size and the birth of individuals was specified as μN(t)+dN(t)dt to capture the observed increase of the population. Susceptible individuals in S move to the I class after contact with an infective and transmission of the disease at rate β(t). This transmission rate includes a seasonal component, a dependency on the antigenic change of the virus, and environmental noise. Infected individuals eventually recover with an average infectious period of γ and move to the R class where they are protected by acquired immunity. Specific immunity is temporary and will be lost after an average latent period ε(t), with individuals in R returning to the S class. Parameter τ is the rate of external importation of H3N2 cases. An additional RH1 class was designed to track the protected population due to infection by H1N1. The rate of transition to the RH1 class is given by ΛH1(t), which depends on the observed incidence of H1N1 scaled to take into account the estimated reporting error. Individuals in the RH1 return back to the R class after an average latent period of εH1. (C) Monthly evolutionary change E(t). The transmission rate β(t) in our first model incorporating evolutionary change depends on this evolutionary index. E(t)was calculated based on epitope sites of HA, as a weighted sum of normalized amino acid distances (hamming distances) between strains in month t and previous strains. Those distances were weighted by a decaying function back in time whose time scale was estimated as part of the model fitting. Details are described in the Evolutionary Index section of the Materials and Methods.
Figure 2
Figure 2
Illustration of the best model fits for the (A) basic, (B) continuous and (C) cluster models. See Table 1 for the specification and statistical comparison of the different models considered. Here, monthly simulations of the respective models with the MLE (Maximum Likelihood Estimates) parameters are shown for the median (in red) and 2.5–97.5% quantiles (shaded red) of 1000 simulations starting from estimated initial conditions in October 2002. For comparison, the observed monthly H3N2 incidence data for the US are shown in black. The basic model which incorporates only a fixed seasonality and no information on H1N1 in (A) fails to capture the temporal variability in the size of seasonal outbreaks; whereas the two models that include a dependence on the levels of H1N1 and on the evolutionary change of the virus (in a continuous fashion in B, and a discrete one in C) do represent this interannual variation.
Figure 3
Figure 3
H3N2 incidence forecasts based on the cluster model for the US. Both retrospective forecasts (for each influenza season from 2011/2012 to 2015/2016) and a real forecast for the coming 2016/2017 influenza season are represented. These forecasts are simulated on a seasonal basis from estimated initial conditions starting in June and based on parameters estimated with all the data up to that point in time. The average monthly H1N1 incidence from this training dataset was used for forecasting purposes as the observation of this driver quantity would not be available. Similarly, the quantities specifying the evolutionary change of the virus was extrapolated as the sequences required for their computation would not be available. The black curve is the monthly observed H3N2 incidence; the red curve is the predicted monthly median incidence with shaded 2.5–97.5% quantiles from 1000 random simulations with the best models. The cluster model captures the occurrence of low and high seasons and forecasts high H3N2 incidence risk level for the 2016/2017 influenza season. The observed incidence data for the 2016/2017 influenza season, which were not yet available when this study was conducted, are shown with the dotted line (and based on data from the weekly US influenza surveillance report until week 14 ending on April 8, 2017).

References

    1. World Health Organization. Influenza (seasonal), Fact Sheet No. 211. 2014 http://www.who.int/mediacentre/factsheets/fs211/en/
    1. Thompson WW, Shay DK, Weintraub E, Brammer L, Cox N, Anderson LJ, Fukuda K. Mortality associated with influenza and respiratory syncytial virus in the United States. JAMA. 2003;289:179–186. - PubMed
    1. Nelson MI, Holmes EC. The evolution of epidemic influenza. Nat Rev Genet. 2007;8:196–205. - PubMed
    1. Smith DJ, Lapedes AS, de Jong JC, Bestebroer TM, Rimmelzwaan GF, Osterhaus AD, Fouchier RA. Mapping the antigenic and genetic evolution of influenza virus. Science. 2004;305:371–376. - PubMed
    1. Bedford T, Riley S, Barr IG, Broor S, Chadha M, Cox NJ, Daniels RS, Gunasekaran CP, Hurt AC, Kelso A, Klimov A, Lewis NS, Li X, McCauley JW, Odagiri T, Potdar V, Rambaut A, Shu Y, Skepner E, Smith DJ, Suchard MA, Tashiro M, Wang D, Xu X, Lemey P, Russell CA. Global circulation patterns of seasonal influenza viruses vary with antigenic drift. Nature. 2015;523:217–220. - PMC - PubMed