. 2017 Oct 25;7(1):14013.
doi: 10.1038/s41598-017-14459-w.

Split GFP technologies to structurally characterize and quantify functional biomolecular interactions of FTD-related proteins

Affiliations

Split GFP technologies to structurally characterize and quantify functional biomolecular interactions of FTD-related proteins

Chiara Foglieni et al. Sci Rep. .

Abstract

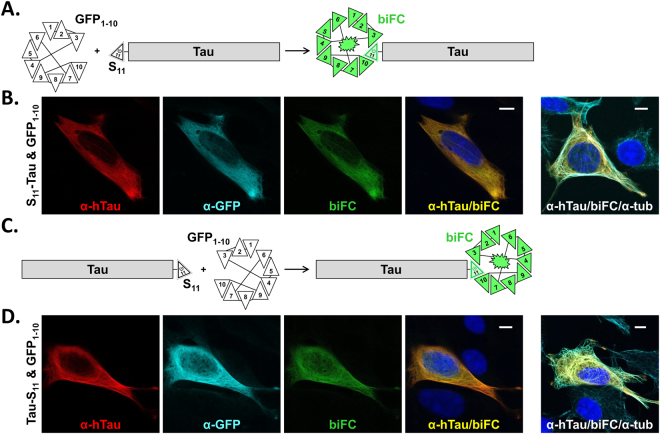
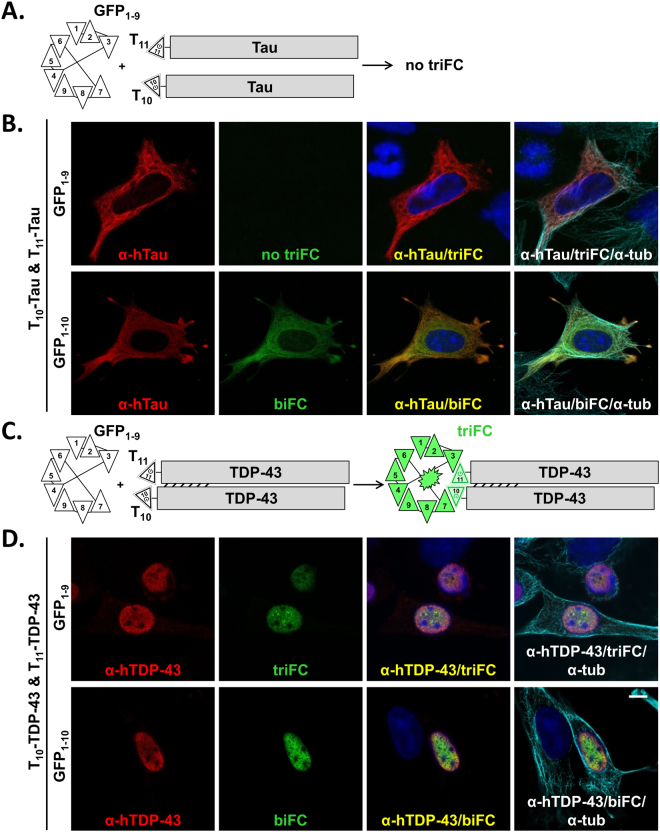
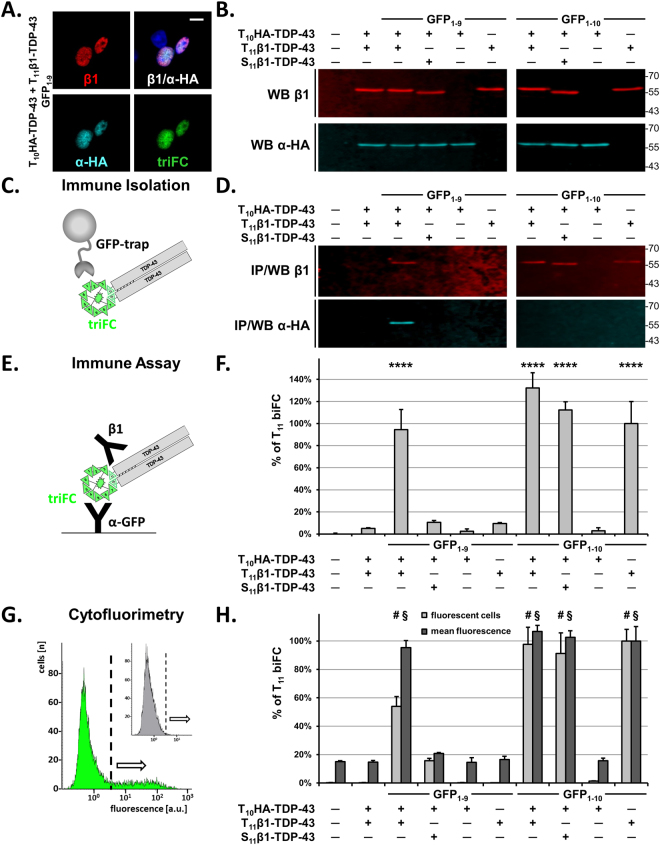
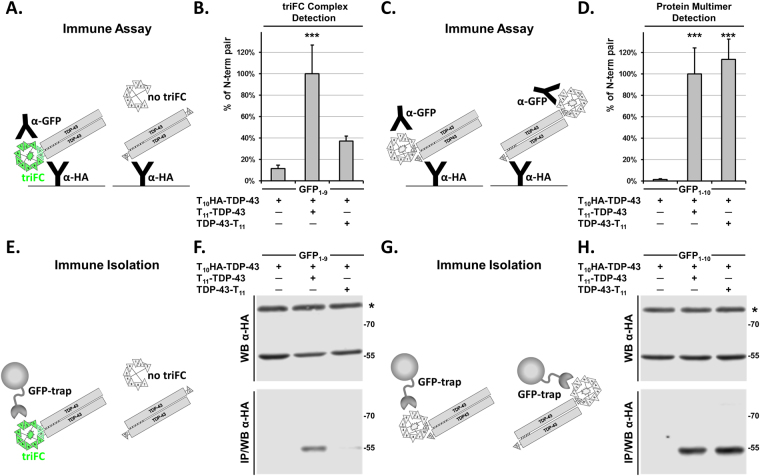
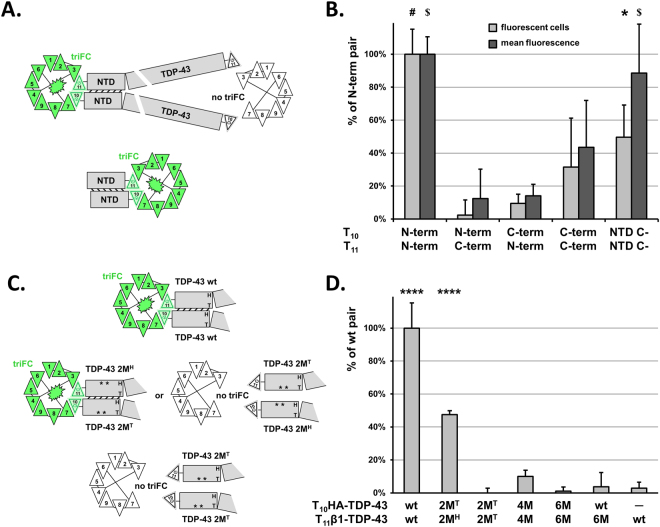
Protein multimerization in physiological and pathological conditions constitutes an intrinsic trait of proteins related to neurodegeneration. Recent evidence shows that TDP-43, a RNA-binding protein associated with frontotemporal dementia and amyotrophic lateral sclerosis, exists in a physiological and functional nuclear oligomeric form, whose destabilization may represent a prerequisite for misfolding, toxicity and subsequent pathological deposition. Here we show the parallel implementation of two split GFP technologies, the GFP bimolecular and trimolecular fluorescence complementation (biFC and triFC) in the context of TDP-43 self-assembly. These techniques coupled to a variety of assays based on orthogonal readouts allowed us to define the structural determinants of TDP-43 oligomerization in a qualitative and quantitative manner. We highlight the versatility of the GFP biFC and triFC technologies for studying the localization and mechanisms of protein multimerization in the context of neurodegeneration.


Conflict of interest statement

The authors declare that they have no competing interests.

Figures

Figure 1
Figure 1
Cellular localization of Tau revealed by GFP biFC. (A) Schematic rendition of GFP bimolecular fluorescence complementation (biFC) resulting from co-localization of an N-terminal S11-tagged protein (in this case human Tau) with GFP1–10. (B) Confocal microscope images of methanol-fixed mouse C17.2 cells transiently transfected with S11-Tau and GFP1–10. The two proteins were immune stained with a monoclonal antibody against human Tau (α-hTau; red dye) and a rabbit antiserum against GFP (α-GFP; cyan dye). Co-localization of S11-Tau with GFP1–10 reconstitutes GFP and results in biFC (green biofluorescence). BiFC overlaps the distribution of Tau (α-hTau/biFC merge; nuclei counter-stained with DAPI in blue). Also, biFC and α-hTau-staining are found along microtubules, visualized with an antiserum against α-tubulin (α-tub; cyan dye; image on the far right). (C and D) Same as above but for C-terminally tagged Tau-S11. Scale bars: 10 µm.
Figure 2
Figure 2
Cellular localization of TDP-43 multimers revealed by GFP triFC. (A) Schematic rendition of two variants of human Tau each independently tagged at the N-terminus with T10 and T11, co-expressed with the GFP1–9 sensor but not leading to GFP reconstitution. (B) Confocal images of C17.2 cells transfected with T10-Tau, T11-Tau and GFP1–9 (upper row) or GFP1–10 (lower row). (C and D) Same as in (A and B) but for TDP-43 instead of Tau. Dimerization of the tagged TDP-43 proteins steers T10 and T11 in an orientation and distance allowing triFC. The presence of Tau or TDP-43 was confirmed by immune staining with the corresponding specific antibody (red dye). In contrast to Tau that does not generate a triFC signal, expression of T10-TDP-43, T11-TDP-43 and GFP1–9 in the same cell results in triFC (green biofluorescence) co-localizing with the α-TDP-43 staining in the nucleus of transfected cells. Microtubule-associated Tau and nuclear TDP-43 reconstitute biFC when tagged with T11 and co-transfected with GFP1–10. For the merged images on the right, an antiserum to α-tubulin was used (α-tub; cyan dye). Scale bar: 10 µm.
Figure 3
Figure 3
Biochemical and quantitative analysis of the GFP triFC complex. (A) Confocal images of HEK-293 cells transfected with T10HA-TDP-43, T11β1-TDP-43 and GFP1–9 plasmids and immune stained with the β1 mouse antibody (red dye) and the α-HA antiserum (cyan dye). Their co-localization (β1/α-HA merge) reconstitutes the triFC ternary complex (green biofluorescence). Scale bar: 10 µm. (B) T10HA-TDP-43 and T11β1-TDP-43 (just above the 55 kDa marker) were also detected in RIPA lysates of cells transfected with the indicated plasmids by duplex-western blot with the β1 (upper panels, red) and α-HA (lower panels, cyan) antibodies. (C) Scheme of the immune isolation procedure for the triFC complex using the GFP trap system. (D) Western blot analysis of the immune isolates obtained from the cell lysates prepared for (B), showed the isolation of the triFC complex containing T11β1-TDP-43 (β1 blot) and T10HA-TDP-43 (α-HA blot) but not for the negative controls, or when replacing T11 with S11 (blot on the left). T11β1-TDP-43 and S11β1-TDP-43 were isolated in the presence of GFP1–10 (blot on the right). (E) Scheme of the biFC/triFC solid-phase immune assay with an α-GFP antiserum as capture and β1 as detection antibody. (F) The data obtained with the α-GFP/β1 immune assay for the cell lysates analysed in (B) were consistent with the immune isolation data shown in (D). Background value (0%) was determined for mock transfected cells, whereas the value obtained for the GFP1–10/T11β1-TDP-43 dimer was defined as 100% (% of T11 biFC). (G) Before lysis, 10,000 transfected cells were analysed by cytofluorimetry. The plots show mean fluorescence versus cell number for mock-transfected cells (inset) or cells expressing the T10HA-TDP-43, T11β1-TDP-43 and GFP1–9 triFC complex. The threshold value for fluorescent cells (dotted vertical line) was arbitrarily defined at the fluorescence value corresponding to 0.05% false positive hits for mock transfected cells. (H) Percent fluorescent cells (light grey) and mean GFP-fluorescence (dark grey) obtained by cytofluorimetry of cells expressing the indicated proteins. The value of T11β1-TDP-43/GFP1–10 cells was defined as 100% for both read-outs. (F and H) Percent values are means with standard deviations of biological triplicates and one-way ANOVA followed by Dunnett’s multiple comparisons to mock cells. Adjusted P values ****; #; § < 0.0001.
Figure 4
Figure 4
C-terminal T11 blocks triFC but not TDP-43 multimerization. (A) Scheme of the solid-phase immune assay detecting the ternary triFC complex in the presence of GFP1–9 captured with an α-HA antibody and detected with an α-GFP antiserum. (B) Cell lysates analysed with the α-HA/α-GFP immune assay show that T10HA-TDP-43 forms the triFC complex in the presence of T11-TDP-43 but not of TDP-43-T11, or in its absence. (C) Scheme of the solid-phase immune assay for protein multimers in the presence of GFP1–10. T10HA-TDP-43 is captured with an α-HA antibody and associated T11-β1-TDP-43 bound to GFP1–10 is detected with an α-GFP antibody. (D) T10HA-TDP-43 binds equally well to T11-TDP-43 and TDP-43-T11. For (B and D) cells were lysed under mild detergent conditions in order to preserve self-assembled TDP-43. (B and D) show mean values with standard deviations of biological triplicates with the N-terminally tagged TDP-43 pair defined as 100%. One-way ANOVA and Dunnett’s multiple comparisons to the negative control. Adjusted P values *** < 0.001. Same conditions were also analysed by western blot with an α-HA rabbit antiserum before (WB) or after (IP/WB) immune isolation with the GFP trap system in the presence of GFP1–9 for the triFC complex (E and F) or GFP1–10 for protein multimers (G and H). The protein labelled with an asterisk in (F and H). results from an unspecific reaction of the α-HA antibody in cell lysates (WB) that it is not immune isolated by the GFP trap system (IP/WB).
Figure 5
Figure 5
TDP-43 multimerization is driven by its N-terminal domain. (A) Schematic representation for the selective detection of TDP-43 interacting domains by GFP triFC. (B) Cytofluorimetric analysis of relative fluorescent (triFC-positive) cells (light grey) and their mean GFP-fluorescence (dark grey) for 10,000 human SH-SY5Y neuroblastoma cells transfected with the indicated plasmids. Only the N-terminal tagged TDP-43 pair and the C-terminal tagged NTD pair reconstitute triFC. Values are means with standard deviations of biological triplicates shown as percent of the N-terminal TDP-43 pair. All triFC values were normalized with the respective biFC values obtained in the presence of GFP1–10 as measure of T11-tagged TDP-43 expression. One-way ANOVA followed by Dunnett’s multiple comparisons to mock transfected cells. Adjusted P values * < 0.05; # < 0.0001; $ < 0.001. (C) Scheme representing the perturbation of TDP-43 multimerization (compared to the wt pair; top) caused by the insertion of point mutations within the NTD and expected to partly (2 MH/2 MT pair; middle) or completely (2 MT/2 MT pair; bottom) impair TDP-43 self-assembly. (D) SH-SY5Y cells were transfected with the indicated combinations of mutant T10HA-TDP-43 or T11β1-TDP-43 in the presence of GFP1–9. Cell lysates were then analysed with the α-GFP/β1 solid-phase immune assay for the triFC complex and normalized for T11β1-TDP-43 determined with the α-TDP-43/β1 immune assay. Values are means with standard deviations of biological triplicates and are expressed as percent of the value obtained for the wt pair. One-way ANOVA and Dunnett’s multiple comparisons to the negative control. Adjusted P values **** < 0.0001.

Similar articles

Cited by

References

    1. Aguzzi A, Lakkaraju AK. Cell Biology of Prions and Prionoids: A Status Report. Trends Cell. Biol. 2016;26:40–51. doi: 10.1016/j.tcb.2015.08.007. - DOI - PubMed
    1. Guo JL, Lee VM. Cell-to-cell transmission of pathogenic proteins in neurodegenerative diseases. Nat. Med. 2014;20:130–138. doi: 10.1038/nm.3457. - DOI - PMC - PubMed
    1. Forloni G, Artuso V, La Vitola P, Balducci C. Oligomeropathies and pathogenesis of Alzheimer and Parkinson’s diseases. Mov. Disord. 2016;31:771–781. doi: 10.1002/mds.26624. - DOI - PubMed
    1. Verma M, Vats A, Taneja V. Toxic species in amyloid disorders: Oligomers or mature fibrils. Ann. Indian Acad. Neurol. 2015;18:138–145. doi: 10.4103/0972-2327.150606. - DOI - PMC - PubMed
    1. Lasagna-Reeves CA, et al. Tau oligomers impair memory and induce synaptic and mitochondrial dysfunction in wild-type mice. Mol. Neurodegener. 2011;6:39. doi: 10.1186/1750-1326-6-39. - DOI - PMC - PubMed

Publication types