. 2017 Oct 26;8(1):1136.
doi: 10.1038/s41467-017-01062-w.

Resistance to checkpoint blockade therapy through inactivation of antigen presentation

Affiliations

Resistance to checkpoint blockade therapy through inactivation of antigen presentation

Moshe Sade-Feldman et al. Nat Commun. .

Abstract

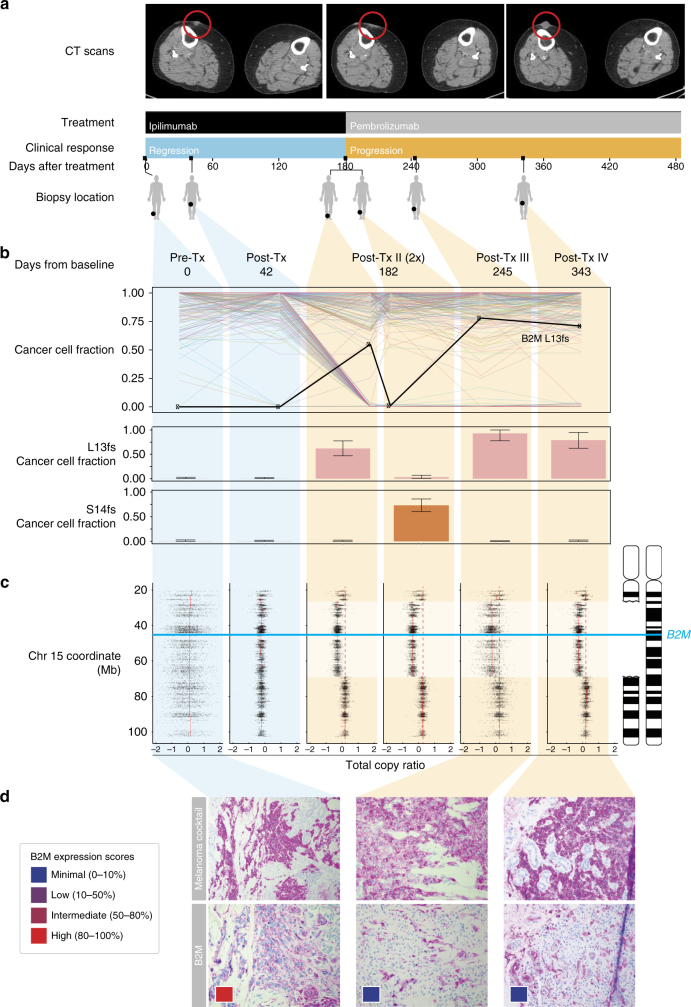
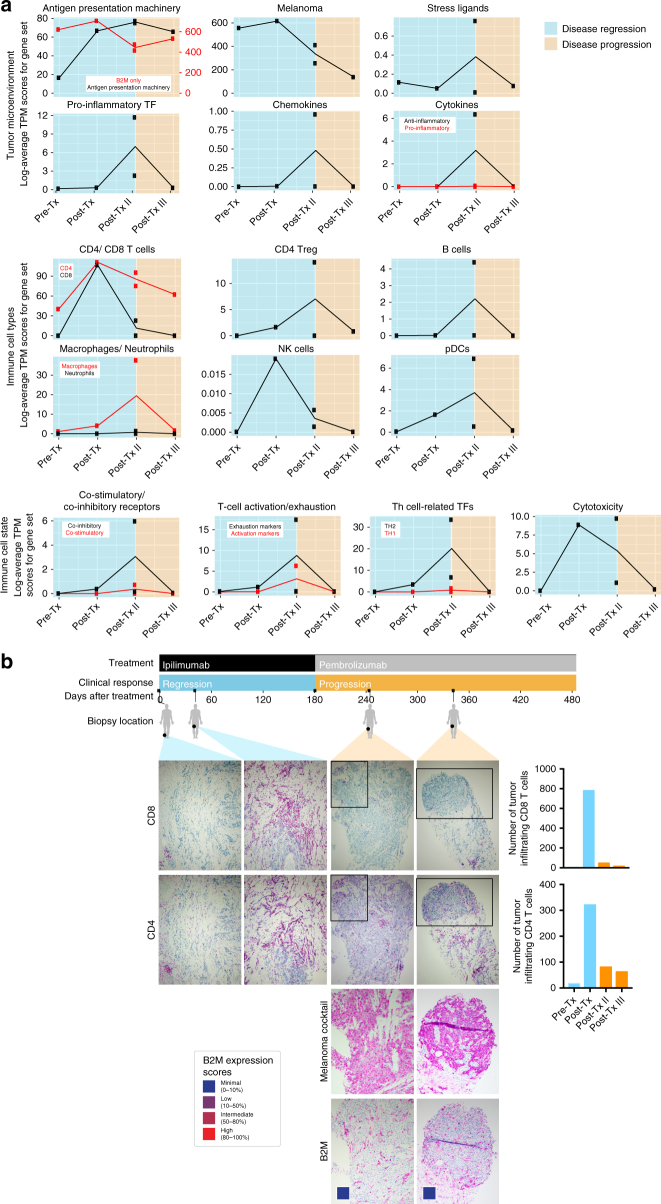
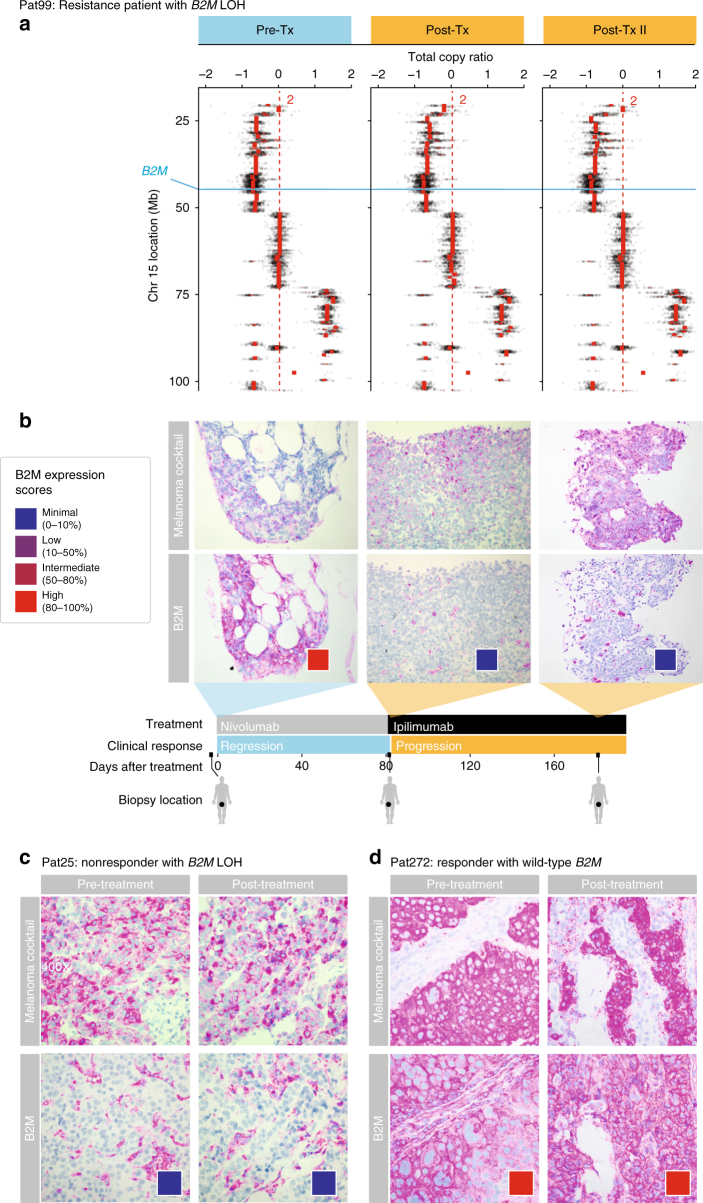
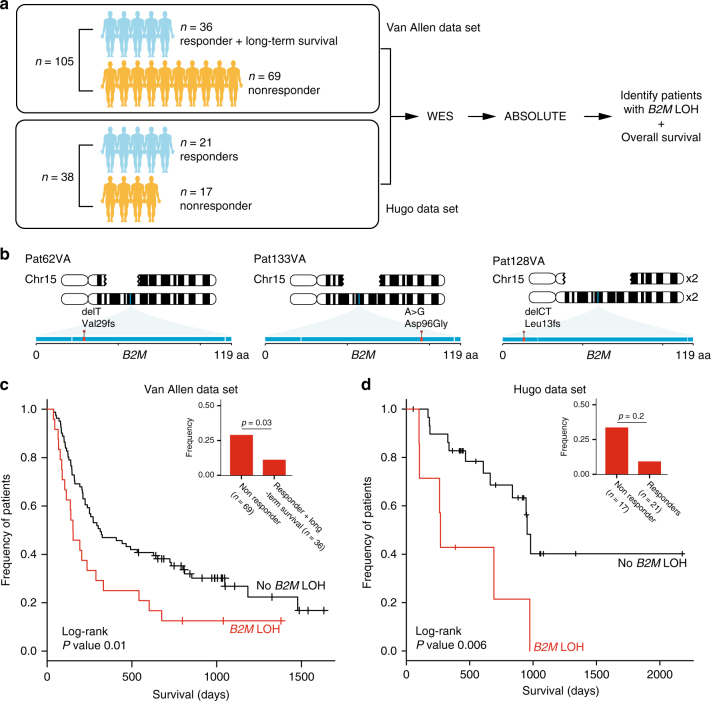
Treatment with immune checkpoint blockade (CPB) therapies often leads to prolonged responses in patients with metastatic melanoma, but the common mechanisms of primary and acquired resistance to these agents remain incompletely characterized and have yet to be validated in large cohorts. By analyzing longitudinal tumor biopsies from 17 metastatic melanoma patients treated with CPB therapies, we observed point mutations, deletions or loss of heterozygosity (LOH) in beta-2-microglobulin (B2M), an essential component of MHC class I antigen presentation, in 29.4% of patients with progressing disease. In two independent cohorts of melanoma patients treated with anti-CTLA4 and anti-PD1, respectively, we find that B2M LOH is enriched threefold in non-responders (~30%) compared to responders (~10%) and associated with poorer overall survival. Loss of both copies of B2M is found only in non-responders. B2M loss is likely a common mechanism of resistance to therapies targeting CTLA4 or PD1.


Conflict of interest statement

The authors declare no competing financial interests.

Figures

Fig. 1
Fig. 1
Loss of B2M is associated with resistance in a patient treated with checkpoint blockade. a Treatment and sample collection timeline for Pat208. Row 1, computed tomographic (CT) images of right thigh taken at baseline, during response and relapse; row 2, CPB treatments (ipilimumab—anti-CTLA4, pembrolizumab—anti-PD1); row 3, clinical response while on treatment, with blue indicating regression and orange indicating progression; row 4, days elapsed with respect to the start of treatment; row 5, location of biopsies taken at the different time points. b Criteria used to identify potential drivers of resistance, were genes with multiple non-silent mutations and LOH that are dominant only during disease progression. Out of 248 mutations with adequate coverage across all samples (detection power ⩾0.9), only B2M mutations satisfied all criteria (upper panel). Fraction of cancer cells harboring two separate early frameshift mutations in B2M (p.Leu13fs and p.Ser14fs) detected in Pat208. Blue backgrounds indicate samples taken during disease regression, and orange backgrounds indicate samples taken during disease progression. Error bars indicate 95% confidence intervals as inferred by ABSOLUTE (lower panel, described in “Methods” section). c Illustration of the deletions locations on chromosome 15 overlapping the B2M locus found in Pat208, as well as the location of the two early frameshift mutations relative to the B2M gene (blue line); and the total copy ratios of target regions on chromosome 15 in each biopsy. Red dashed lines indicate an absolute total copy number of 2 as inferred by ABSOLUTE. A deleted region overlapping the B2M locus is seen in all relapse samples (light orange background). d Samples were stained with an antibody cocktail for melanoma cells (mel.cocktail) using anti-melanosome (HMB45), anti-MART-1/melan A and anti-Tyrosinase, to discern melanoma cells from normal cells; or with an antibody specific for B2M. Colored boxes indicate B2M expression scores: B2M scoring was estimated by using four different levels of expression in the tumor fraction: minimal, 0–10%; low, 10–50%; intermediate, 50–80%; and high, 80–100%, B2M expression in the tumor fraction. Original magnification ×100
Fig. 2
Fig. 2
Dissecting the tumor microenvironment during disease regression and progression. a Expression scores of genes related to the tumor microenvironment, immune cell types, or immune cell states. Expression scores were calculated as the geometric mean of TPM values of genes in Supplementary Data 3. Blue backgrounds indicate biopsies taken during disease regression, and orange backgrounds indicate biopsies taken during disease progression. b Samples for each time point from Pat208 were stained with specific antibodies against CD8 or CD4 and were quantified using the cell counter function in Fiji (described in “Methods” section). Boxes areas in the upper panels (CD4 and CD8, original magnification ×100) are shown at higher magnification (×200) in the lower panels (melanoma cocktail and B2M). Colored boxes indicate B2M expression scores: B2M scoring was estimated by using four different levels of expression in the tumor fraction: minimal, 0–10%; low, 10–50%; intermediate, 50–80%; and high, 80–100%, B2M expression in the tumor fraction. A timeline of treatment, clinical response, and biopsy locations is shown at the top
Fig. 3
Fig. 3
LOH in B2M is found in resistance and non-responding patients treated with CPB. a Illustration of the deletion locations on chromosome 15 overlapping the B2M locus found in Pat99 (blue line); and the total copy ratios of target regions on chromosome 15 in each biopsy. Red dashed lines indicate an absolute total copy number of 2 as inferred by ABSOLUTE. A deleted region overlapping the B2M locus is seen in all samples. Top row indicates the timeline of treatment (blue–regression, orange–progression). bd Samples from Pat99 (b), Pat25 (c), and Pat272 (d) were stained with an antibody cocktail for melanoma cells (mel.cocktail) using anti-melanosome (HMB45), anti-MART-1/melan A and anti-Tyrosinase, to discern melanoma cells from normal cells; or with an antibody specific for B2M. Colored boxes indicate B2M expression scores: B2M scoring was estimated by using four different levels of expression in the tumor fraction: minimal, 0–10%; low, 10–50%; intermediate, 50–80%; and high, 80–100%, B2M expression in the tumor fraction. Original magnification ×100
Fig. 4
Fig. 4
Clinical relevance of B2M aberrations in two independent cohorts. a Analysis workflow for both Van Allen (105 patients pre-anti-CTLA4 treatment) and Hugo (38 patients pre-anti-PD1 treatment) data sets. For both data sets, we analyzed whole exome sequences of paired tumor and normal biopsies using the same pipeline used to analyze our cohort. b Illustration of three non-responders in the Van Allen data set with nucleotide mutations in B2M accompanied by loss of the wild-type allele. Gaps in the top chromosome depict the deleted region in each patient. Exons in B2M are shown as a horizontal blue rectangle, with mutations found in each patient highlighted in red. c Kaplan–Meier survival curves for patients in the Van Allen data set with (red) and without (black) B2M LOH. Log-rank p value is shown (p < 0.01). Inset shows the frequency of patients with B2M LOH in non-responders vs. responders and long-term survivors. One-sided Fisher’s exact p value is shown (p < 0.03). d Identical analysis performed for the Hugo data set as in c

Similar articles

Cited by

References

    1. Robert C, et al. Pembrolizumab versus ipilimumab in advanced melanoma. N. Engl. J. Med. 2015;372:2521–2532. doi: 10.1056/NEJMoa1503093. - DOI - PubMed
    1. Weber JS, et al. Nivolumab versus chemotherapy in patients with advanced melanoma who progressed after anti-CTLA-4 treatment (CheckMate 037): a randomised, controlled, open-label, phase 3 trial. Lancet Oncol. 2015;16:375–384. doi: 10.1016/S1470-2045(15)70076-8. - DOI - PubMed
    1. Herbst RS, et al. Predictive correlates of response to the anti-PD-L1 antibody MPDL3280A in cancer patients. Nature. 2014;515:563–567. doi: 10.1038/nature14011. - DOI - PMC - PubMed
    1. Pardoll DM. The blockade of immune checkpoints in cancer immunotherapy. Nat. Rev. Cancer. 2012;12:252–264. doi: 10.1038/nrc3239. - DOI - PMC - PubMed
    1. Zou W, Wolchok JD, Chen L. PD-L1 (B7-H1) and PD-1 pathway blockade for cancer therapy: mechanisms, response biomarkers, and combinations. Sci. Transl. Med. 2016;8:328rv324. doi: 10.1126/scitranslmed.aad7118. - DOI - PMC - PubMed

Publication types

MeSH terms