. 2017 Oct 24;7(1):14399.
doi: 10.1038/s41598-017-12652-5.

Direct Evidence of Adult Aedes albopictus Dispersal by Car

Affiliations

Direct Evidence of Adult Aedes albopictus Dispersal by Car

Roger Eritja et al. Sci Rep. .

Abstract

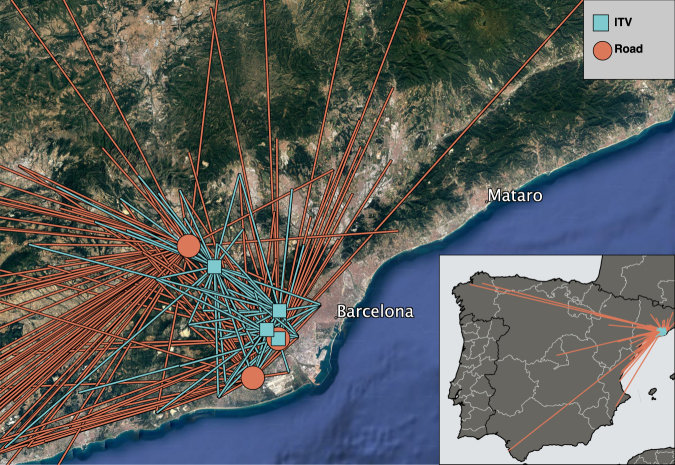
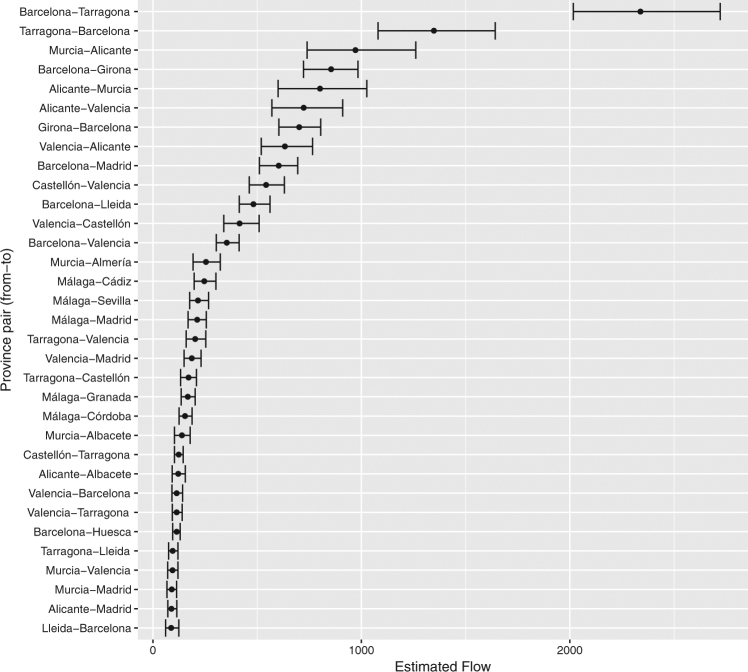
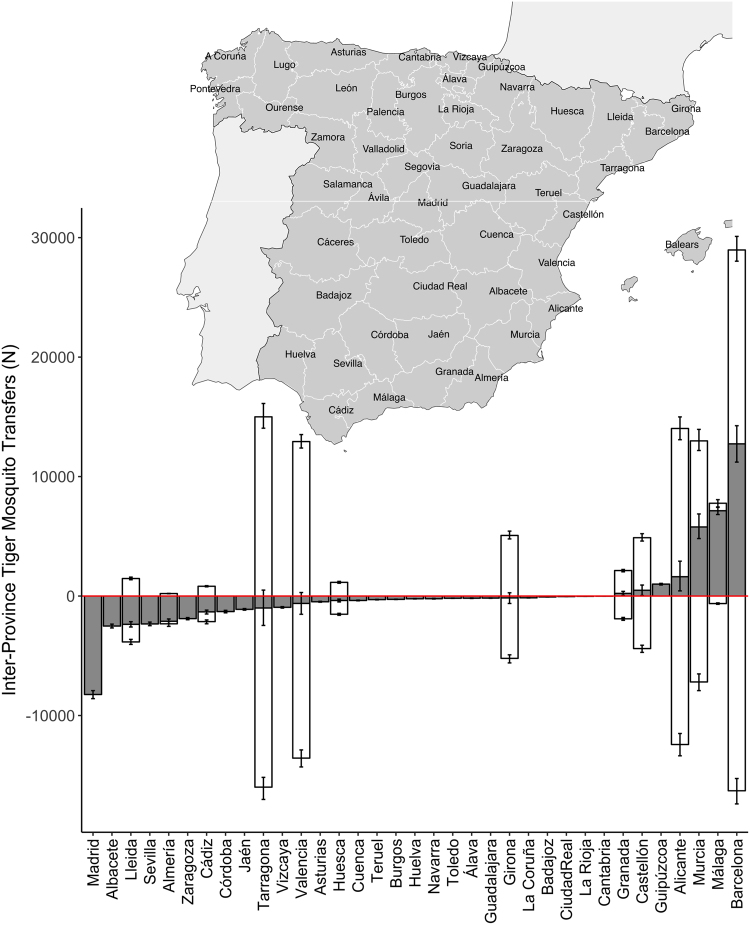
Whereas the Asian tiger mosquito (Aedes albopictus) has low active dispersal capabilities, its worldwide colonization has been rapid. Indirect evidence and informal reports have long implicated passive transportation in cars, but this has not previously been studied systematically given the difficulties of real-time roadside surveys. Here we report the first sampling study confirming that adult tiger mosquitoes travel with humans in cars and enabling us to estimate the frequency of these events. We combine the results with citizen science data to model the car-facilitated dispersal of Aedes albopictus at a nationwide level. During the summer of 2015, we sampled 770 cars in north-eastern Spain, discovering 4 adult female tiger mosquitoes that had entered cars prior to sampling. Our Bayesian model suggests that of the 6.5 million daily car trips in the Barcelona metropolitan area, between 13,000 and 71,500 facilitate tiger mosquito movement, and that Barcelona is the largest source of inter-province tiger mosquito transfers in Spain. Our results are supported by expert-validated citizen science data, and will contribute to better understanding the tiger mosquito's invasion process and ultimately lead to more effective vector control strategies.


Conflict of interest statement

The authors declare that they have no competing interests.

Figures

Figure 1
Figure 1
Sampling locations and approximate trip origins in Barcelona area (main map) and Spain (inset). Lines schematically indicate trips to sampling locations at ITVs (blue) and road stops (orange). Lines originate in centre of reported municipality for each trip. Satellite map image from Google: Imagery ©2017 TerraMetrics. Inset vector map made with Natural Earth version 2.0.0. Maps made using Quantum GIS version 2.18 (http://www.qgis.org/).
Figure 2
Figure 2
(A) Posterior predictive density of the tiger mosquito car-transport probability based on the naive model (no covariates). Solid black vertical line shows median, dotted black vertical lines show bounds of 90% credible interval, and dotted red vertical line marks zero. (B) Posterior density of origin alert probability coefficient in car transport model. Solid black vertical line shows median, dotted black vertical lines show bounds of 90% credible interval, and dotted red vertical line marks zero. (C) Posterior predictive interval across range of modelled tiger mosquito alert probabilities. Grey area shows 90% credible interval, black curve shows median, and dotted red line marks zero.
Figure 3
Figure 3
Photographs of tiger mosquitos in cars submitted by citizen scientists through Mosquito Alert.
Figure 4
Figure 4
Relative densities of inter-province tiger mosquito transfers via commuter flows during September based on predicted probability of finding a mosquito in a car as a function of origin Mosquito Alert probability. Risk of transport out of municipalities in which tiger mosquito presence has not been confirmed is set to zero before aggregating to province level. Colours correspond to source province and link widths are proportional to transfer density. Provinces in which tiger mosquitoes have not been confirmed in any municipality have zero estimated outgoing transfers and are coloured black. Balearic Islands, Canary Islands, Ceuta, and Melilla are excluded. See also Fig. 6 in the Supplementary Information. Estimates based on commuter flow data and human-mosquito interaction data from 2014–2015.
Figure 5
Figure 5
Estimated inter-province tiger mosquito transfers via commuter flows during September. Median estimates and 90% credible intervals based on predicted probability of finding a mosquito in a car as a function of origin Mosquito Alert probability. Risk of transport out of municipalities in which tiger mosquito presence has not been confirmed is set to zero before aggregating to province level. Province-pairs (y-axis) shown as origin-destination; plot shows only pairs with total September flows over 100 mosquitoes. Estimates based on commuter flow data and human-mosquito interaction data from 2014–2015.
Figure 6
Figure 6
Potential sources and sinks of tiger mosquitoes in Spain by province. Grey bars show net annual potential tiger mosquito outflows (outflow – inflow); white bars show gross annual potential outflows as positive and gross annual potential inflows as negative. Error bars show 90% credible interval for each estimate. Provinces ordered by net outflow and map of Spanish provinces shown above bar plot for reference. Estimates based on commuter flow data and human-mosquito interaction data from 2014–2015. Map is own compilation, using Quantum GIS version 2.18 (http://www.qgis.org/), with Spain data (shapefiles) taken from the Spanish National Statistics Institute (INE) website: www.ine.es. Map also includes data from Eurostat, http://ec.europa.eu/eurostat. © EuroGeographics for the international administrative boundaries. Balearic Islands, Canary Islands, Ceuta, and Melilla are excluded from the analysis.
Figure 7
Figure 7
Median estimates of gross number of tiger mosquitoes transported per day into (left) and out of (right) selected provinces by commuters. Selected provinces are those with the highest annual tiger mosquito inflows and outflows. Estimates based on commuter flow data and human-mosquito interaction data from 2014–2015.
Figure 8
Figure 8
Credible intervals for gross number of tiger mosquitoes transported per day into (top row) and out of (bottom row) selected provinces by commuters. Selected provinces are those with the highest annual tiger mosquito inflows and outflows. Colours indicate credibility level. Estimates based on commuter flow data and human-mosquito interaction data from 2014–2015.

References

    1. Laird, M. Commerce and the spread of pests and disease vectors (Praeger, 1984).
    1. Daszak P, Cunningham AA, Hyatt AD. Emerging infectious diseases of wildlife - threats to biodiversity and human health. Science. 2000;287:443–449. doi: 10.1126/science.287.5452.443. - DOI - PubMed
    1. Lounibos LP. Invasions by insect vectors of human disease. Annu. Rev. Entomol. 2002;47:233–266. doi: 10.1146/annurev.ento.47.091201.145206. - DOI - PubMed
    1. Jones KE, et al. Global trends in emerging infectious diseases. Nature. 2008;451:990–993. doi: 10.1038/nature06536. - DOI - PMC - PubMed
    1. Juliano SA, Philip Lounibos L. Ecology of invasive mosquitoes: effects on resident species and on human health. Ecol. Lett. 2005;8:558–574. doi: 10.1111/j.1461-0248.2005.00755.x. - DOI - PMC - PubMed

Publication types

LinkOut - more resources