. 2017 Oct 25;7(1):14065.
doi: 10.1038/s41598-017-14450-5.

Minocycline modulates microglia polarization in ischemia-reperfusion model of retinal degeneration and induces neuroprotection

Affiliations

Minocycline modulates microglia polarization in ischemia-reperfusion model of retinal degeneration and induces neuroprotection

Amel Ahmed et al. Sci Rep. .

Abstract

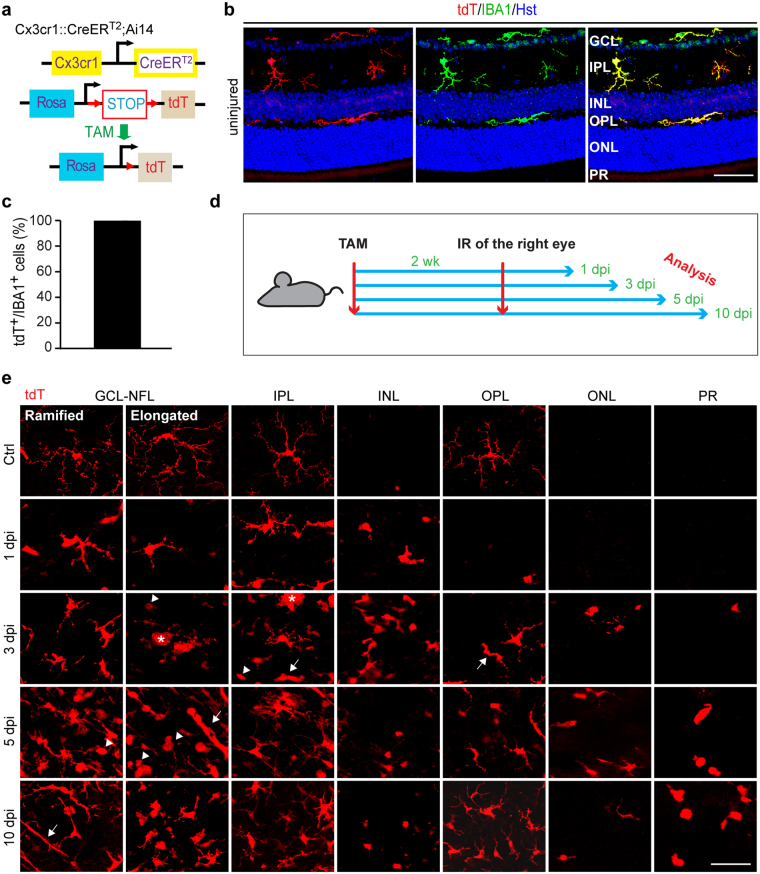
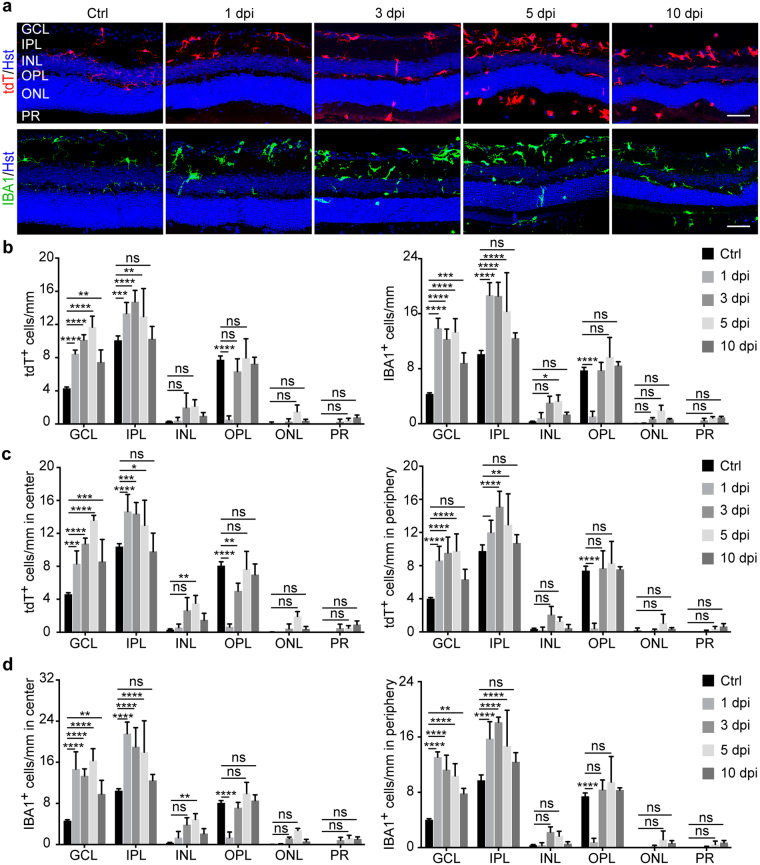
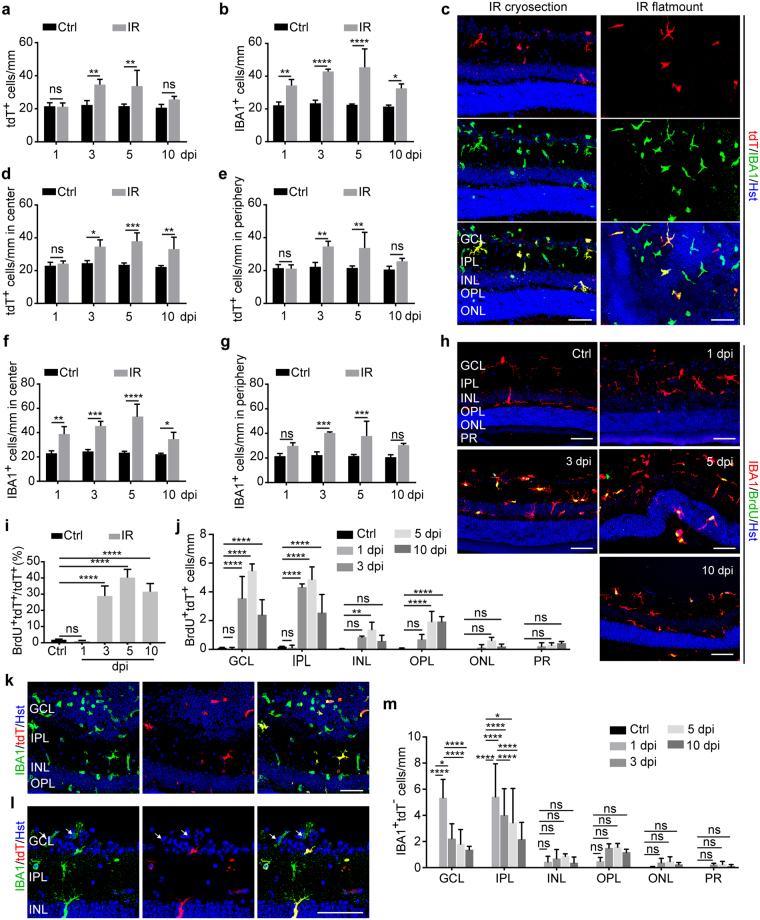
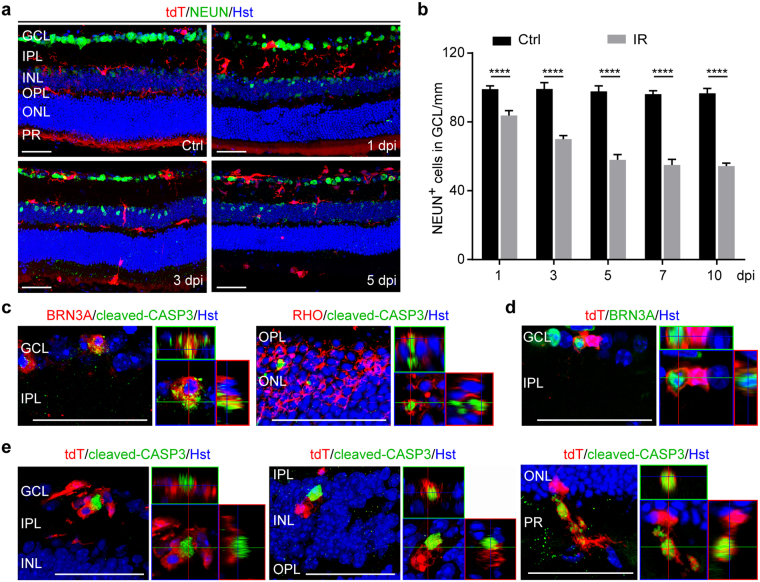
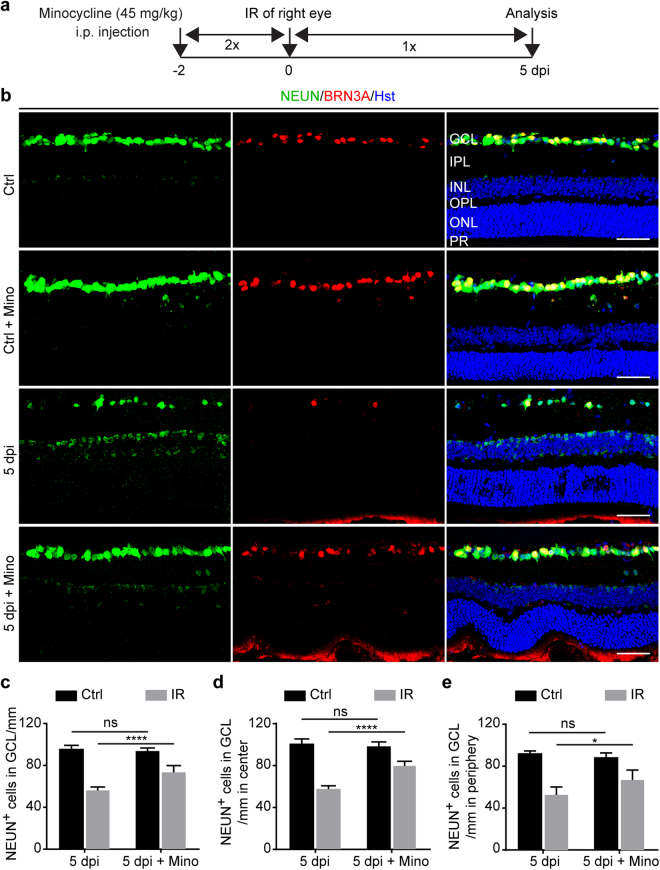
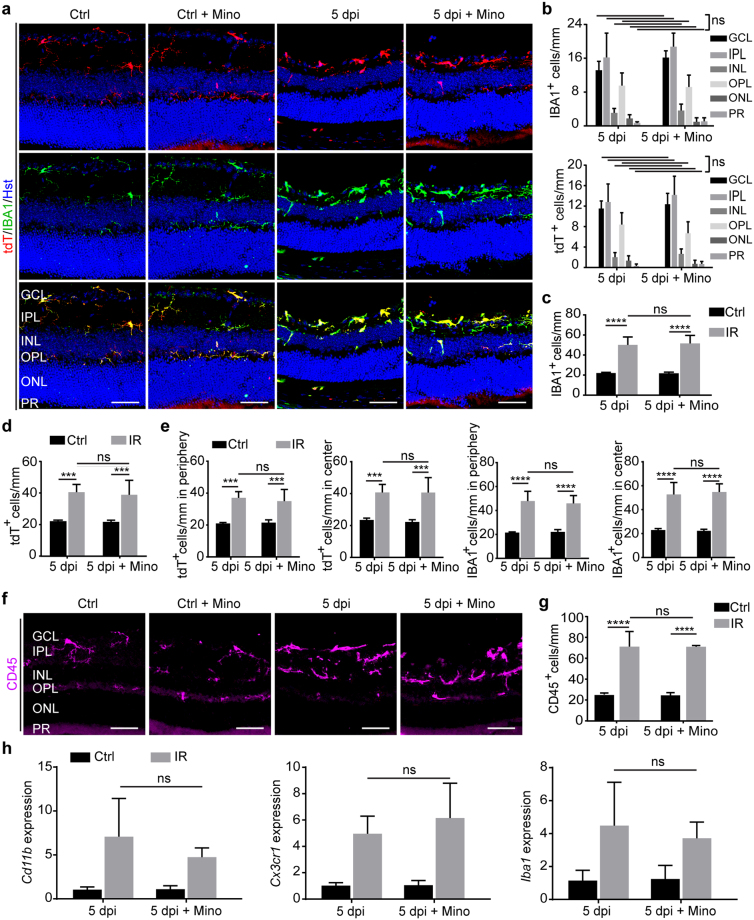
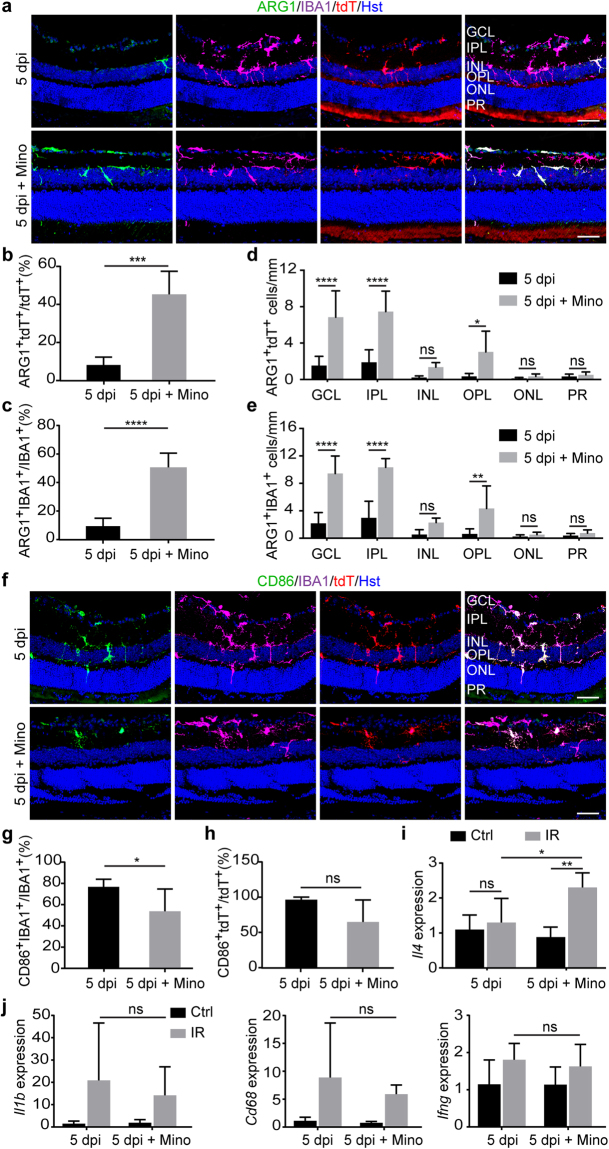
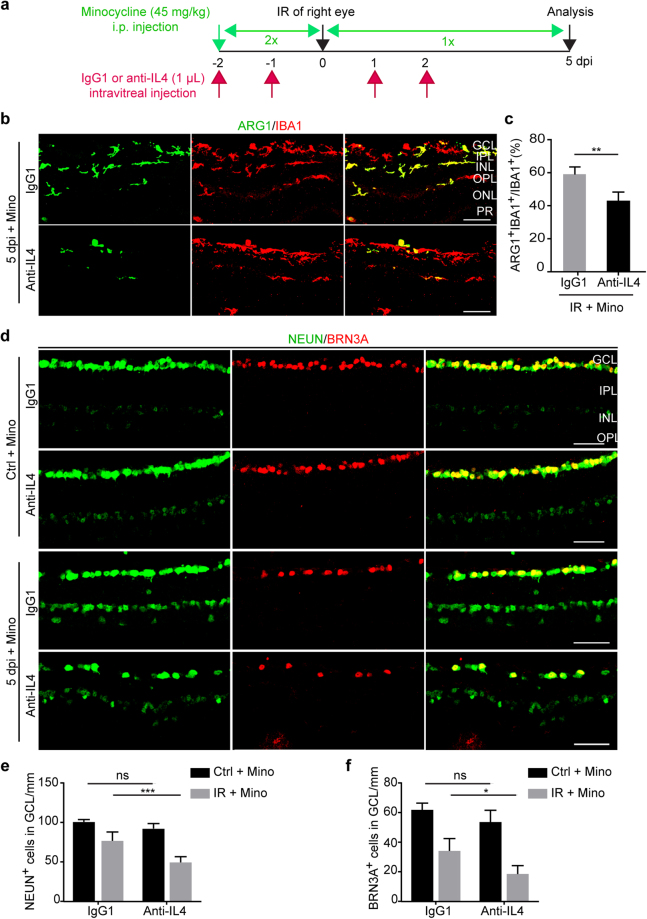
Retinal ischemia-reperfusion (IR) injury causes irreversible loss of neurons and ultimately leads to permanent visual impairment and blindness. The cellular response under this pathological retinal condition is less clear. Using genetically modified mice, we systematically examined the behavior of microglia/macrophages after injury. We show that IR leads to activation of microglia/macrophages indicated by migration and proliferation of resident microglia and recruitment of circulating monocytes. IR-induced microglia/macrophages associate with apoptotic retinal neurons. Very interestingly, neuron loss can be mitigated by minocycline treatment. Minocycline induces Il4 expression and M2 polarization of microglia/macrophages. IL4 neutralization dampens minocycline-induced M2 polarization and neuroprotection. Given a well-established safety profile as an antibiotic, our results provide a rationale for using minocycline as a therapeutic agent for treating ischemic retinal degeneration.


Conflict of interest statement

The authors declare that they have no competing interests.

Figures

Figure 1
Figure 1
IR induces robust activation of retinal microglia. (a) A genetic approach to trace retinal microglia in transgenic Cx3cr1::CreER T2 ;Ai14 mice (TAM, tamoxifen; tdT, tdTomato). (b) Representative confocal images of retinal microglia (GCL, ganglion cell layer; IPL, inner plexiform layer; INL, inner nuclear layer; OPL, outer plexiform layer; ONL, outer nuclear layer; PR, photoreceptor layer). Scale bar, 50 µm. (c) Labeling efficiency of resident microglia by the reporter tdT (n = 20 mice). (d) A schematic diagram of experimental design (IR, ischemia reperfusion; wk, weeks; dpi, days post injury). (e) Representative confocal images of microglia in retinal whole mounts. Resting microglia exhibit ramified morphology with small soma and long thin primary processes. At the indicated time points, injury induces soma enlargement and process retraction. The arrowheads, arrows, and asterisks indicate amoeboid, rod-like, and giant cells, respectively. NFL, nerve fiber layer; scale bar, 50 µm.
Figure 2
Figure 2
IR alters microglia orientation and distribution. (a) Confocal images of retinal sections showing orientation and layer distribution of microglia under resting and IR injury conditions. Microglia were mainly observed in the GCL and IPL but rarely in the OPL at 1 dpi. They gradually appeared in the INL, ONL, and PR at later time points after injury. Scale bars, 50 µm. (b) Retinal layer distribution of microglia under the indicated conditions. Data are presented as mean ± SD per mm retinal length (n = 4 mice per group). Statistical analysis was performed by two-way ANOVA and post hoc Tukey’s test (*p ≤ 0.05, **p ≤ 0.01, ***p = 0.0004, and ****p ≤ 0.0001; ns, not significant). (c) Subregional analysis of tdT+ cells under the indicated conditions. Data are presented as mean ± SD per mm retinal length (n = 4 mice per group). Statistical analysis was performed by two-way ANOVA and post hoc Tukey’s test (*p = 0.03, **p ≤ 0.01, ***p = 0.0002, and ****p ≤ 0.0001; ns, not significant). (d) Subregional analysis of IBA1+ cells under the indicated conditions. Data are presented as mean ± SD per mm retinal length (n = 4 mice per group). Statistical analysis was performed by two-way ANOVA and post hoc Tukey’s test (**p ≤ 0.01 and ****p ≤ 0.0001; ns, not significant).
Figure 3
Figure 3
IR induces microglia proliferation and macrophage infiltration. (a) IR induces a dynamic increase of tdT+ cells. Data were obtained at the indicated time points and presented as mean ± SD per mm retinal length (n = 4 mice per group). Statistical analysis was performed by two-way ANOVA and post hoc Tukey’s test (F(1,21) = 29.04 and p < 0.0001 for injury effect; F(3, 21) = 6.68 and p = 0.0024 for time effect; F(3,21) = 5.31 and p = 0.0070 for time-injury interaction; **p ≤ 0.005; ns, not significant). (b) IR induces a dynamic increase of IBA1+ microglia/macrophages. Data were obtained at the indicated time points and are presented as mean ± SD per mm retinal length (n = 4 mice per group). Statistical analysis was performed by two-way ANOVA and post hoc Tukey’s test (F(1,21) = 119.7 and p < 0.0001 for injury effect; F(3, 21) = 5.33 and p = 0.0069 for time effect; F(3,21) = 3.62 and p = 0.0300 for time-injury interaction; *p = 0.0270, **p = 0.0066, and ****p < 0.0001). (c) Confocal images of microglia/macrophages at 5 dpi. Some IBA1+ cells are not co-labeled by tdT. Scale bars, 50 µm. (dg) Subregional analysis of increased microglia/macrophages. Data were obtained at the indicated time points and are presented as mean ± SD per mm retinal length (n = 4 mice per group). Statistical analysis was performed by two-way ANOVA and post hoc Tukey’s test (*p ≤ 0.05, **p ≤ 0.01, ***p ≤ 0.001, and ****p ≤ 0.0001; ns, not significant). (h) Confocal images of proliferating microglia/macrophages at the indicated time points. Scale bars, 50 µm. (i) Quantification of BrdU-labeled microglia. Data were obtained at the indicated time points and are presented as mean ± SD (n = 4 mice per group). Statistical analysis was performed by two-way ANOVA and post hoc Tukey’s test (****p ≤ 0.0001; ns, not significant). (j) Retinal layer distribution of proliferating microglia. Data were obtained at the indicated time points and are presented as mean ± SD per mm retinal length (n = 4 mice per group). Statistical analysis was performed by two-way ANOVA and post hoc Tukey’s test (**p = 0.0021 and ****p ≤ 0.0001; ns, not significant). (kl) Representative confocal images showing infiltrated macrophages in the GCL at 1 dpi. These cells are IBA1+tdT. Scale bar, 50 µm. (m) Retinal layer distribution of recruited macrophages after injury. Data are presented as mean ± SD per mm retinal length (n = 4 mice per group). Statistical analysis was performed by two-way ANOVA and post hoc Tukey’s test (*p ≤ 0.05 and ****p ≤ 0.0001; ns, not significant).
Figure 4
Figure 4
Association of microglia/macrophages with apoptotic neurons. (a) Confocal images showing injury-induced progressive loss of neurons in the GCL at the indicated time points. Scale bars, 50 µm. (b) Quantification of surviving neurons in the GCL. Data are presented as mean ± SD (n = 4 mice per group). Statistical analysis was performed by two-way ANOVA and post hoc Tukey’s test (F(1,29) = 1,483 and p < 0.0001 for injury effect; F(4, 29) = 51.46 and p < 0.0001 for time effect; F(4,29) = 35.36 and p < 0.0001 for time-injury interaction; ****p < 0.0001). (c) Confocal images showing apoptotic neurons at 5 dpi. Scale bars, 50 µm. (d) Confocal images showing a retinal ganglion cell engulfed by microglia at 5dpi. Scale bar, 50 µm. (e) Tight associations of microglia with apoptotic cells across all retinal layers at 5dpi. Scale bars, 50 µm.
Figure 5
Figure 5
Minocycline improves survival of retinal neurons. (a) Experimental design. Minocycline was intraperitoneally (i.p.) injected twice daily for two days prior to IR injury, twice on the day of surgery, and once per day for five days after injury. (b) Confocal images showing neurons in the GCL under the indicated treatment conditions at 5dpi. Mino, minocycline. Scale bars, 50 µm. (c) Quantification of neurons in the GCL. Data are presented as mean ± SD per mm retinal length (n = 5 mice per group). Statistical analysis was performed by two-way ANOVA and post hoc Tukey’s test (F(1,16) = 246.3 and p < 0.0001 for injury effect; F(1,16) = 15.34 and p = 0.0012 for treatment effect; F(1,16) = 29.47 and p = 0.0001 for injury-treatment interactions; ****p < 0.0001; ns, not significant). (d,e) Subregional analysis shows a positive effect of minocycline on neuronal survival across the entire retina. Data are presented as mean ± SD per mm retinal length (n = 5 mice per group). Statistical analysis was performed by two-way ANOVA and post hoc Tukey’s test (*p = 0.0152 and ****p < 0.0001; ns, not significant).
Figure 6
Figure 6
Minimal effect of minocycline on microglia/macrophage activation. (a,b) Minocycline fails to change morphology and retinal layer distribution of microglia/macrophages at 5 dpi. Data are presented as mean ± SD per mm retinal length (n = 5 mice per group). Statistical analysis was performed by two-way ANOVA and post hoc Tukey’s test (ns, not significant). Scale bars, 50 µm. (c,d) The overall number of microglia/macrophages is not altered by minocycline after IR. Data are presented as mean ± SD per mm retinal length (n = 5 mice per group). Statistical analysis was performed by two-way ANOVA and post hoc Tukey’s test (***p ≤ 0.0005 and ****p < 0.0001; ns, not significant). (e) Minocycline has minimal effect on subregional distribution of activated microglia/macrophages. Data are presented as mean ± SD per mm retinal length (n = 5 mice per group). Statistical analysis was performed by two-way ANOVA and post hoc Tukey’s test (***p ≤ 0.0007, and ****p < 0.0001; ns, not significant). (f,g) Histological analysis of CD45+ microglia/macrophages. Data are presented as mean ± SD per mm retinal length (n = 5 mice per group). Statistical analysis was performed by two-way ANOVA and post hoc Tukey’s test (****p < 0.0001; ns, not significant). (h) qRT-PCR analysis of gene expression. Data are presented as mean ± SD (n = 5 mice per group). Statistical analysis was performed by two-way ANOVA and post hoc Tukey’s test (ns, not significant).
Figure 7
Figure 7
Minocycline affects polarization of microglia/macrophages. (a) Confocal images showing ARG1+ M2 phenotype of microglia/macrophages at 5 dpi. Scale bars, 50 µm. (b,c) Minocycline promotes M2 polarization of activated microglia/macrophages. Data are presented as mean ± SD (n = 5 mice per group). Statistical analysis was performed by unpaired two-tailed t-test (***p = 0.0002 and ****p < 0.0001 for ARG1+tdT+ and ARG1+IBA1+ cells, respectively). (d,e) Minocycline-induced M2 phenotype is mainly in the inner retinal layers. Data are presented as mean ± SD per mm retinal length (n = 5 mice per group). Statistical analysis was performed by two-way ANOVA and post hoc Tukey’s test (*p = 0.0173, **p = 0.0027 and ****p < 0.0001; ns, not significant). (f) Confocal images showing CD86+ M1 phenotype of microglia/macrophages. Scale bars, 50 µm. (g,h) Minocycline modestly reduces M1 phenotype of microglia/macrophages at 5dpi. Data are presented as mean ± SD (n = 5 mice per group). Statistical analysis was performed by unpaired two-tailed t-test (p = 0.055 and *p = 0.048 for CD86+tdT+ and CD86+IBA1+ cells, respectively). (i) qRT-PCR analysis of interleukin 4 (Il4) expression. Data are presented as mean ± SD (n = 5 mice per group). Statistical analysis was performed by two-way ANOVA and post hoc Tukey’s test (*p = 0.0190 and **p = 0.0012; ns, not significant). (j) qRT-PCR analysis of genes for M1 phenotype. Data are presented as mean ± SD (n = 5 mice per group). Statistical analysis was performed by two-way ANOVA and post hoc Tukey’s test (ns, not significant).
Figure 8
Figure 8
A role of IL4 in microglia/macrophage polarization and neuron survival. (a) Experimental design. (b,c) IL4 neutralization dampens minocycline-induced microglia/macrophage polarization. Immunohistochemistry was performed at 5 dpi. Data are presented as mean ± SD (n = 5 mice per group). Statistical analysis was performed by unpaired two-tailed t-test (**p = 0.0023). Scale bars, 50 µm. (df) IL4 neutralization reduces minocycline-mediated neuroprotection. Data are presented as mean ± SD per mm retinal length (n = 5 mice per group). Statistical analysis was performed by two-way ANOVA and post hoc Tukey’s test (*p = 0.0117, and ***p = 0.0001; ns, not significant).

Similar articles

Cited by

References

    1. D’Onofrio PM, Koeberle PD. What can we learn about stroke from retinal ischemia models? Acta Pharmacol. Sin. 2013;34:91–103. doi: 10.1038/aps.2012.165. - DOI - PMC - PubMed
    1. Goldblum D, Mittag T. Prospects for relevant glaucoma models with retinal ganglion cell damage in the rodent eye. Vision Res. 2002;42:471–478. doi: 10.1016/S0042-6989(01)00194-8. - DOI - PubMed
    1. Osborne NN, et al. Optic nerve and neuroprotection strategies. Eye (Lond). 2004;18:1075–84. doi: 10.1038/sj.eye.6701588. - DOI - PubMed
    1. Verma D. Pathogenesis of diabetic retinopathy–the missing link? Med. Hypotheses. 1993;41:205–10. doi: 10.1016/0306-9877(93)90231-E. - DOI - PubMed
    1. Osborne NN, et al. Retinal ischemia: Mechanisms of damage and potential therapeutic strategies. Prog. Retin. Eye Res. 2004;23:91–147. doi: 10.1016/j.preteyeres.2003.12.001. - DOI - PubMed

Publication types

LinkOut - more resources