. 2017 Oct 26;8(1):1141.
doi: 10.1038/s41467-017-01384-9.

Characterization of histone acylations links chromatin modifications with metabolism

Affiliations

Characterization of histone acylations links chromatin modifications with metabolism

Johayra Simithy et al. Nat Commun. .

Abstract

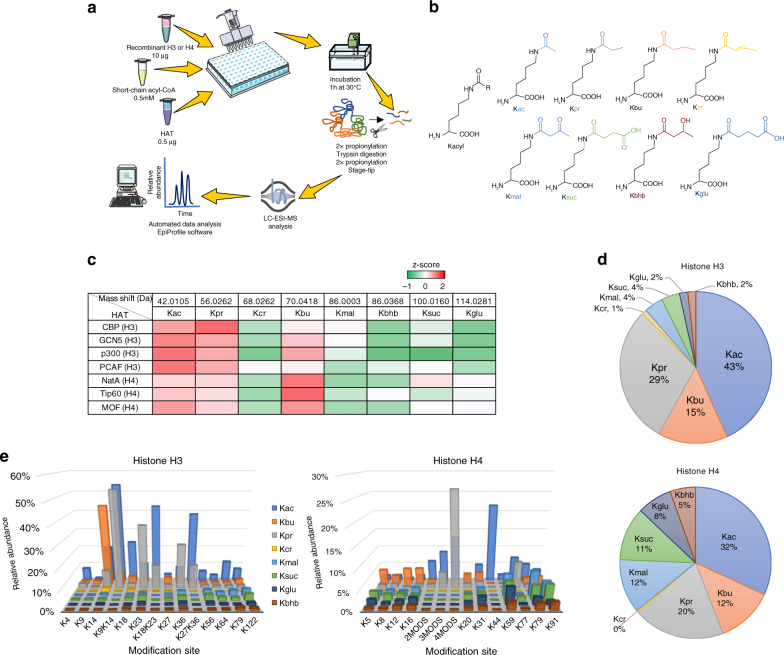
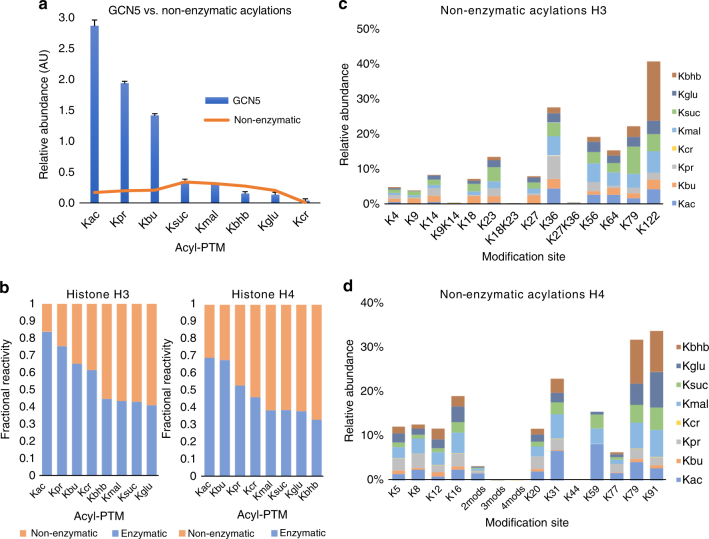
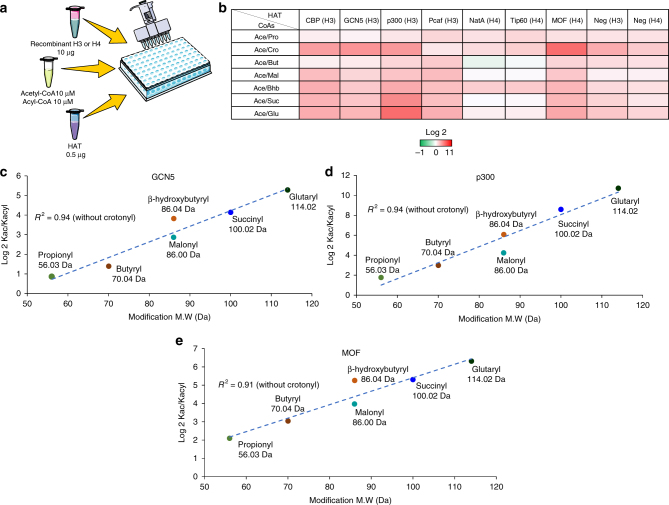
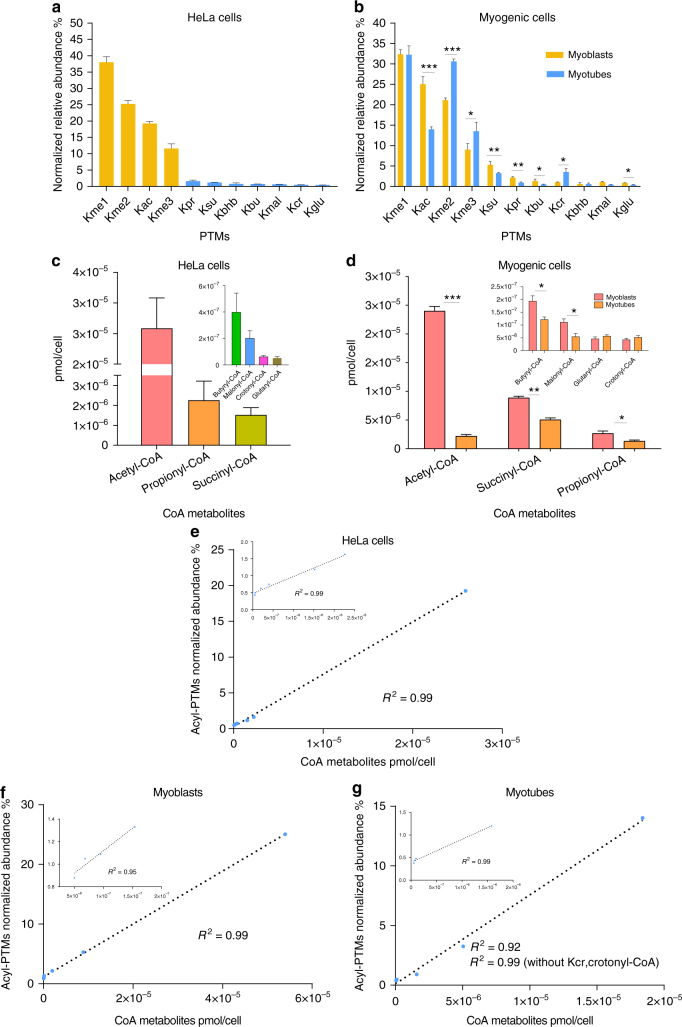
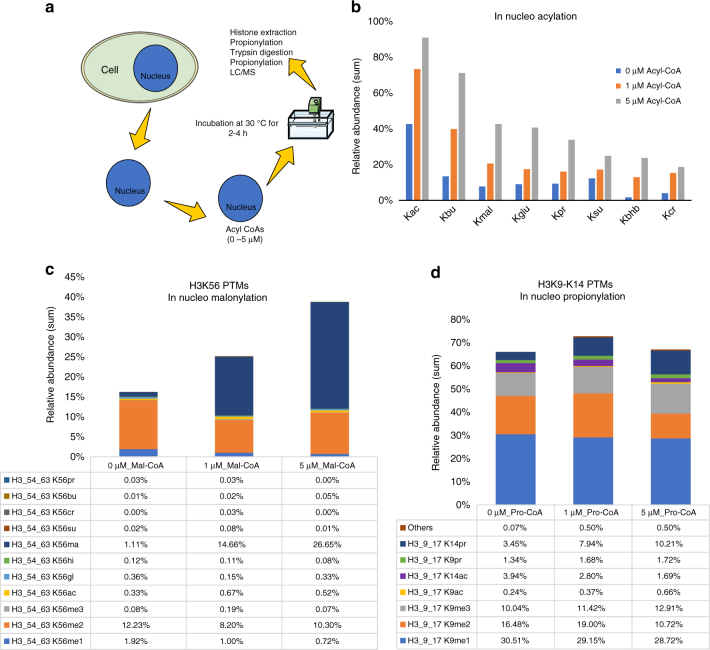
Over the last decade, numerous histone acyl post-translational modifications (acyl-PTMs) have been discovered, of which the functional significance is still under intense study. Here, we use high-resolution mass spectrometry to accurately quantify eight acyl-PTMs in vivo and after in vitro enzymatic assays. We assess the ability of seven histone acetyltransferases (HATs) to catalyze acylations on histones in vitro using short-chain acyl-CoA donors, proving that they are less efficient towards larger acyl-CoAs. We also observe that acyl-CoAs can acylate histones through non-enzymatic mechanisms. Using integrated metabolomic and proteomic approaches, we achieve high correlation (R 2 > 0.99) between the abundance of acyl-CoAs and their corresponding acyl-PTMs. Moreover, we observe a dose-dependent increase in histone acyl-PTM abundances in response to acyl-CoA supplementation in in nucleo reactions. This study represents a comprehensive profiling of scarcely investigated low-abundance histone marks, revealing that concentrations of acyl-CoAs affect histone acyl-PTM abundances by both enzymatic and non-enzymatic mechanisms.


Conflict of interest statement

The authors declare no competing financial interests.

Figures

Fig. 1
Fig. 1
Overview of histone acetyltransferases (HATs) in vitro acylation activity and specificity. a Schematic representation of in vitro acylation assay. b Chemical structures of histone acyl modifications evaluated in this study. Lysine modifications and abbreviations are: acetyl (Kac), propionyl (Kpr), butyryl (Kbu), crotonyl (Kcr), malonyl (Kmal), succinyl (Ksuc), β-hydroxybutyryl (Kbhb), and glutaryl (Kglu). c Heat map displaying the in vitro acylation activity profiles of different HATs in the presence of acetyl-, propionyl-, crotonyl-, butyryl-, malonyl-, β-hydroxybutyryl-, succinyl- and glutaryl-CoA. Molecular mass shift of the various acylated lysines residues are shown in the table headers. Different HATs were assayed against histones H3 or H4 as specified in the first column. To generate the heat map, we averaged the relative abundance of acyl-PTMs on the quantified peptides and then normalized (z-scores) those values across the different HATs, i.e. row normalization. d Pie chart showing the average relative frequency of in vitro acylated peptides, divided in results for histone H3 (top) and histone H4 (bottom). e Bar plots depict the specificity for all HATs on the histone sequence. The x axis represents the modification site at histones H3 (left) and histone H4 (right), and the y axis represents the relative abundance shown as the average contribution of HATs to all acylated peptides. For histone H4 N-terminal peptide (G4-R17), the number of acylations on the sequence are displayed using the code 2, 3 or 4 mods. This is because it was not always possible to discriminate modification sites on the multiply modified H4 peptide. All values shown were corrected by the contribution of non-enzymatic acylation. All results are shown as the average of 3 independent experiments
Fig. 2
Fig. 2
Non-enzymatic versus enzymatic acylation of histones in vitro. a Comparison of non-enzymatic versus GCN5-catalyzed acylations on histone H3. The y axis (arbitrary units) represents the sum of the relative abundances of all enzymatically and non-enzymatically acylated peptides from histones H3. We can observe that the contributions for Ksuc, Kmal, Kbhb, Kglu and Kcr in the experiments with GCN5 were mostly the result of non-enzymatic acylations. b Stacked column representation of non-enzymatic reactivity divided by enzymatic reactivity of the eight acyl-CoA donors on histone H3 (left) and histone H4 (right). The fractional reactivity represents the ratio of PTM intensity in presence of all seven enzymes tested versus PTM intensity in absence of enzymes, i.e., 0.5 corresponds to identical intensities with and without enzyme. For instance, crotonylation is an overall low abundance PTM, although the majority detected on histone peptides is the result of an enzymatic catalysis. c, d Bar plot showing the relative quantitation of non-enzymatically acylated sites on c histones H3 and d histone H4. All results are shown as the average of three independent experiments and error bars represent the S.D.
Fig. 3
Fig. 3
In vitro acetylation competition assay. a Schematic representation of the in vitro competition acetylation assay. b Heat map displaying in vitro acylation specificities of HATs during acyl-CoA competition assays. Different HATs were assayed against histones H3 or H4 as specified in the table headers in the presence of equimolar concentrations of acetyl-CoA and a competing acyl-CoA donor. Negative controls with no enzyme are also shown. c Correlation between the molecular weight and the acylation preference for different acyl donors displayed for the HATs GCN5 on histone H3, d p300 on histone H3 and e MOF on histone H4. For each modification, molecular weight is indicated. Results show that the preference for acetyl-CoA over the other acyl donor tightly correlates with the molecular weight of the acyl donor. Crotonylation was not included in the correlations, as its molecular weight did not correlate well with the preference of the enzymes over acetyl-CoA. All graphs are shown as the average of log2 ratios between the relative abundances of all acetylated peptides and the relative abundances of the corresponding competing acylated peptide
Fig. 4
Fig. 4
Overview of the relative abundances of endogenous acyl-PTMs and intracellular metabolite concentrations. Bar plots showing the relative abundances of several lysine PTMs in a HeLa cells, b proliferative myogenic cells (myoblasts) and differentiated myogenic cells (myotubes). PTMs are shown as percentages representing the normalized relative abundances of all detectable peptides of canonical histones H3 and H4. c, d Bar plots showing the concentrations of acyl-CoA metabolites in c HeLa cells and d myogenic cells normalized to cell number. Metabolic concentrations of butyryl-CoA may also represent concentrations for isobutyryl-CoA. eg Global histone acylation levels correlation with intracellular concentrations of acyl-CoA metabolic intermediates in e HeLa cells, f myoblasts and g myotubes. Correlations are calculated between the normalized net abundances of all detectable acylated peptides in H3 and H4 and the global concentrations CoA metabolites in pmol per cell. Insets show zoom in graphs with the linear correlation of the data without the values for acetyl-CoA and Kac. All results are shown as the average of three biological replicates and error bars represent the S.D. Summary of p-values is as follows; *p ≤ 0.05, **p ≤ 0.01, and ***p ≤ 0.001. p-values were generated by unpaired Student’s t-test
Fig. 5
Fig. 5
Analysis of in nucleo acylation. a Schematic representation of in nucleo acylation assay. b Bar plots showing the dose-dependent acylation of histones upon treatment with 0, 1 and 5 μM of acetyl-, butyryl-, malonyl-, glutaryl-, propionyl-, succinyl-, β-hydroxybutyryl and crotonyl-CoA, respectively. Values represent the sum of the relative abundances of all acylated peptides from histones H3 and H4. c Example of in nucleo acylation resulting in an increase in malonylation of H3K56 after treatment with increasing concentrations of malonyl-CoA. d Example of in nucleo acylation showing that induced propionylation by increasing the concentration of propionyl-CoA resulted into a reduced relative abundance of acetylation on the site H3K14

References

    1. Verdone L, Caserta M, Di Mauro E. Role of histone acetylation in the control of gene expression. Biochem. Cell Biol. Biochim. Biol. Cell. 2005;83:344–353. doi: 10.1139/o05-041. - DOI - PubMed
    1. Mersfelder EL, Parthun MR. The tale beyond the tail: histone core domain modifications and the regulation of chromatin structure. Nucleic Acids Res. 2006;34:2653–2662. doi: 10.1093/nar/gkl338. - DOI - PMC - PubMed
    1. Bannister AJ, Kouzarides T. Regulation of chromatin by histone modifications. Cell Res. 2011;21:381–395. doi: 10.1038/cr.2011.22. - DOI - PMC - PubMed
    1. Wang GG, Allis CD, Chi P. Chromatin remodeling and cancer, Part I: Covalent histone modifications. Trends Mol. Med. 2007;13:363–372. doi: 10.1016/j.molmed.2007.07.003. - DOI - PubMed
    1. Montgomery DC, Sorum AW, Guasch L, Nicklaus MC, Meier JL. Metabolic Regulation of Histone Acetyltransferases by Endogenous Acyl-CoA Cofactors. Chem. Biol. 2015;22:1030–1039. doi: 10.1016/j.chembiol.2015.06.015. - DOI - PMC - PubMed

Publication types