

Individual mobility promotes punishment in evolutionary public goods games
- PMID: 29070844
- PMCID: PMC5656631
- DOI: 10.1038/s41598-017-12823-4
Individual mobility promotes punishment in evolutionary public goods games
Abstract
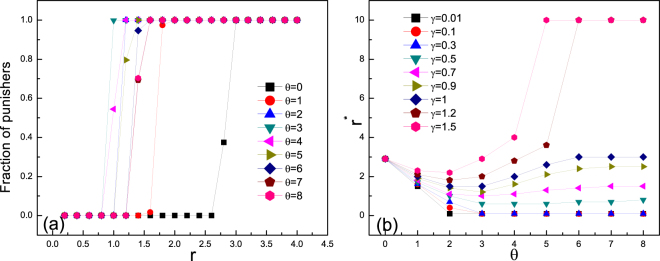
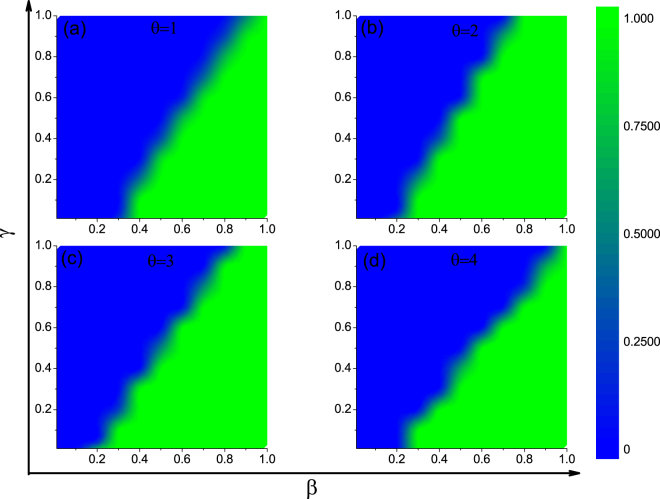
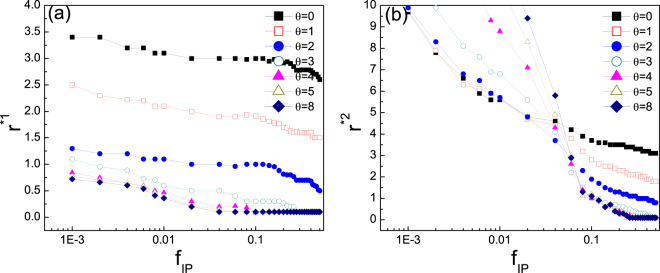
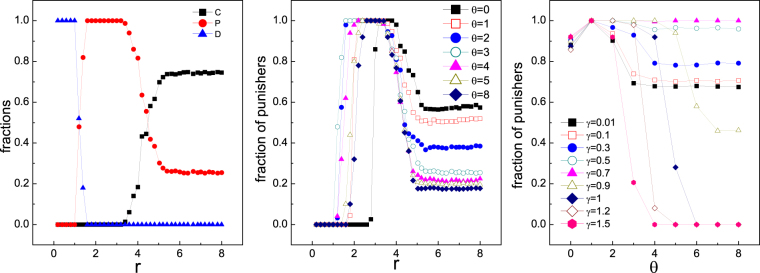
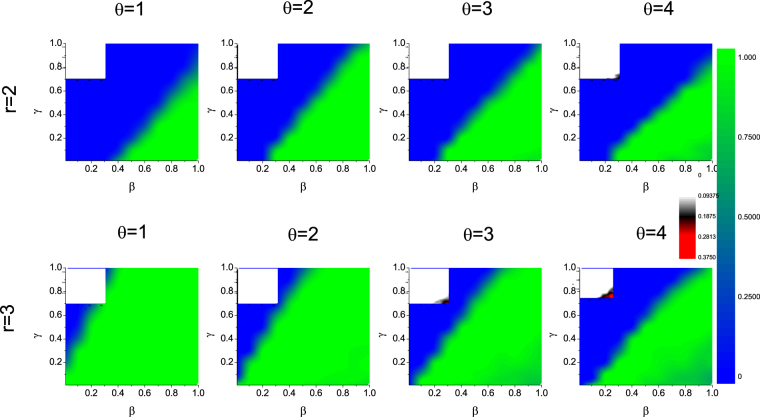
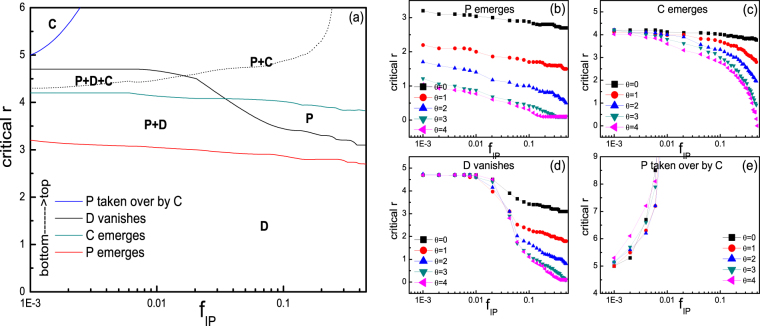
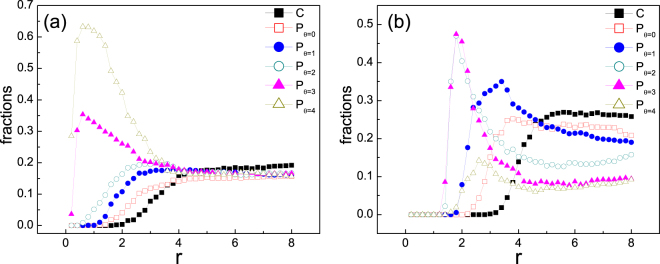
In explaining the pressing issue in biology and social sciences how cooperation emerges in a population of self-interested individuals, researchers recently pay intensive attentions to the role altruistic punishment plays. However, as higher-order cooperators, survival of punishers is puzzling due to their extra cost in regulating norm violators. Previous works have highlighted the importance of individual mobility in promoting cooperation. Yet its effect on punishers remains to be explored. In this work we incorporate this feature into modeling the behavior of punishers, who are endowed with a choice between leaving current place or staying and punishing defectors. Results indicate that optimal mobility level of punishers is closely related to the cost of punishing. For considerably large cost, there exists medium tendency of migration which favors the survival of punishers. This holds for both the direct competition between punishers and defectors and the case where cooperators are involved, and can also be observed when various types of punishers with different mobility tendencies fight against defectors simultaneously. For cheap punishment, mobility does not provide with punishers more advantage even when they are initially rare. We hope our work provide more insight into understanding the role individual mobility plays in promoting public cooperation.
Conflict of interest statement
The authors declare that they have no competing interests.
Figures
Similar articles
-
Symbiotic behaviour in the public goods game with altruistic punishment.J Theor Biol. 2021 Sep 7;524:110737. doi: 10.1016/j.jtbi.2021.110737. Epub 2021 Apr 28. J Theor Biol. 2021. PMID: 33930439
-
When is altruistic punishment useful in social dilemmas?Biosystems. 2018 Dec;174:60-62. doi: 10.1016/j.biosystems.2018.10.015. Epub 2018 Nov 2. Biosystems. 2018. PMID: 30391264
-
Overpunishing is not necessary to fix cooperation in voluntary public goods games.J Theor Biol. 2013 Jun 7;326:70-81. doi: 10.1016/j.jtbi.2012.11.034. Epub 2012 Dec 7. J Theor Biol. 2013. PMID: 23228364
-
Punishment and spite, the dark side of cooperation.Philos Trans R Soc Lond B Biol Sci. 2010 Sep 12;365(1553):2635-50. doi: 10.1098/rstb.2010.0146. Philos Trans R Soc Lond B Biol Sci. 2010. PMID: 20679108 Free PMC article. Review.
-
Punishment: one tool, many uses.Evol Hum Sci. 2019 Nov 12;1:e12. doi: 10.1017/ehs.2019.12. eCollection 2019. Evol Hum Sci. 2019. PMID: 37588410 Free PMC article. Review.
Cited by
-
Knowing the past improves cooperation in the future.Sci Rep. 2019 Jan 22;9(1):262. doi: 10.1038/s41598-018-36486-x. Sci Rep. 2019. PMID: 30670732 Free PMC article.
-
Seasonal payoff variations and the evolution of cooperation in social dilemmas.Sci Rep. 2019 Aug 29;9(1):12575. doi: 10.1038/s41598-019-49075-3. Sci Rep. 2019. PMID: 31467364 Free PMC article.
References
-
- Henrich, J. & Henrich, N. Why Humans Cooperate: A Cultural and Evolutionary Explanation (Oxford University Press, Oxford, 2007).
-
- Bowles, S. & Gintis, H. A Cooperative Species: Human Reciprocity and Its Evolution (Princeton University Press, Princeton, NJ, 2011).
Publication types
MeSH terms
LinkOut - more resources
Full Text Sources
Other Literature Sources
