. 2017 Oct 24;4(5):ENEURO.0241-17.2017.
doi: 10.1523/ENEURO.0241-17.2017. eCollection 2017 Sep-Oct.

Action Monitoring Cortical Activity Coupled to Submovements

Affiliations

Action Monitoring Cortical Activity Coupled to Submovements

Michael Pereira et al. eNeuro. .

Abstract

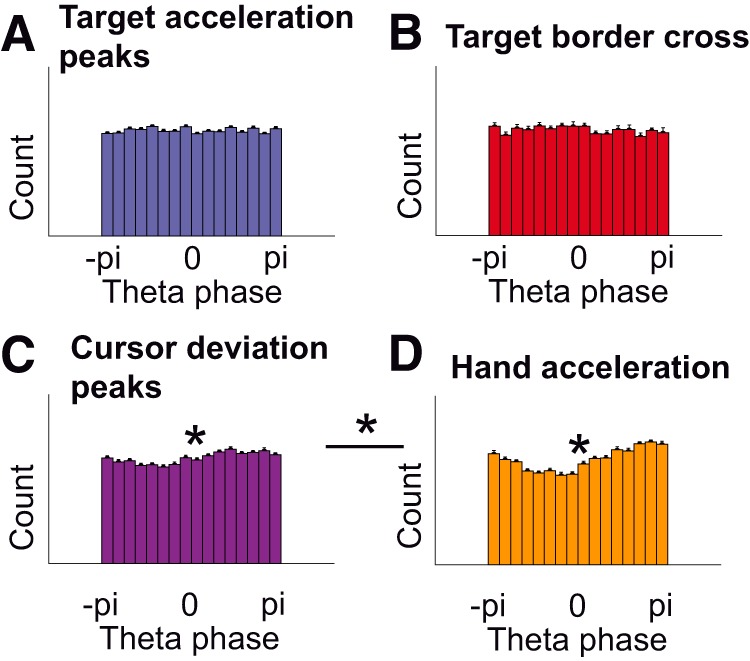
Numerous studies have examined neural correlates of the human brain's action-monitoring system during experimentally segmented tasks. However, it remains unknown how such a system operates during continuous motor output when no experimental time marker is available (such as button presses or stimulus onset). We set out to investigate the electrophysiological correlates of action monitoring when hand position has to be repeatedly monitored and corrected. For this, we recorded high-density electroencephalography (EEG) during a visuomotor tracking task during which participants had to follow a target with the mouse cursor along a visible trajectory. By decomposing hand kinematics into naturally occurring periodic submovements, we found an event-related potential (ERP) time-locked to these submovements and localized in a sensorimotor cortical network comprising the supplementary motor area (SMA) and the precentral gyrus. Critically, the amplitude of the ERP correlated with the deviation of the cursor, 110 ms before the submovement. Control analyses showed that this correlation was truly due to the cursor deviation and not to differences in submovement kinematics or to the visual content of the task. The ERP closely resembled those found in response to mismatch events in typical cognitive neuroscience experiments. Our results demonstrate the existence of a cortical process in the SMA, evaluating hand position in synchrony with submovements. These findings suggest a functional role of submovements in a sensorimotor loop of periodic monitoring and correction and generalize previous results from the field of action monitoring to cases where action has to be repeatedly monitored.

Keywords: EEG; error; kinematics; monitoring; submovements; supplementary motor area.


Figures

None
Graphical abstract
Figure 1.
Figure 1.
Cursor deviation and hand kinematics (submovements). A, Experimental setup and definition of cursor deviation. Subjects used a mouse cursor (a typical arrow) to track a target (red circle) moving on a computer screen along a visible trajectory. Cursor deviation was defined as the cursor’s position relative to the position of the target along the tangent to the target’s direction. Perpendicular deviation was defined as the deviation relative to the tangent. B, Distribution of cursor deviations around the target (white circle), averaged across subjects. The lower curve corresponds to the distribution of the cursor deviation used in the rest of the manuscript. The left (dashed) curve corresponds to the perpendicular deviation. Red vertical lines indicate target borders. C, Distribution of the time needed to correct cursor deviations: from the time the cursor left the target area to the time it went back in, averaged across subjects. D, Average hand acceleration profile, time-locked to submovements for tracking (yellow trace) and for spontaneous tracing (green trace), averaged across subjects. E, Distribution of the magnitude of hand acceleration peaks for tracking (yellow trace) and spontaneous tracing (green trace), averaged across subjects. F, Distribution of time intervals between submovements for tracking (yellow trace) and spontaneous tracing (green trace), averaged across subjects. G, Probability of time intervals relative to a random (Poisson) process for two types of events: submovements (yellow trace) and cursor leaving the target area (red trace). H, An example of 5 s of tracking. The target is depicted by red circles shown every 500 ms (a-j). The dashed red trace shows the trajectory of the target, moving from a to j. The corresponding cursor positions are depicted by black dots. I, Hand speed (orange trace), hand acceleration (yellow trace), and cursor deviation (dark red trace) for the 5 s depicted in H. Peaks selected by the peak selecting algorithm are depicted by black triangles. Horizontal red lines show target borders. Vertical dashed lines correspond to target positions in H.
Figure 2.
Figure 2.
ERP time-locked to submovements A, The ERP time-locked to submovements for the tracking (cyan trace) conditions, averaged across subjects. The ERP showed a significant trough localized in the medial frontal gyrus (right inset). Significant portions of the ERP are shown in black (p < 0.01, Bonferroni corrected). B, The ERP time-locked to hand acceleration for the spontaneous (green trace) and viewing (magenta trace) conditions, averaged across subjects. During the spontaneous condition, the ERP showed a significant trough (black segment, p < 0.01, Bonferroni corrected), localized in the left (contralateral) precentral gyrus. The ERP for different directions of the target (orange for north, blue for east, purple for south and yellow for west; see inset) can be found in Extended Data Figure 2-1. No discernible differences in ERP amplitude were observed.
Figure 3.
Figure 3.
Latency of the sampling of cursor deviation. A, Average profile of the ERP (cyan trace) and cursor deviation (red trace), time-locked to hand acceleration peaks. The upward pointing arrow depicts one potential sampling latency of the cursor deviation, possibly influencing the amplitude of ERP (gray box). B, Averaged single-epoch mean amplitude (FCz electrode) as a function of the cursor deviation (vertical axis) and the sampling latency of the cursor deviation relative to the submovement (horizontal axis). The largest trough (depicted by a red asterisk) was observed for the cursor markedly lagging behind the target (negative cursor deviation) before the acceleration peak. The black trace shows portions of the map corresponding to ERP amplitudes significantly different from zero across subjects (p < 0.01, Bonferroni corrected). The horizontal black lines represent the target borders. C, The SD of the ERP amplitudes across cursor deviation. The maximum value, averaged across subjects (thick red vertical bar) of the minimum single-trial amplitude, was estimated to be 0.11 s before the submovement. The two thin red vertical bars represent the SEM of this estimation.
Figure 4.
Figure 4.
Modulation of the ERP by cursor deviation. A, Colored traces correspond to different average cursor deviation time courses leading to ERPs in C for the tracking condition. Red traces correspond to deviations occurring behind the target and cyan traces correspond to deviations occurring ahead of the target. The same coding scheme was used throughout the figure. The vertical gray line corresponds to the sampling of the error at 0.11 s before the submovement, leading to the modulation of the ERP. Horizontal black lines indicate the target’s center and borders. B, Average hand submovement kinematics (acceleration) corresponding to cursor deviations in A and ERPs in C for the tracking condition. Increasing lagging of the cursor behind the target led to increasing submovement kinematics (to catch up with the target). The panel on the upper right shows the relation between cursor deviation and submovement peak acceleration. The results of the matching procedure can be found in Extended Data Figure 4-1 with colored traces showing kinematic profiles of submovements from the tracking condition and dashed black traces corresponding to matched submovements from the spontaneous condition. Panels are ordered from left to right in order of increasing cursor deviation. C, ERP (FCz) for different cursor deviations (and submovement kinematics) showed increasing amplitudes for increasing lag of the cursor behind the target (negative values). D, Amplitude of the ERP troughs (FCz) from C against cursor deviation at 0.11 s presubmovement. The colored dots correspond to ERP amplitudes from the tracking condition and were correlated with cursor deviation (r2 = 0.97, p < 0.001). The black squares correspond to ERP amplitudes from the spontaneous condition and also linearly increased (r2 = 0.63, p = 0.034). The amplitudes were computed by averaging the ERP in time over a 0.1-s window centered on the ERP trough. More negative values correspond to larger troughs. Whiskers denote SEM across subjects. The asterisks show significant differences between the tracking and the spontaneous condition (p < 0.05, Bonferroni corrected). Vertical black lines indicate the target’s border. For the tracking condition, the slope of this linear fit was strongest over the frontal midline (inset).
Figure 5.
Figure 5.
Modulation of the ERP by cursor deviation in the tracking task while controlling for kinematics. A, Colored traces represent average cursor deviation time courses leading to ERPs in C. Red traces correspond to deviations occurring behind the target and cyan traces correspond to deviations occurring ahead of the target. The same coding scheme was used throughout the figure. The vertical gray line corresponds to the sampling of the error at 0.11 s before the submovement leading to the modulation of the ERP. Horizontal black lines indicate the target’s center and borders. B, Matched average submovement kinematics (acceleration) corresponding to cursor deviations in A and ERPs in C. C, Average ERPs (FCz) for different cursor deviations during the tracking task (colored traces) for matched hand kinematics. The size of the ERP increased with increasing lag of the cursor behind the target (negative values). D, Amplitude of the ERP troughs (FCz) from C correlating to cursor deviation at 0.11 s presubmovement (r 2 = 0.95, p < 0.001). The amplitudes were computed by averaging the ERP in time over a 0.1-s window centered on the ERP’s trough. Negative values correspond to larger troughs. Whiskers denote SEM across subjects. Vertical black lines indicate the target’s border. The peak-to-peak ERP amplitudes for the control experiment with constant target speed are in Extended Data Figure 5-1A. Vertical black lines indicate target borders. Kinematics (top) and cursor deviation profiles corresponding to the ERP amplitudes are in Extended Data Figure 5-1B.
Figure 6.
Figure 6.
EEG phase-locking for different behavioral events. A, No significant phase modulation was found for target acceleration peaks (zPLV = 0.09 ± 0.21, p = 0.67, t(22) = 0.43, one-sample t test). Each histogram bar corresponds to the count of corresponding EEG phases at target acceleration peaks. B, No significant phase modulation was found when the cursor left the target area (zPLV = 0.42 ± 0.36, p = 0.25, t(22) = 1.17). C, A weak but significant phase modulation was found for peaks in the Euclidian distance between cursor and target (zPLV = 1.50 ± 0.33, p = 0.00014, t(22) = 4.60). D, The largest (significant) phase modulation was found for submovements (peaks in hand acceleration; zPLV = 5.26 ± 0.64, p < 0.001, t(22) = 8.18). This modulation was significantly stronger than for peaks in the Euclidian distance between the cursor and the target (C; p < 0.001, t(22) = 6.86, paired t test).

Similar articles

Cited by

References

    1. Archambault PS, Caminiti R, Battaglia-Mayer A (2009) Cortical mechanisms for online control of hand movement trajectory: the role of the posterior parietal cortex. Cereb Cortex 19:2848–2864. 10.1093/cercor/bhp058 - DOI - PubMed
    1. Bonini F, Burle B, Liégeois-Chauvel C, Régis J, Chauvel P, Vidal F (2014) Action monitoring and medial frontal cortex: leading role of supplementary motor area. Science 343:888–891. 10.1126/science.1247412 - DOI - PubMed
    1. Busch NA, VanRullen R (2010) Spontaneous EEG oscillations reveal periodic sampling of visual attention. Proc Natl Acad Sci USA 107:16048–16053. 10.1073/pnas.1004801107 - DOI - PMC - PubMed
    1. Carmena JM, Lebedev MA, Crist RE, O’Doherty JE, Santucci DM, Dimitrov DF, Patil PG, Henriquez CS, Nicolelis MAL (2003) Learning to control a brain-machine interface for reaching and grasping by primates. PLoS Biol 1:193–208. - PMC - PubMed
    1. Cavanagh JF, Frank MJ (2014) Frontal theta as a mechanism for cognitive control. Trends Cogn Sci 18:414–421. 10.1016/j.tics.2014.04.012 - DOI - PMC - PubMed

Publication types

LinkOut - more resources