Review
. 2017 Nov 27;46(23):7438-7468.
doi: 10.1039/c7cs00316a.

Engineering of inorganic nanoparticles as magnetic resonance imaging contrast agents

Affiliations
Review

Engineering of inorganic nanoparticles as magnetic resonance imaging contrast agents

Dalong Ni et al. Chem Soc Rev. .

Abstract

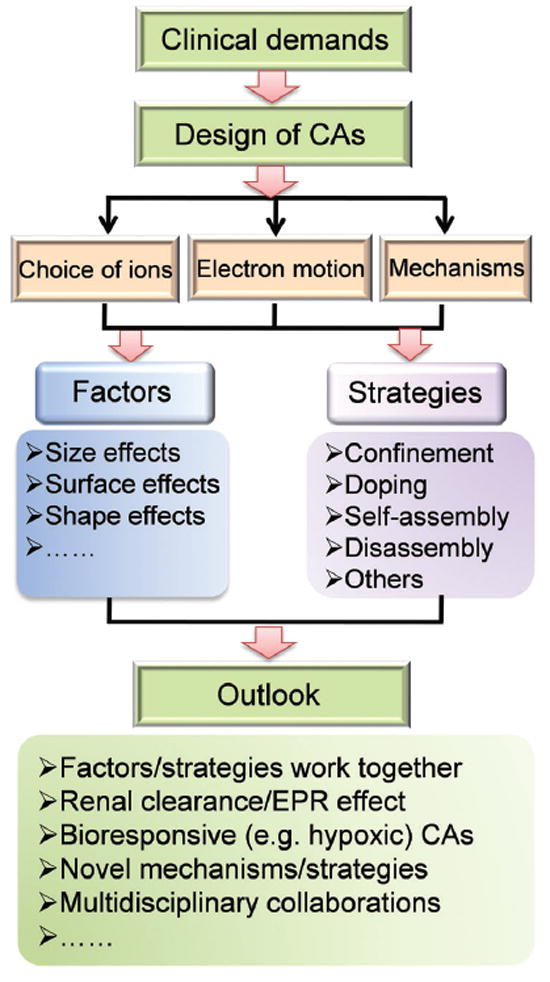
Magnetic resonance imaging (MRI) is a highly valuable non-invasive imaging tool owing to its exquisite soft tissue contrast, high spatial resolution, lack of ionizing radiation, and wide clinical applicability. Contrast agents (CAs) can be used to further enhance the sensitivity of MRI to obtain information-rich images. Recently, extensive research efforts have been focused on the design and synthesis of high-performance inorganic nanoparticle-based CAs to improve the quality and specificity of MRI. Herein, the basic rules, including the choice of metal ions, effect of electron motion on water relaxation, and involved mechanisms, of CAs for MRI have been elucidated in detail. In particular, various design principles, including size control, surface modification (e.g. organic ligand, silica shell, and inorganic nanolayers), and shape regulation, to impact relaxation of water molecules have been discussed in detail. Comprehensive understanding of how these factors work can guide the engineering of future inorganic nanoparticles with high relaxivity. Finally, we have summarized the currently available strategies and their mechanism for obtaining high-performance CAs and discussed the challenges and future developments of nanoparticulate CAs for clinical translation in MRI.


Conflict of interest statement

Conflicts of interest

There are no conflicts to declare.

Figures

Fig. 1
Fig. 1
Inner sphere, secondary sphere, and outer sphere can influence relaxation rates of MRI CAs.
Fig. 2
Fig. 2
Factors influencing relaxation of MRI CAs: size, surface, and shape effects at the nanoscale.
Fig. 3
Fig. 3
(a) TEM images of oleate-stabilized NaGdF4 NPs of varied particle sizes (scale bar is the same for all images). (b) Plots of 1/T1 versus Gd3+ concentration for varied NaGdF4 NPs in water (1.5 T). Reproduced with permission from ref. . Copyright 2011, American Chemical Society. (c) R1 relaxivity of aqueous solutions containing NaGdF4 NPs of different sizes or Gd–DTPA with different concentrations of Gd3+. Reproduced with permission from ref. . Copyright 2013, American Chemical Society. (d) Magnetic resonance angiography of rabbits within 3 min after injection of ultra-small NaGdF4 nanodots or Magnevist. AA: abdominal aorta; IVC: inferior vena cava. (e) Transverse cross-sectional images of rabbit atherosclerotic plaques before and after injection of ultra-small NaGdF4 nanodots or Magnevist at the same dosage (13 mg Gd per kg). Reproduced with permission from ref. . Copyright 2014, Wiley-VCH.
Fig. 4
Fig. 4
(a) TEM images of MnO NPs of varied sizes (7, 15, 20, and 25 nm) in water. (b) T1-weighted MR image of MnO NPs in a 3.0 T clinical MRI system. Reproduced with permission from ref. . Copyright 2007, Wiley-VCH. Size-dependent T1-weighted MR images and relaxivities of water-dispersible spherical (c) and tetrahedral (d) Mn3O4 NPs at varied Mn2+ concentrations. (e) The r1 and r2 values and r2/r1 ratios of Mn3O4 MPs from c and d. Reproduced with permission from ref. . Copyright 2012, Wiley-VCH.
Fig. 5
Fig. 5
(a) Field-dependent magnetization curves at 300 K for iron oxide NPs of varied sizes. (b) Description of spin canting effect (canting layer = 0.9 nm) in iron oxide NPs of varied sizes. Red and black colors represent magnetic cores and magnetically disordered shells. (c) Plots of 1/T1 over concentration of iron oxide NPs of 3 nm and 12 nm diameter. (d) T1-weighted MR images of MCF-7 cell pellets after 24 h incubation with iron oxide NPs of 3 nm and 12 nm in diameters. Reproduced with permission from ref. . Copyright 2011, American Chemical Society. (e) T1-weighted magnetic resonance angiography (MRA) of a mouse injected with ultra-small iron oxide NPs at 7 T. (f) Five different perspectives of MRA images, which were extracted from a 3D scan, at 4 minutes post-injection. Reproduced with permission from ref. . Copyright 2017, National Academy of Sciences.
Fig. 6
Fig. 6
(a) TEM images of iron oxide NPs of 4, 6, 9, and 12 nm. (b) Upper panel: Size-dependent T2-weighted MR images of iron oxide NPs in aqueous solution at 1.5 T; lower panel: size-dependent changes from red to blue in color-coded MR images based on T2 values. (c) The magnetization of iron oxide NPs measured by a SQUID magnetometer. (d) Size-dependent r2 values of iron oxide NPs. Reproduced with permission from ref. . Copyright 2005, American Chemical Society. (e) Size-dependent T2-weighted MR images of PVP-coated iron oxide NPs in aqueous solution with various concentrations at 7 T. (f) Plots of 1/T2 against Fe concentration of PVP-coated iron oxide NPs. (g) Size-dependent r2 values of iron oxide NPs. Reproduced with permission from ref. . Copyright 2010, American Chemical Society.
Fig. 7
Fig. 7
(a) r1 and (b) r2 values of NaDyF4 NPs (three different sizes) at 3 and 9.4 T. (c) (i) TEM images of 5.4, 9.8, and 20.3 nm NaDyF4 NPs, (ii) phantom MR images of NPs at 1.0 mM Dy3+ concentration at 9.4 T. Reproduced with permission from ref. . Copyright 2012, American Chemical Society. (d) Schematic of the effect of size and a coating layer on the relaxation of NaDyF4 and NaHoF4 NPs. Reproduced with permission from ref. . Copyright 2016, American Chemical Society. (e) T2-weighted MR images of NaHoF4 NPs of varied sizes in aqueous solutions at 7.0 T. (f) r2 values obtained for varied sized NaHoF4 NPs at 1.5 T, 3.0 T, and 7.0 T. (g) Simulated curves of B2φ from Curie contribution versus diffusion correlation time (τD), which is related to NP size. Reproduced with permission from ref. . Copyright 2016, Elsevier Ltd.
Fig. 8
Fig. 8
(a) A TEM image of ultra-small oleate-stabilized NaGdF4 NPs of 3 nm diameter. (b) A representative negative-stained TEM image of DSPE– PEG-coated NP micelles. Inset: Schematic of a NaGdF4 NP confined within a DSPE–PEG micelle. (c) r1 values of a clinical MRI contrast agent (Dotarem) and the compact NP micelles at low (1.41 T) and high (7 T) fields. (d) Schematic and (e) r1 values of NaGdF4 NPs (3 nm) confined within DSPE–PEG micelles with varied PEG chain length. (f) Schematic and (g) r1 values of NaGdF4 NPs confined within DSPE–PEG micelles with variable core NP size (3–5 nm). Reproduced with permission from ref. . Copyright 2016, American Chemical Society. (h) r1 and r2 values of NaGdF4 NPs coated with different ligands measured at 0.5 T. (i) Schematic of the strong hydrogen-bonding capacity of PAA to water molecules to improve r1. Reproduced with permission from ref. . Copyright 2017, American Chemical Society.
Fig. 9
Fig. 9
(a) Left panel: Chemical structures of PEGs used for exchanging the hydrophobic ligands of 3.6 nm(S: small) and 10.9 nm(L: large) iron oxide NPs; right panel: TEM images of resulting PEGylated NPs (scale bars: 50 nm); insets: photographs of aqueous solutions of PEGylated NPs at an equal Fe concentration of 20 mM. Comparison of (b) r2 and (c) r1 values of different kinds of PEGylated NPs. Reproduced with permission from ref. . Copyright 2014, Wiley-VCH. (d) Left panel: Schematic of three transfer approaches: ligand exchange of oleic acid with a water-soluble polymer (top), coating of individual NPs with the amphiphilic polymer (middle), and embedding into lipid micelles (bottom). Reproduced with permission from ref. . Copyright 2007, American Chemical Society. (e) Schematic of a nanoparticle with 4.8 nm iron oxide core and DSPE-PEG1000 coating. (f) T2 relaxivity of iron oxide NPs at a constant iron concentration. (g) T2 relaxivity of NPs on a per-particle basis. Iron oxide NPs with two core sizes, 5 and 14 nm, and five PEG sizes, 550, 750, 1000, 2000, and 5000 Da, were evaluated. Reproduced with permission from ref. . Copyright 2010, American Chemical Society.
Fig. 10
Fig. 10
(a) Schematic illustration of coating UCNPs with dSiO2 and mSiO2 shells. (b) TEM images of (b) UCNP@mSiO2 and (c) UCNP@dSiO2 with varied shell thicknesses. Scale bar: 20 nm. (d) The plot of r1 and r2 versus mSiO2 shell thickness. (e) The plot of r1 and r2 versus dSiO2 shell thickness. Reproduced with permission from ref. . Copyright 2014, Wiley-VCH. (f) Schematic of the synthesis of HMnO@mSiO2 NPs and labeling of mesenchymal stem cells. HMnO denotes hollow structure manganese oxide NPs. (g) TEM images and r1 value of MnO–lipid PEG, MnO@dSiO2, HMnO@mSiO2 NPs. (h) No MRI contrast enhancement (red arrow) was detected in mice transplanted with unlabeled mesenchymal stem cells into the brain, whereas hyperintense signals (green arrows) were detected in mice transplanted with HMnO@mSiO2-labeled mesenchymal stem cells, which were still visible 14 days after injection in the brain. The scheme and figures (with minor modifications) are licensed under the ACS AuthorChoice license. Reproduced with permission from ref. . Copyright 2011, American Chemical Society.
Fig. 11
Fig. 11
HRTEM images of (a) FePt@Fe2O3 yolk–shell NPs, (b) Pt@Fe2O3 yolk–shell NPs, (c) FePt@Fe3O4 core–shell NPs obtained by the seed-growth method, and (d) γ-Fe2O3 hollow NPs. (e) Room-temperature field-dependent magnetization measurements of different NPs. Reproduced with permission from ref. . Copyright 2008, American Chemical Society. (f) TEM image of 16 nm iron/iron oxide core/shell NPs. (g) HRTEM image showing a core of single-crystal a-Fe and a shell consisting of multiple domains of iron oxide. (h) T2-weighted MR images at 9.4 T of iron/iron oxide core/shell NPs and iron oxide NPs. (i) r2 values of the core/shell and oxide NPs determined from the same samples as in (h). Reproduced with permission from ref. . Copyright 2011, Wiley-VCH.
Fig. 12
Fig. 12
TEM images and schematic of Gd-free core (a, f and k) and core@NaGdF4 with varied NaGdF4 shell thicknesses of 0.2 nm (b, g, and l), 0.7 nm (c, h and m), 2.0 nm (d, i, and n), and 3.7 nm (e, j, and o). Yellow dots in l, m, n, and o represent Gd3+ ions. The r1 values of silica-coated water-soluble core@NaGdF4 NPs of various sizes are shown in the middle of the schematic illustrations. Reproduced with permission from ref. . Copyright 2011, Wiley-VCH.
Fig. 13
Fig. 13
Shape effects on T2 contrast. (a) TEM image (scale bar, 100 nm) and (b) higher magnification TEM image (scale bar, 20 nm) of octapod-30 NPs of uniform four-armed iron oxide NPs. (c) A cartoon showing octapod and spherical iron oxide NPs. With the same geometric core volumes, the octapod NPs have much larger effective volumes (radius, R) than the spherical NPs (radius, r). (d) Comparison of r2 values of different iron oxide NPs. (e) In vivo sagittal MR images and (f) quantification of signal-to-background ratio (*P = 0.01) of orthotopic liver tumor models at 0, 0.5, 1, 2 and 4 h after intravenous injection of octapod-30 and spherical-16 iron oxide NPs. Reproduced with permission from ref. . Copyright 2013, Nature Publishing Group. (g and h) Top: TEM images of 16 nm iron oxide NPs (g) and 50 nm NRs (h). Bottom: Local magnetic field generated by the NRs and spherical Fe3O4 NPs of equivalent material volumes under an applied magnetic field of 3 T. (i) Schematic of the quantum mechanical outer sphere model of Fe3O4 NPs and NRs of the same material volume. Reproduced with permission from ref. . Copyright 2015, Royal Society of Chemistry.
Fig. 14
Fig. 14
Effects of NP shape on T1 relaxivity. (a) Schematic showing r1 values of different kinds of MRI CAs including Gd3+ chelates, DNA–Gd@spheres, and DNA–Gd@stars. (b) NMRD profiles for water solutions of DNA–Gd@stars and DNA–Gd@spheres. (c) Simulated deconvolution of DNA–Gd@stars NMRD profiles into their inner, secondary, and outer sphere contributions. Reproduced with permission from ref. . Copyright 2015, American Chemical Society. (d) Schematic showing the dependence of relaxation on branch numbers of DNA–Gd@stars. Reproduced with permission from ref.. Copyright 2016, American Chemical Society.
Fig. 15
Fig. 15
Schematic of engineering strategies to obtain high-relaxivity CAs for efficient MRI contrast enhancement.
Fig. 16
Fig. 16
(a) Schematics showing (i) Magnevist (MAG), (ii) gadofullerenes (GF), and (iii) gadonanotubes (GNT) and cartoons showing Magnevist, GFs and GNTs entrapped within the porous structure of SiMPs. (b) r1 values of six MRI CA nanostructures in comparison with corresponding Gd-based CAs at 1.41 T and 37 °C. Reproduced with permission from ref. . Copyright 2010, Nature Publishing Group. (c) Schematic of Gd2O3 confined in MSNs. Reproduced with permission from ref. . Copyright 2016, Royal Society of Chemistry. (d) TEM image of hybrid mesoporous composite nanocapsules (HMCNs). Inset: STEM image with scale bar = 100 nm. (e) Relaxivity of an aqueous suspension of HMCNs after 4 h of soaking in buffer solutions at pH 5.0 and 7.4 at 37 °C. Reproduced with permission from ref. . Copyright 2012, Elsevier Ltd.
Fig. 17
Fig. 17
(a) TEM images, mass magnetization values, magnetic spin structures, magnetic moments, T2-weighted images and colormaps of MnFe2O4, FeFe2O4, CoFe2O4, and NiFe2O4 NPs. Reproduced with permission from ref. . Copyright 2007, Nature Publishing Group. (b) Plots of r2 versus Zn2+ doping level in (ZnxM1−x)Fe2O4 (M = Mn2+, Fe2+) NPs at 4.5 T. (c) Comparison of r2 values of NPs, showing that Zn2+ doped NPs have significantly enhanced MRI contrast when compared to conventional iron oxide NPs. Reproduced with permission from ref. . Copyright 2009, Wiley-VCH.
Fig. 18
Fig. 18
(a) Schematic of intracellular caspase-3/7-triggered aggregation of Fe3O4@1 NPs. (b) Plots of 1/T2 versus metal concentration in the presence or absence of caspase-3/7. (c) In vivo T2-weighted coronal images of Fe3O4@1 NPs or Fe3O4@1-Scr NPs in saline or DOX-treated (i.e., apoptotic) mice in 0 h (top) or 3 h (bottom) post injection. To make tumor apoptotic, about 8 mg kg−1 of doxorubicin (DOX) was injected intravenously, once every 4 days three times. Reproduced with permission from ref. . Copyright 2016, American Chemical Society. (d) Schematic of 99mTc-labeled Fe3O4 NPs and their responsiveness to GSH-triggering within the tumor microenvironment to form aggregates through inter-particle crosslinking reactions. (e) TEM images of the nonresponsive probe (left panel) and responsive probe (right panel) after being treated with GSH. (f) Temporal evolution of transverse relaxation rate R2 for both the responsive probe and nonresponsive control recorded on a 3.0 T MRI scanner during incubation with GSH (inset: T2-weighted images of probe solutions acquired at different incubation time points). Reproduced with permission from ref. . Copyright 2017, Wiley-VCH.
Fig. 19
Fig. 19
(a) Schematic of how a degradable polymermatrix is able to control the interaction of water molecules with Gd2O3 NPs (purple spheres). (b) Magnetic relaxivity of Gd2O3 NPs encapsulated in pH-responsive materials demonstrates a jump from neutral pH to mild acidity. (c) Increasing concentrations of H2O2 results in corresponding increases in the T1 relaxation rates of Gd2O3 NPs encapsulated in an H2O2-responsive polymer. Reproduced with permission from ref. . Copyright 2013, American Chemical Society.
Fig. 20
Fig. 20
(a) Schematic of the hybrid structure of PEGMnCaP. PEGMnCaP consists of a CaP-based core and a PEG shell. The Mn2+ ions are trapped in the CaP core. (b) r1 value of PEGMnCaP in physiological environments at different pH levels, with and without proteins (for example, HSA). (c) MR images of liver metastasis using 1 T MRI scanner after i.v. injection of PEGMnCaP NPs. Scale bar, 1 cm. (d) MR images of a hypoxic region within a C26 tumor at 1 T, 4 h after the i.v. injection of PEGMnCaP NPs. (e) Staining of tumor tissues with pimonidazole confirmed that the hypoxic regions (brown) are at the same location as the tumor regions with higher MRI contrast enhancement. Scale bar, 1 mm. Reproduced with permission from ref. . Copyright 2016, Nature Publishing Group. (f) Schematic of the disassembly of PEG/Mn–HMSNs through “manganese extraction” and release of Mn2+ component intracellularly. TEM images showing structural evolution of Mn–HMSNs after biodegradation at a GSH concentration of (g) 5.0 and (h) 10 mM at pH 5.0 for 48 h. (i) Plot of 1/T1 versus Mn concentration for PEG/Mn–HMSN solution at varied GSH concentrations and (j) at varied pH. Reproduced with permission from ref. . Copyright 2016, American Chemical Society.
Fig. 21
Fig. 21
(a) Schematic illustration showing the fabrication process of MnO2/DVDMS and the reaction in GSH solution or with H2O2 (pH 5.5). (b) Plot of 1/T1 versus Mn concentration for MnO2/DVDMS (black line), MnO2/DVDMS + GSH (red line), and MnO2/DVDMS + H2O2/H+ (blue line) solutions. (c) T1-weighted MR images before and after injection of MnO2/DVDMS. (d) TEM images of MCF-7 tumor sections at 24 h after injection of MnO2/DVDMS. Reproduced with permission from ref. . Copyright 2017, Wiley-VCH. (e) UV-vis-NIR absorption spectra and (f) plot of 1/T1 versus Gd3+ concentration of PEG–NaxGdWO3 nanorods after oxidization with H2O2 for varied time periods: 1#: 0 h; 2#: 0.5 h; 3#: 1 h; 4#: 3 h. (g) Schematic of the affinity of oxygen vacancies for oxygen atoms and its impact on the interaction between water molecules and Gd3+ ions. Reproduced with permission from ref. . Copyright 2017, American Chemical Society.
Fig. 22
Fig. 22
(a) Schematic representation of distance-dependent magnetic resonance tuning. (b) Schematic of a nanoscale ruler that shows a variable T1 MRI signal, dependent on the separation distance between the paramagnetic enhancer (Gd-DOTA) and superparamagnetic quencher (i.e., 12 nm Zn0.4Fe2.6O4 particle). Lower panel: T1-weighted MR image and color map image of a solution containing the enhancer and quencher with varied separation distances. (c) A plot of r1 values versus separation distance. (d) Schematic of modular combinations for the preparation of distance-dependent magnetic resonance sensors, operated using three different modes of interactions (cleavage, binding, and conformational changes) and subsequent T1 MRI signal outputs. Reproduced with permission from ref. . Copyright 2017, Nature Publishing Group.
Fig. 23
Fig. 23
(a) Columns showing r2 values of iron oxide (IO) clusters, as well as the single IO-5 and IO-15 NPs. C1: clusters of 5 nm NPs only; C2: clusters of 15 nm NPs only; C3: clusters of mixed 5 nm NPs and 15 nm NPs. (b and c) TEM and high-resolution TEM images, as well as cartoons of clusters C6 (IO cubes) and C7 (IO nanoplates), respectively. (d) Columns showing r2 values of IO clusters C6 and C7, as well as the single IO cubes and plates. (e and f) Simulation models and calculated stray fields for clusters C6 and C7, respectively. Color bars represent log10(Hd), where Hd is the calculated stray field. Reproduced with permission from ref. . Copyright 2017, Nature Publishing Group.
Fig. 24
Fig. 24
Summary and outlooks of designing inorganic NPs for MRI.

References

    1. Cao Y, Depinho RA, Ernst M, Vousden K. Nat Rev Cancer. 2011;11:749. - PubMed
    1. Rudin M, Weissleder R. Nat Rev Drug Discovery. 2003;2:123. - PubMed
    1. Smith BR, Gambhir SS. Chem Rev. 2017;117:901. - PubMed
    1. Angelovski G. Angew Chem Int Ed. 2016;55:7038. - PubMed
    1. Lohrke J, Frenzel T, Endrikat J, Alves FC, Grist TM, Law M, Lee JM, Leiner T, Li K-C, Nikolaou K. Adv Ther. 2016;33:1. - PMC - PubMed

MeSH terms

LinkOut - more resources