

Immediate cortical adaptation in visual and non-visual areas functions induced by monovision
- PMID: 29071723
- PMCID: PMC5767693
- DOI: 10.1113/JP274896
Immediate cortical adaptation in visual and non-visual areas functions induced by monovision
Abstract
Key points: Monovision is an optical correction for presbyopes that consists of correcting one eye for far distance and the other for near distance, creating a superimposition of an in-focus with a blurred image. Brain adaptation to monovision was studied in unexperienced observers by measuring visual evoked potentials from 64-channels. The first clear effect of monovision on visual evoked potentials was the C1 amplitude reduction, indicating that the unilateral blurring induced by monovision reduces feed-forward activity in primary visual area. Monovision led also to an increased amplitude of the P1 and pP1 components, with the latter originating in prefrontal regions. This effect probably works as an attentional compensatory activity used to compensate for the degraded V1 signal.
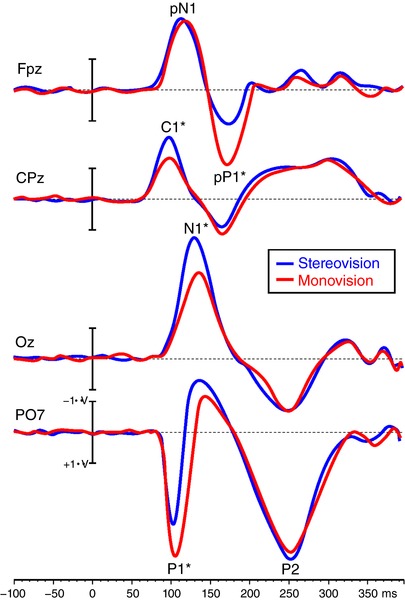
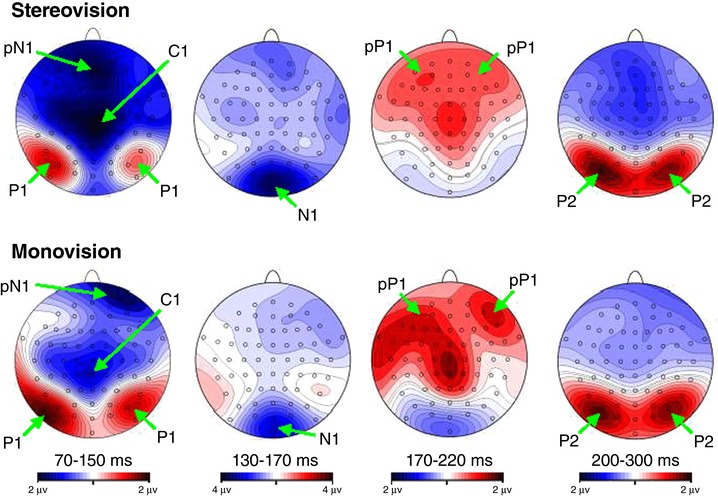
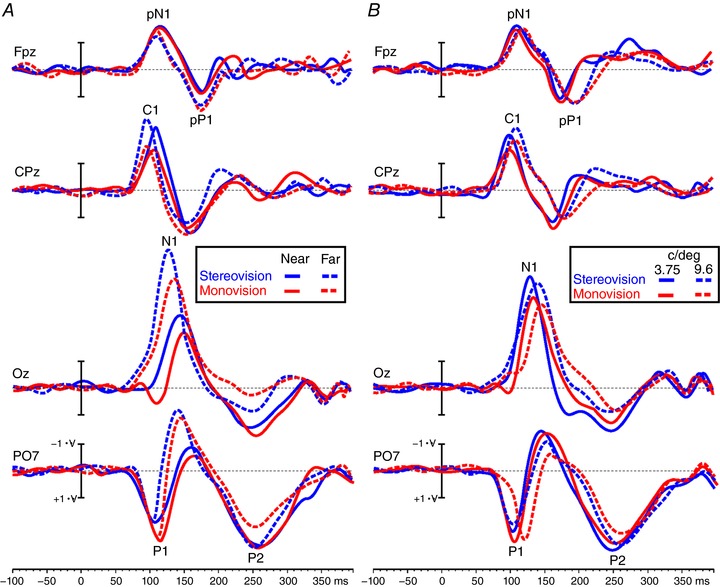
Abstract: A common and often successful option to correct presbyopia with contact lenses is monovision. This is an unbalanced correction across the two eyes where one eye is corrected for far vision and the other eye is corrected for near vision. Monovision is therefore a form of acquired anisometropia that causes a superimposition of an in-focus image with a blurred image. In spite of this visual anisometropia, monovision has been successfully used for many decadesl however the brain mechanism supporting monovision is not well understood. The present study aimed to measure the visual evoked potentials with a high-density electrode array (64-channel) in a group of presbyopes and to provide a detailed spatiotemporal analysis of the cortical activity after a short period of adaptation to monovision with contact lenses. When compared with a balanced eye near correction, monovision produced both a clear reduction of the earliest visual evoked potential components, the C1 and the N1, and an amplitude increase of the P1 and pP1. These results indicate that the unilateral blurring induced by wearing monovision contact lenses reduces feed-forward activity in the primary visual area and feedback activity in extrastriate areas (C1 and N1 reduction). Interestingly, other brain activities in both extrastriate visual areas (the P1 component) and in the anterior insula (the pP1 component) appear to compensate for this dysfunction, increasing their activity during monovision. These changes confirm the presence of fluid brain adaptation in visual and non-visual areas during monocular interferences.
Keywords: monovision; suppression; visual-evoked potential (VEP).
© 2017 The Authors. The Journal of Physiology © 2017 The Physiological Society.
Figures
Comment in
-
Presbyopia monovision correction and cortical adaptation.J Physiol. 2018 Jan 15;596(2):135. doi: 10.1113/JP275455. Epub 2017 Dec 28. J Physiol. 2018. PMID: 29152742 Free PMC article. No abstract available.
Similar articles
-
Comparison of suppression, stereoacuity, and interocular differences in visual acuity in monovision and acuvue bifocal contact lenses.Optom Vis Sci. 1999 Dec;76(12):832-7. doi: 10.1097/00006324-199912000-00018. Optom Vis Sci. 1999. PMID: 10612404
-
Peripheral visual acuity with monovision and other contact lens corrections for presbyopia.Optom Vis Sci. 1989 Jun;66(6):370-4. doi: 10.1097/00006324-198906000-00006. Optom Vis Sci. 1989. PMID: 2771322 Clinical Trial.
-
The role of sensory ocular dominance on through-focus visual performance in monovision presbyopia corrections.J Vis. 2015;15(6):17. doi: 10.1167/15.6.17. J Vis. 2015. PMID: 26024464 Free PMC article.
-
Success of monovision in presbyopes: review of the literature and potential applications to refractive surgery.Surv Ophthalmol. 1996 May-Jun;40(6):491-9. doi: 10.1016/s0039-6257(96)82015-7. Surv Ophthalmol. 1996. PMID: 8724641
-
Monovision: a review.Ophthalmic Physiol Opt. 2007 Sep;27(5):417-39. doi: 10.1111/j.1475-1313.2007.00488.x. Ophthalmic Physiol Opt. 2007. PMID: 17718882 Review.
Cited by
-
Short-term delay in neural response with multifocal contact lens might start at the retinal level.Doc Ophthalmol. 2022 Aug;145(1):37-51. doi: 10.1007/s10633-022-09870-2. Epub 2022 Apr 2. Doc Ophthalmol. 2022. PMID: 35364776
-
Visually evoked responses from the blind field of hemianopic patients.Neuropsychologia. 2019 May;128:127-139. doi: 10.1016/j.neuropsychologia.2017.10.008. Epub 2017 Oct 5. Neuropsychologia. 2019. PMID: 28987906 Free PMC article.
-
The effects of premium intraocular lenses on presbyopia treatments.Adv Ophthalmol Pract Res. 2022 Feb 23;2(1):100042. doi: 10.1016/j.aopr.2022.100042. eCollection 2022 May-Jun. Adv Ophthalmol Pract Res. 2022. PMID: 37846220 Free PMC article. Review.
-
Presbyopia monovision correction and cortical adaptation.J Physiol. 2018 Jan 15;596(2):135. doi: 10.1113/JP275455. Epub 2017 Dec 28. J Physiol. 2018. PMID: 29152742 Free PMC article. No abstract available.
-
Vision before and after scharioth macular lens implantation in patients with AMD: an electrophysiological study.Doc Ophthalmol. 2021 Aug;143(1):17-31. doi: 10.1007/s10633-020-09814-8. Epub 2021 Jan 3. Doc Ophthalmol. 2021. PMID: 33392893 Free PMC article.
References
-
- Amigo G, Fiorentini A, Pirchio M & Spinelli D (1978). Binocular vision tested with visual evoked potentials in children and infants. Invest Ophthalmol Vis Sci 17, 910–915. - PubMed
-
- Antona B, Barra F, Barrio A, Gutierrez A, Piedrahita E & Martin Y (2008). Comparing methods of determining addition in presbyopes. Clin Exp Optom 9, 313–318. - PubMed
-
- Apkarian PA, Nakayama K & Tyler CW (1981). Binocularity in the human visual evoked potential: facilitation, summation and suppression. Electroencephalogr Clin Neurophysiol 51, 32–48. - PubMed
-
- Back A, Grant T & Hine N (1992). Comparative visual performance of three presbyopic contact lens corrections. Optom Vis Sci 69, 474–480. - PubMed
Publication types
MeSH terms
LinkOut - more resources
Full Text Sources
Other Literature Sources
Medical