

Impaired excitation-contraction coupling in muscle fibres from the dynamin2R465W mouse model of centronuclear myopathy
- PMID: 29071728
- PMCID: PMC5730838
- DOI: 10.1113/JP274990
Impaired excitation-contraction coupling in muscle fibres from the dynamin2R465W mouse model of centronuclear myopathy
Abstract
Key points: Dynamin 2 is a ubiquitously expressed protein involved in membrane trafficking processes. Mutations in the gene encoding dynamin 2 are responsible for a congenital myopathy associated with centrally located nuclei in the muscle fibres. Using muscle fibres from a mouse model of the most common mutation responsible for this disease in humans, we tested whether altered Ca2+ signalling and excitation-contraction coupling contribute to muscle weakness. The plasma membrane network that carries the electrical excitation is moderately perturbed in the diseased muscle fibres. The excitation-activated Ca2+ input fluxes across both the plasma membrane and the membrane of the sarcoplasmic reticulum are defective in the diseased fibres, which probably contributes to muscle weakness in patients.
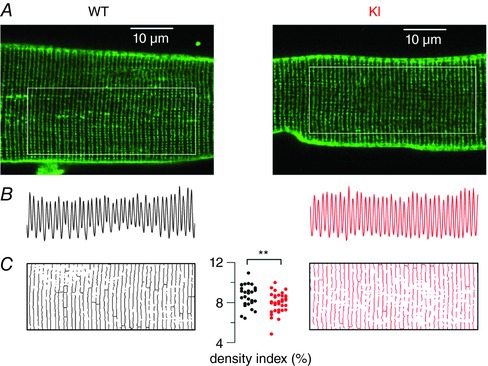
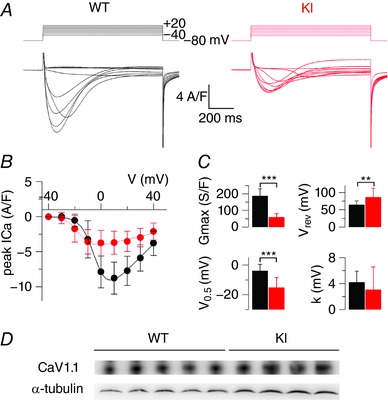
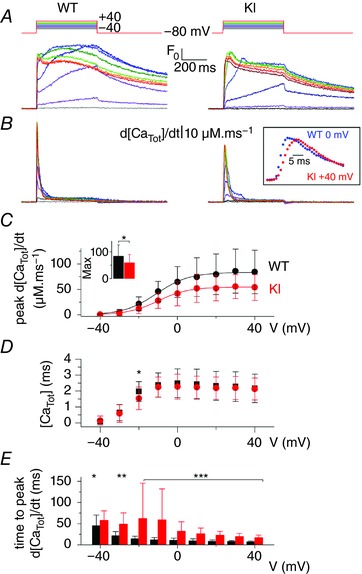
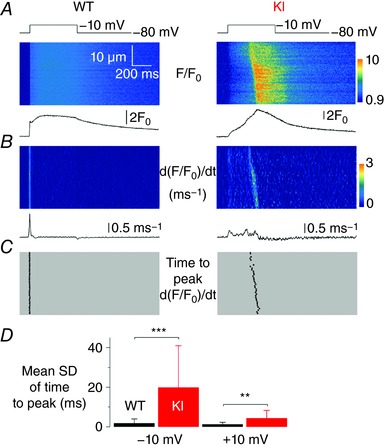
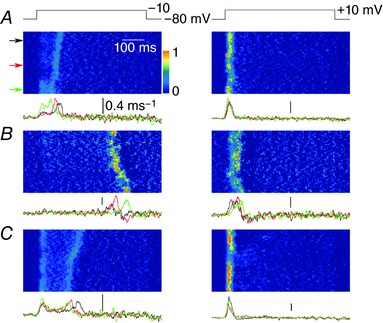
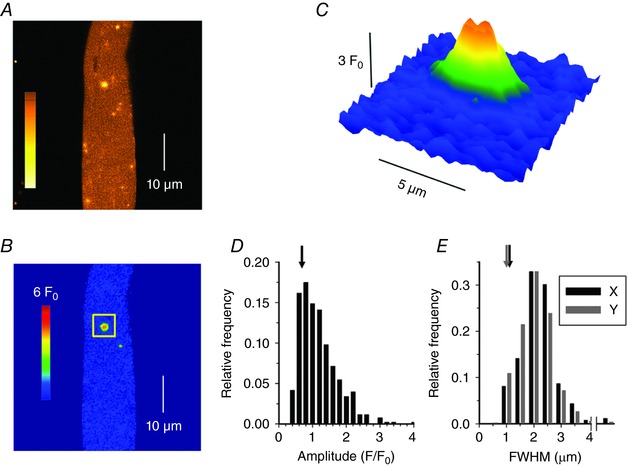
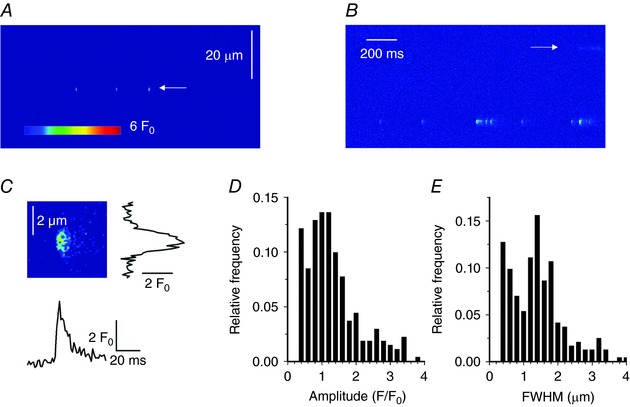
Abstract: Mutations in the gene encoding dynamin 2 (DNM2) are responsible for autosomal dominant centronuclear myopathy (AD-CNM). We studied the functional properties of Ca2+ signalling and excitation-contraction (EC) coupling in muscle fibres isolated from a knock-in (KI) mouse model of the disease, using confocal imaging and the voltage clamp technique. The transverse-tubule network organization appeared to be unaltered in the diseased fibres, although its density was reduced by ∼10% compared to that in control fibres. The density of Ca2+ current through CaV1.1 channels and the rate of voltage-activated sarcoplasmic reticulum Ca2+ release were reduced by ∼60% and 30%, respectively, in KI vs. control fibres. In addition, Ca2+ release in the KI fibres reached its peak value 10-50 ms later than in control ones. Activation of Ca2+ transients along the longitudinal axis of the fibres was more heterogeneous in the KI than in the control fibres, with the difference being exacerbated at intermediate membrane voltages. KI fibres exhibited spontaneous Ca2+ release events that were almost absent from control fibres. Overall, the results of the present study demonstrate that Ca2+ signalling and EC coupling exhibit a number of dysfunctions likely contributing to muscle weakness in DNM2-related AD-CNM.
Keywords: dynamin 2; excitation-contraction coupling; ryanodine receptor; sarcoplasmic reticulum Ca2+ release; skeletal muscle.
© 2017 The Authors. The Journal of Physiology © 2017 The Physiological Society.
Figures
Similar articles
-
Preserved Ca2+ handling and excitation-contraction coupling in muscle fibres from diet-induced obese mice.Diabetologia. 2020 Nov;63(11):2471-2481. doi: 10.1007/s00125-020-05256-8. Epub 2020 Aug 25. Diabetologia. 2020. PMID: 32840676
-
A centronuclear myopathy-dynamin 2 mutation impairs skeletal muscle structure and function in mice.Hum Mol Genet. 2010 Dec 15;19(24):4820-36. doi: 10.1093/hmg/ddq413. Epub 2010 Sep 21. Hum Mol Genet. 2010. PMID: 20858595
-
Phosphatidylinositol 3-kinase inhibition restores Ca2+ release defects and prolongs survival in myotubularin-deficient mice.Proc Natl Acad Sci U S A. 2016 Dec 13;113(50):14432-14437. doi: 10.1073/pnas.1604099113. Epub 2016 Nov 28. Proc Natl Acad Sci U S A. 2016. PMID: 27911767 Free PMC article.
-
Centronuclear Myopathy Caused by Defective Membrane Remodelling of Dynamin 2 and BIN1 Variants.Int J Mol Sci. 2022 Jun 3;23(11):6274. doi: 10.3390/ijms23116274. Int J Mol Sci. 2022. PMID: 35682949 Free PMC article. Review.
-
Common Pathogenic Mechanisms in Centronuclear and Myotubular Myopathies and Latest Treatment Advances.Int J Mol Sci. 2021 Oct 21;22(21):11377. doi: 10.3390/ijms222111377. Int J Mol Sci. 2021. PMID: 34768808 Free PMC article. Review.
Cited by
-
Calcium Homeostasis Is Modified in Skeletal Muscle Fibers of Small Ankyrin1 Knockout Mice.Int J Mol Sci. 2019 Jul 9;20(13):3361. doi: 10.3390/ijms20133361. Int J Mol Sci. 2019. PMID: 31323924 Free PMC article.
-
From Mice to Humans: An Overview of the Potentials and Limitations of Current Transgenic Mouse Models of Major Muscular Dystrophies and Congenital Myopathies.Int J Mol Sci. 2020 Nov 25;21(23):8935. doi: 10.3390/ijms21238935. Int J Mol Sci. 2020. PMID: 33255644 Free PMC article. Review.
-
SH3KBP1 promotes skeletal myofiber formation and functionality through ER/SR architecture integrity.EMBO Rep. 2025 Apr;26(8):2166-2191. doi: 10.1038/s44319-025-00413-9. Epub 2025 Mar 10. EMBO Rep. 2025. PMID: 40065183 Free PMC article.
-
DNM2 levels normalization improves muscle phenotypes of a novel mouse model for moderate centronuclear myopathy.Mol Ther Nucleic Acids. 2023 Jul 17;33:321-334. doi: 10.1016/j.omtn.2023.07.003. eCollection 2023 Sep 12. Mol Ther Nucleic Acids. 2023. PMID: 37547294 Free PMC article.
-
Mice with muscle-specific deletion of Bin1 recapitulate centronuclear myopathy and acute downregulation of dynamin 2 improves their phenotypes.Mol Ther. 2022 Feb 2;30(2):868-880. doi: 10.1016/j.ymthe.2021.08.006. Epub 2021 Aug 8. Mol Ther. 2022. PMID: 34371181 Free PMC article.
References
-
- Agrawal PB, Pierson CR, Joshi M, Liu X, Ravenscroft G, Moghadaszadeh B, Talabere T, Viola M, Swanson LC, Haliloğlu G, Talim B, Yau KS, Allcock RJ, Laing NG, Perrella MA & Beggs AH (2014). SPEG interacts with myotubularin, and its deficiency causes centronuclear myopathy with dilated cardiomyopathy. Am J Hum Genet 95, 218–226. - PMC - PubMed
-
- Al‐Qusairi L, Weiss N, Toussaint A, Berbey C, Messaddeq N, Kretz C, Sanoudou D, Beggs AH, Allard B, Mandel JL, Laporte J, Jacquemond V & Buj‐Bello A (2009). T‐tubule disorganization and defective excitation‐contraction coupling in muscle fibers lacking myotubularin lipid phosphatase. Proc Natl Acad Sci USA 106, 18763–18768. - PMC - PubMed
-
- Bitoun M, Maugenre S, Jeannet PY, Lacène E, Ferrer X, Laforêt P, Martin JJ, Laporte J, Lochmüller H, Beggs AH, Fardeau M, Eymard B, Romero NB & Guicheney P (2005). Mutations in dynamin 2 cause dominant centronuclear myopathy. Nat Genet 37, 1207–1209. - PubMed
-
- Bitoun M, Bevilacqua JA, Prudhon B, Maugenre S, Taratuto AL, Monges S, Lubieniecki F, Cances C, Uro‐Coste E, Mayer M, Fardeau M, Romero NB & Guicheney P (2007). Dynamin 2 mutations cause sporadic centronuclear myopathy with neonatal onset. Ann Neurol 62, 666–670. - PubMed
-
- Böhm J, Biancalana V, Dechene ET, Bitoun M, Pierson CR, Schaefer E, Karasoy H, Dempsey MA, Klein F, Dondaine N, Kretz C, Haumesser N, Poirson C, Toussaint A, Greenleaf RS, Barger MA, Mahoney LJ, Kang PB, Zanoteli E, Vissing J, Witting N, Echaniz‐Laguna A, Wallgren‐Pettersson C, Dowling J, Merlini L, Oldfors A, Bomme Ousager L, Melki J, Krause A, Jern C, Oliveira AS, Petit F, Jacquette A, Chaussenot A, Mowat D, Leheup B, Cristofano M, Poza Aldea JJ, Michel F, Furby A, Llona JE, Van Coster R, Bertini E, Urtizberea JA, Drouin‐Garraud V, Béroud C, Prudhon B, Bedford M, Mathews K, Erby LA, Smith SA, Roggenbuck J, Crowe CA, Brennan Spitale A, Johal SC, Amato AA, Demmer LA, Jonas J, Darras BT, Bird TD, Laurino M, Welt SI, Trotter C, Guicheney P, Das S, Mandel JL, Beggs AH & Laporte J (2012). Mutation spectrum in the large GTPase dynamin 2, and genotype‐phenotype correlation in autosomal dominant centronuclear myopathy. Hum Mutat 33, 949–959. - PMC - PubMed
Publication types
MeSH terms
Substances
LinkOut - more resources
Full Text Sources
Other Literature Sources
Molecular Biology Databases
Miscellaneous