. 2018 Mar;86 Suppl 1(Suppl Suppl 1):51-66.
doi: 10.1002/prot.25407. Epub 2017 Nov 7.

Assessment of contact predictions in CASP12: Co-evolution and deep learning coming of age

Affiliations

Assessment of contact predictions in CASP12: Co-evolution and deep learning coming of age

Joerg Schaarschmidt et al. Proteins. 2018 Mar.

Abstract

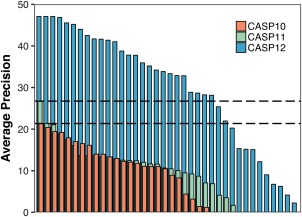
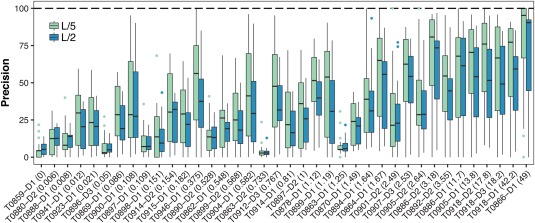
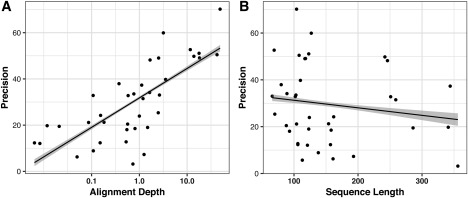
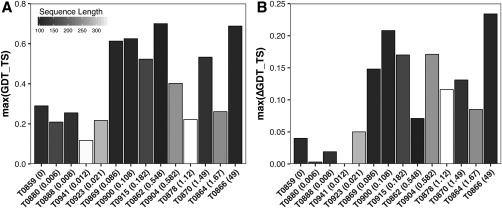
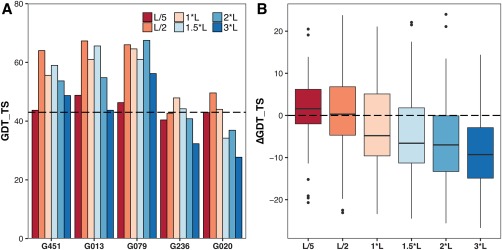
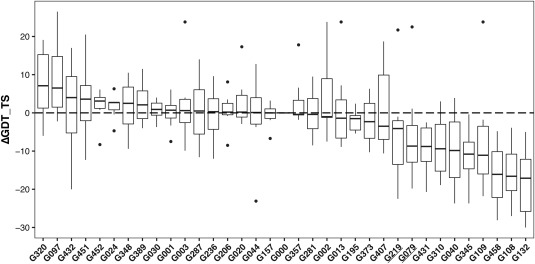
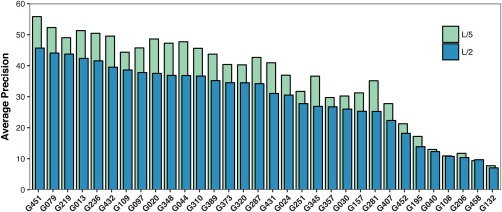
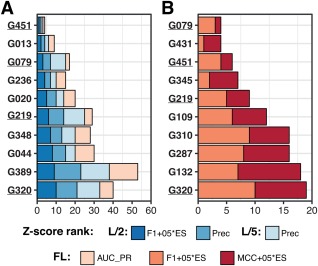
Following up on the encouraging results of residue-residue contact prediction in the CASP11 experiment, we present the analysis of predictions submitted for CASP12. The submissions include predictions of 34 groups for 38 domains classified as free modeling targets which are not accessible to homology-based modeling due to a lack of structural templates. CASP11 saw a rise of coevolution-based methods outperforming other approaches. The improvement of these methods coupled to machine learning and sequence database growth are most likely the main driver for a significant improvement in average precision from 27% in CASP11 to 47% in CASP12. In more than half of the targets, especially those with many homologous sequences accessible, precisions above 90% were achieved with the best predictors reaching a precision of 100% in some cases. We furthermore tested the impact of using these contacts as restraints in ab initio modeling of 14 single-domain free modeling targets using Rosetta. Adding contacts to the Rosetta calculations resulted in improvements of up to 26% in GDT_TS within the top five structures.

Keywords: CASP; co-variation; contact prediction; correlated mutations; de novo structure prediction; evolutionary coupling.


Figures

Figure 1
Figure 1
Color‐coded similarity matrix with a dendrogram on the left illustrating the similarity among different methods as judged by the number of common predicted contacts for all targets. The Jaccard distances used in the matrix are calculated on the union of the predicted top L/2 medium‐ and long‐range contacts for each pair of groups
Figure 2
Figure 2
Average precision of long range contacts on L/5 lists for free modeling targets in CASP10 (red), CASP11 (green), and CASP12 (blue) sorted by rank. Grey dashed lines indicate the levels of the best performing group in CASP10 and CASP11, respectively. While only one group showed a significantly better average precision than all the others in CASP 11 compared to CASP10, 26 groups showed an improved average precision in CASP12 compared to the best performing group of CASP11
Figure 3
Figure 3
The Precision distribution of medium and long range contacts within the L/2 (blue) and L/5 (green) set for increasing levels of alignment depth (specified in parentheses) in the FM category. Precisions above 90% were reached for almost half of the targets in the L/5 list
Figure 4
Figure 4
Plot of average precision by target for all groups versus (A) alignment depth (logarithmic scale) for the FM targets and (B) sequence length. While a correlation between precision and alignment depth can be observed (R 2∼0.56), there is no significant correlation between the sequence length and precision (R 2 ∼0.03)
Figure 5
Figure 5
Contact maps for two distinct predictions of L/2 medium and long range contacts for target T0866. Both predictions have an identical precision of 94.23% but a quite a different distribution of contacts with the true predictions (blue) on the left‐hand side spreading equally over the true contacts (green and blue) while on the right‐hand side the predicted contacts cluster in three different regions. This is reflected in a difference in Entropy score of 19.1 for BAKER_GREMLIN and 14.1 for Pcons‐net
Figure 6
Figure 6
Effect of alignment depth (x axis) and target length (gradient) on overall GDT_TS (A) and GDT_TS improvement (Δbest GDT_TS—B). An overall poor GDT_TS (A) is observed for the longest targets (white and light gray) regardless of alignment depth. The smallest changes in best GDT_TS are observed for the targets with an alignment depth below 0.05 (B)
Figure 7
Figure 7
Improvement in Modeling for target T0915; while the best model from the run without restraints (green) reaches a GDT_TS of only 35 (A) to the reference structure (white), the best model from the run with restraints (blue) reaches a GDT_TS of 52 (B)
Figure 8
Figure 8
The GDT_TS of contact‐guided Rosetta models built by us for different contact prediction groups as a function of the precision of underlying contact prediction on three representative targets—T0866, T0904 and T0941. The tertiary structure predictions were built separately for six lengths of contact lists (0.2–3 L) used to guide the modeling. Points in the graph represent the highest GDT_TS score within the top five structures built for each contact prediction group. The best GDT_TS of the Top five models without contacts is indicated by the dashed vertical line. In general, the best GDT_TS correlates with the precision. Hardly any improvement in respect to the run without constraint is observed for T0941 (right). While Precisions above 50% are associated with an increased best GDT_TS for target T0904 (middle), even precisions of 100% are not resulting in an improved best GDT_TS in all cases in T0866 (left)
Figure 9
Figure 9
(A) Effect of the number of employed contacts on the improvement of GDT_TS within the top five models by score. Performance of the run without restraints is indicated by the dashed line. For the best five ranked groups (ranking according to Table 2) the list size with the biggest improvement varies between L/2 to 2*L for target T0866. (B) In contrast the best option based on the boxplot for the top 10 groups (ranking according to Table 2) on the seven targets with a GDT_TS above 30 is L/5 with a slight margin over L/2
Figure 10
Figure 10
Distribution of delta GDT_TS values by group compared to the modeling without restraints for the best GDT_TS within the top five structures by score over all targets reaching ΔGDT_TS values above 25 (L/2 medium‐range and long‐range contacts). Interestingly groups performing well in the L/2 ranking in Table 2 like G079 and G219 (underlined) have a lower GDT_TS in the majority of targets compared to the reference, groups that are not in the Top 5 (G097 and G320) of the ranking show on average the biggest improvement in GDT_TS
Figure 11
Figure 11
Average Precision by group for the L/2 and L/5 list (medium and long range contacts, FM targets). While the average precision of the L/5 predictions is in most cases slightly higher than the L/2 precision, the ranking on either metric will be similar
Figure 12
Figure 12
Paired t test comparing average precision (L2/FM/ML) per target for each of the 32 groups. P values <0.05 are shaded indicating a significant difference between the groups. White indicates no significant difference between the groups while darker shades represent higher significance. Based on the matrix, there is no significant difference between the predictions of the best performing groups
Figure 13
Figure 13
Top 10 predictors by cumulative z‐scores on (A) metrics assessing ranking of probabilities and (B) metrics assessing binary contact classification based on the 0.5 cutoff according to the assessor‐selected scores in each category. The four predictors appearing in the top 10 of both rankings are underlined. The scores in panel A include three reduced list scores—the F1 + 0.5*ES combination of the F1 and entropy scores, and the precision on L/2 and L/5 data, and one full list score—the area under the curve in the precision‐recall analysis (AUC_PR). The scores in panel B include the F1 + 0.5*ES and MCC + 0.5*ES combinations of the F1, MCC and the entropy scores. For the FL assessment of MCC and F1, only the residue pairs predicted with the probability >0.5 were considered as contacts. The results in panel (B) are therefore affected by the way some groups scaled their contacts, not submitting predictions with probabilities above 0.5 for several targets
Figure 14
Figure 14
Boxplot showing statistics on the contact probabilities submitted FM and FM/TBM targets for CASP12. One group submitted only confident contacts (G108), while others did not appear to take the requested format into consideration by submitting almost all the contacts with probabilities below 0.5 (e.g., G206 and G458)
Figure 15
Figure 15
boxplots per group depicting the fraction of True Positive contacts for the 10 intervals between 0 and 1 (step = 0.1). The perfect correlation between the intervals and the true positive fraction of the prediction (TP/[TP + FP]) is indicated by the dashed line. In the majority of groups TP/[TP + FP] corresponds roughly to the probability interval
Figure 16
Figure 16
Distribution of sequence depth over all targets for CASP11 (white light gray) and CASP12 (black) for targets with low (<0.5), medium (0.5‐2), and high alignment depth. Alignment depth values were calculated from the outputs of HHblits and PSI‐BLAST as described previously10 using the latest databases available after closure of the prediction window for each target

Similar articles

Cited by

References

    1. Lesk AM. CASP2: report on ab initio predictions. Proteins. 1997;(suppl1):151–166. - PubMed
    1. Orengo CA, Bray JE, Hubbard T, LoConte L, Sillitoe I. Analysis and assessment of ab initio three‐dimensional prediction, secondary structure, and contacts prediction. Proteins. 1999;(suppl3):149–170. - PubMed
    1. Lesk AM, Conte Lo L, Hubbard TJ. Assessment of novel fold targets in CASP4: predictions of three‐dimensional structures, secondary structures, and interresidue contacts. Proteins. 2001;45(suppl 5):98–118. - PubMed
    1. Aloy P, Stark A, Hadley C, Russell RB. Predictions without templates: new folds, secondary structure, and contacts in CASP5. Proteins. 2003;53(suppl 6):436–456. - PubMed
    1. Graña O, Baker D, MacCallum RM, et al. CASP6 assessment of contact prediction. Proteins. 2005;61(suppl 7):214–224. - PubMed

Publication types