. 2018 Mar;86 Suppl 1(Suppl 1):152-167.
doi: 10.1002/prot.25409. Epub 2017 Nov 29.

Assessment of the model refinement category in CASP12

Affiliations

Assessment of the model refinement category in CASP12

Ladislav Hovan et al. Proteins. 2018 Mar.

Abstract

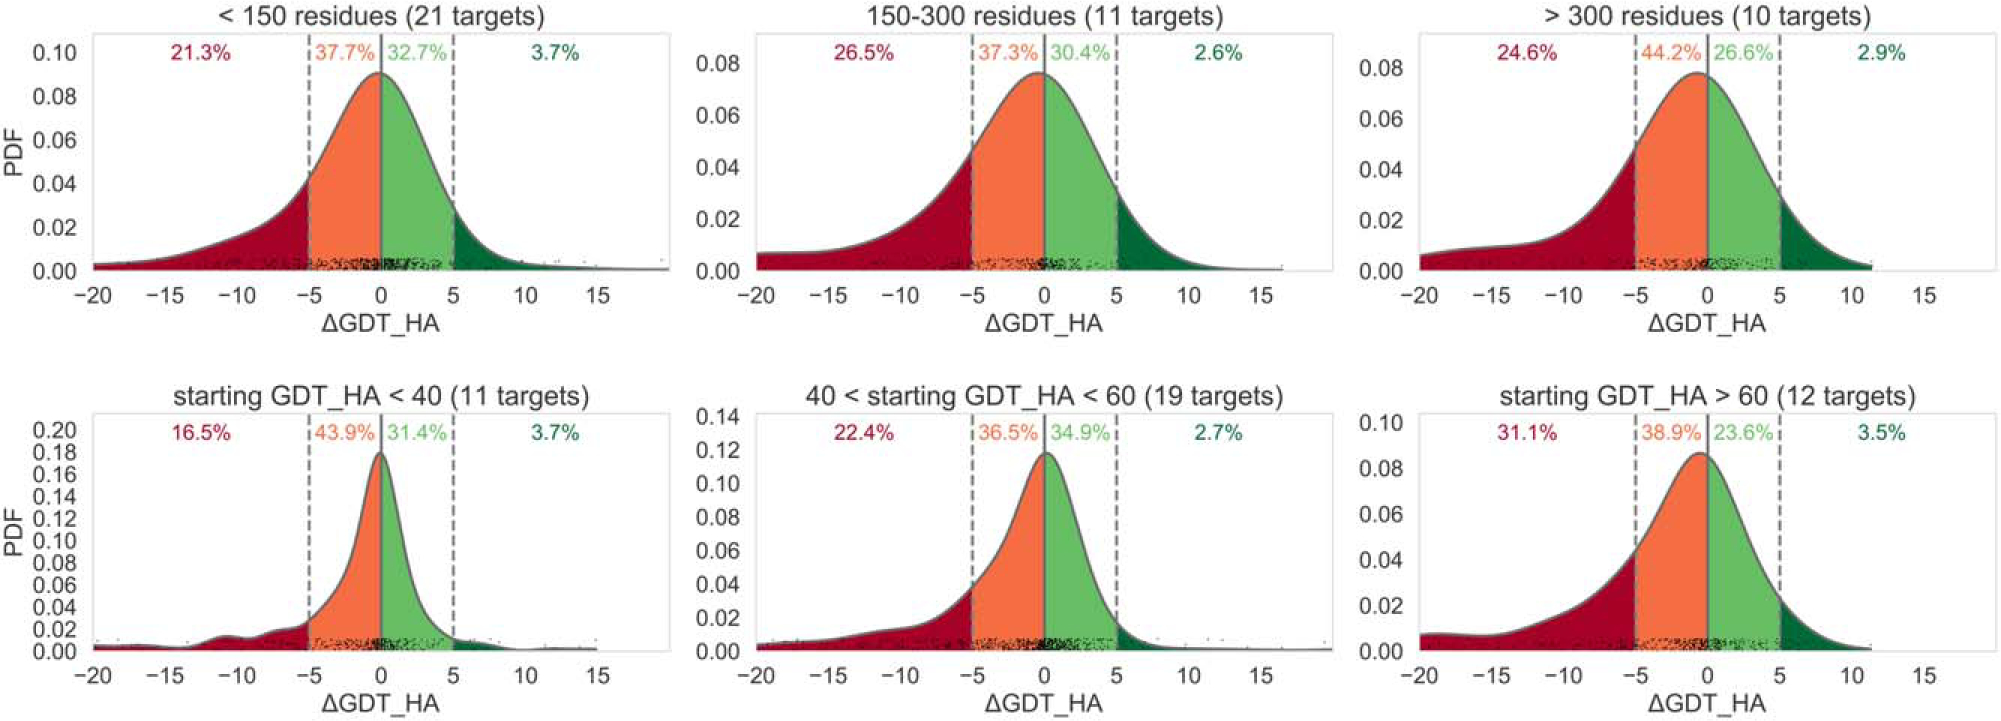
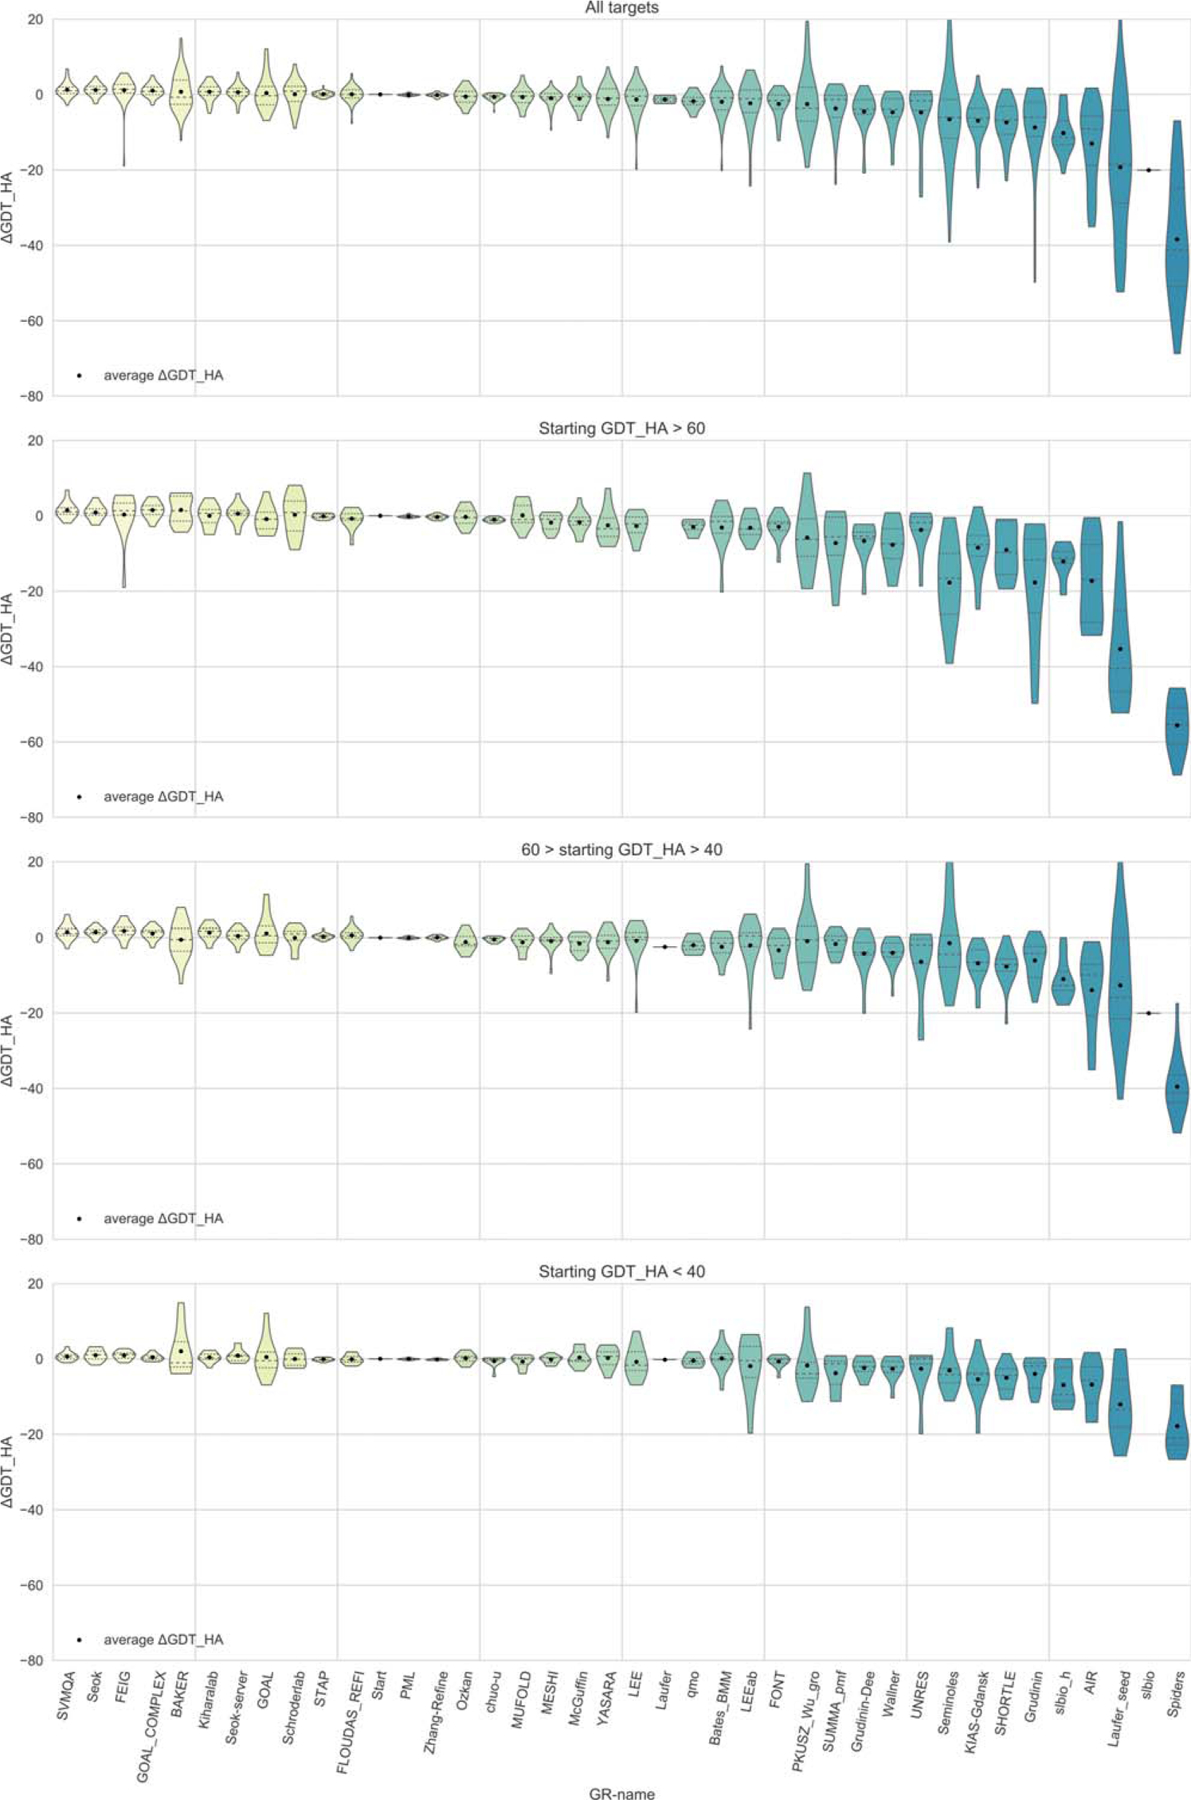
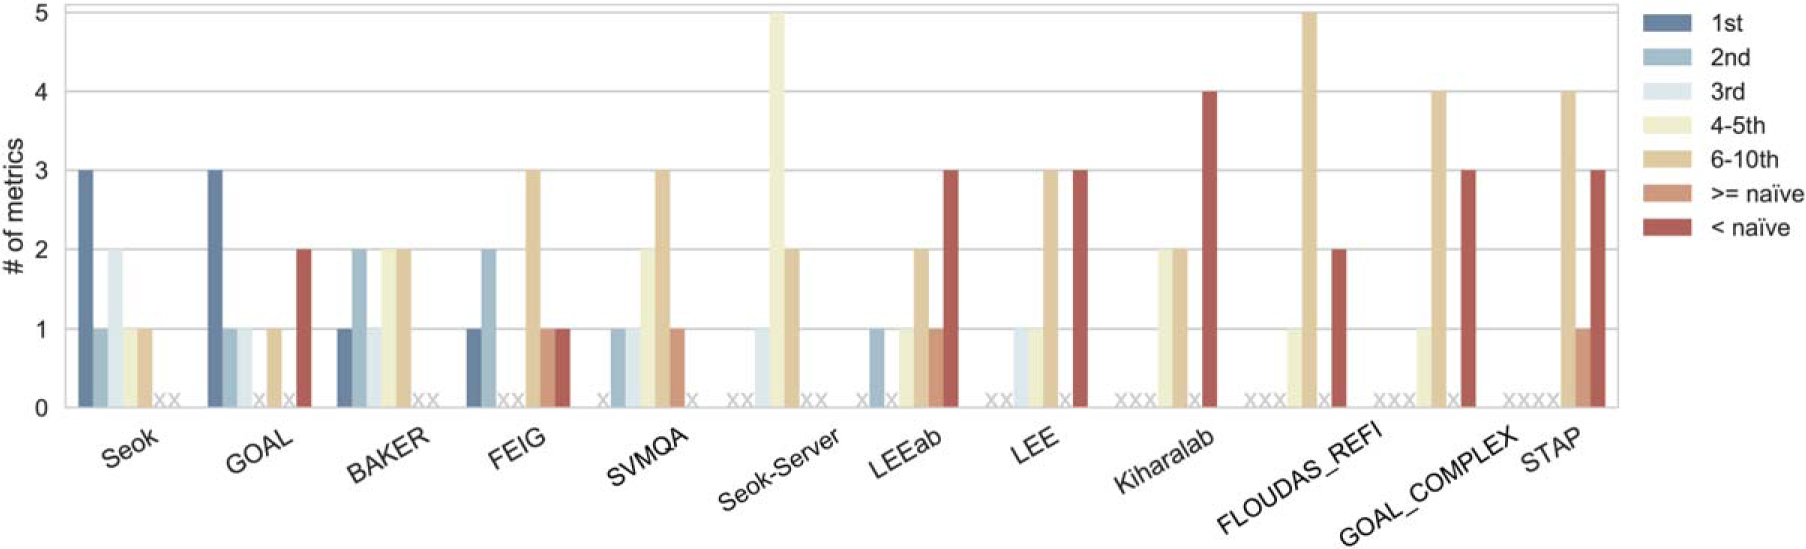
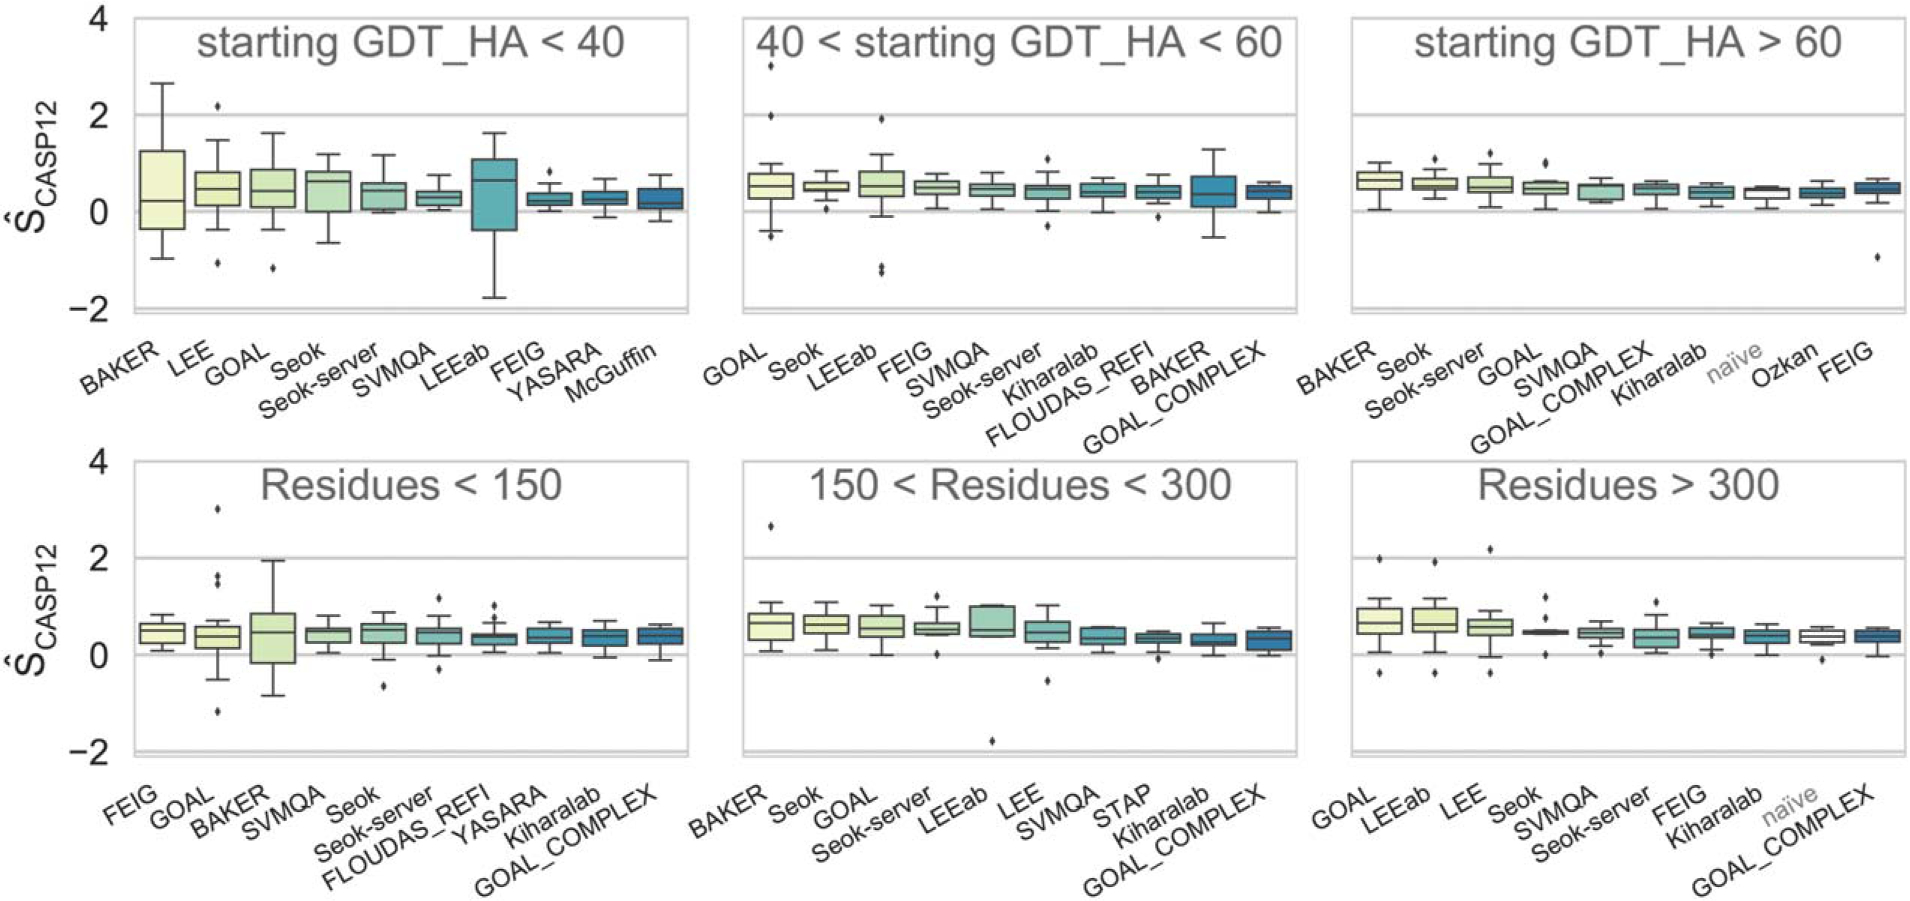
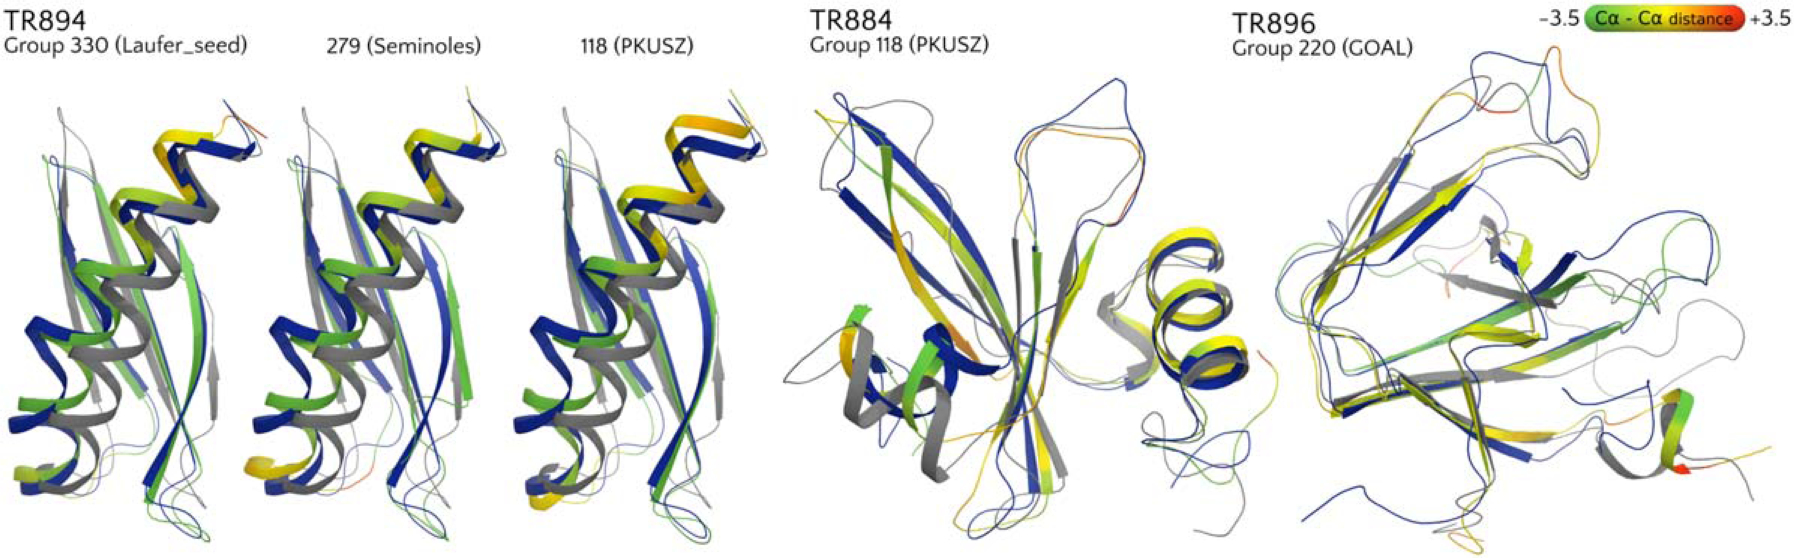
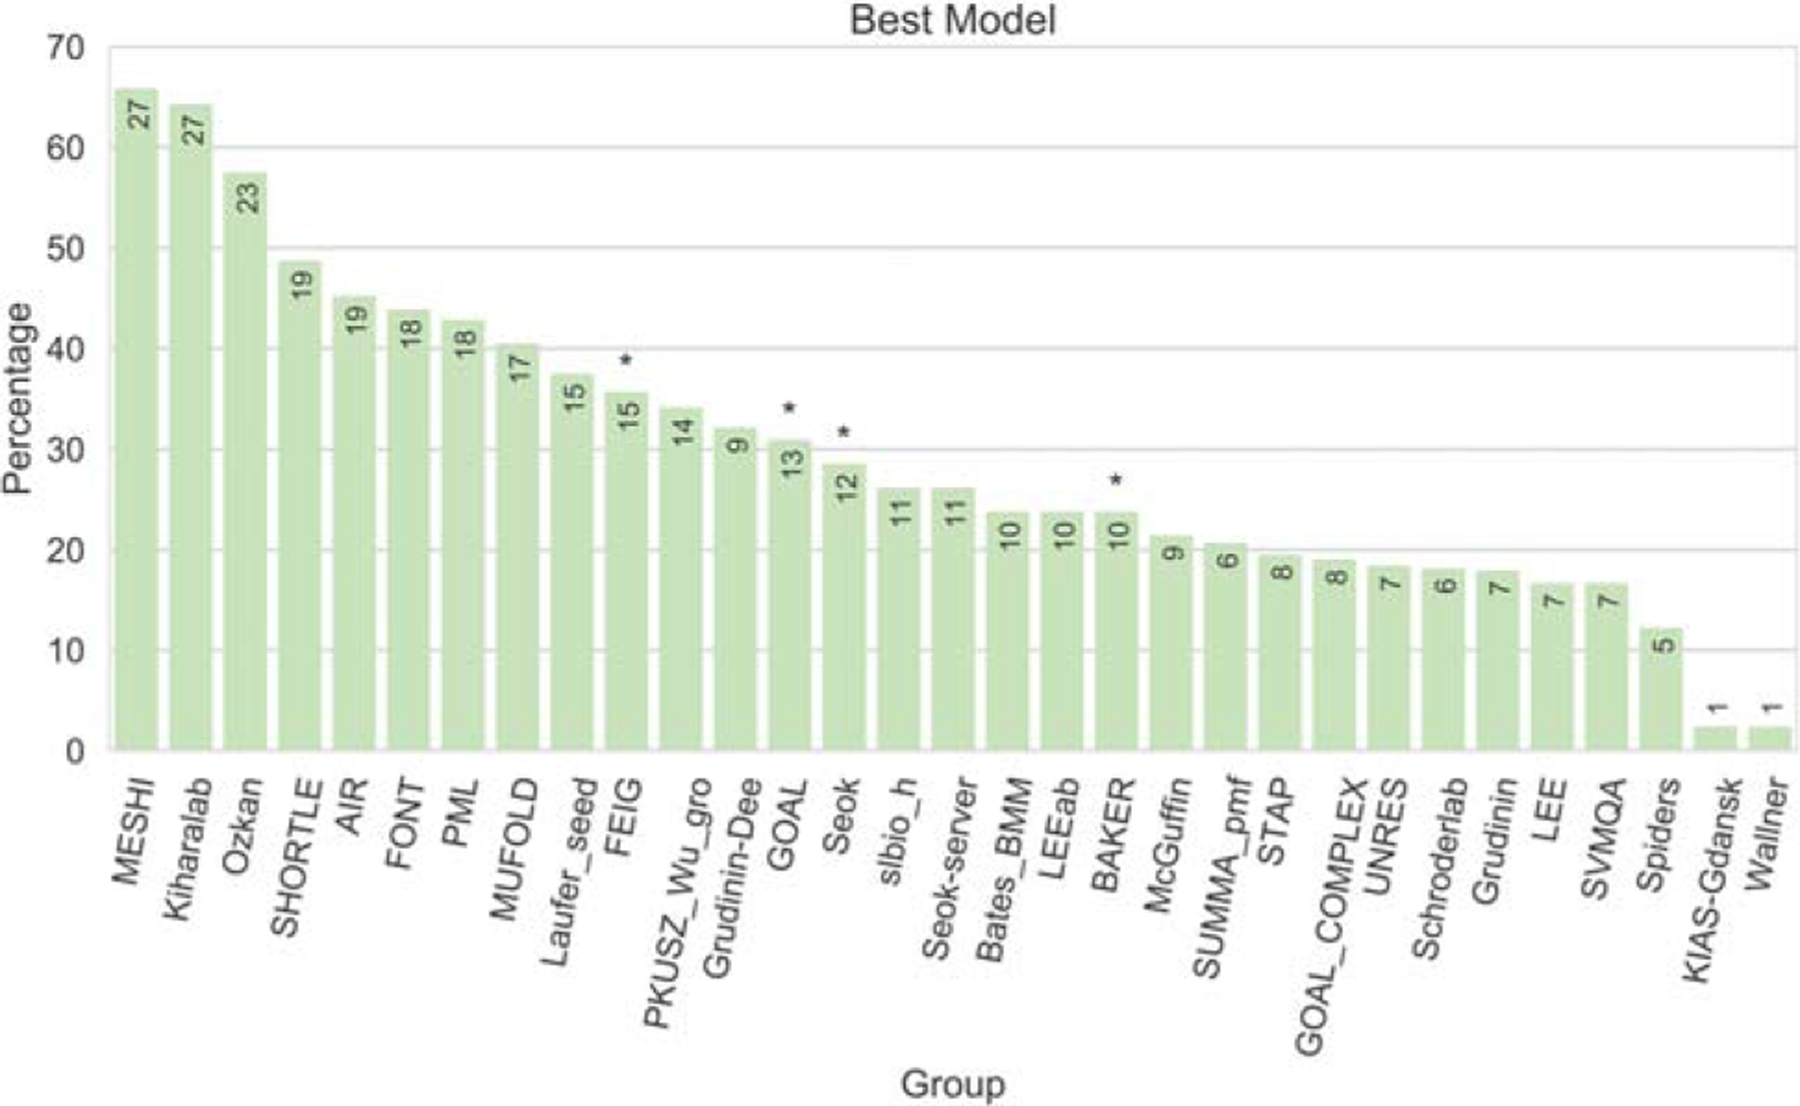
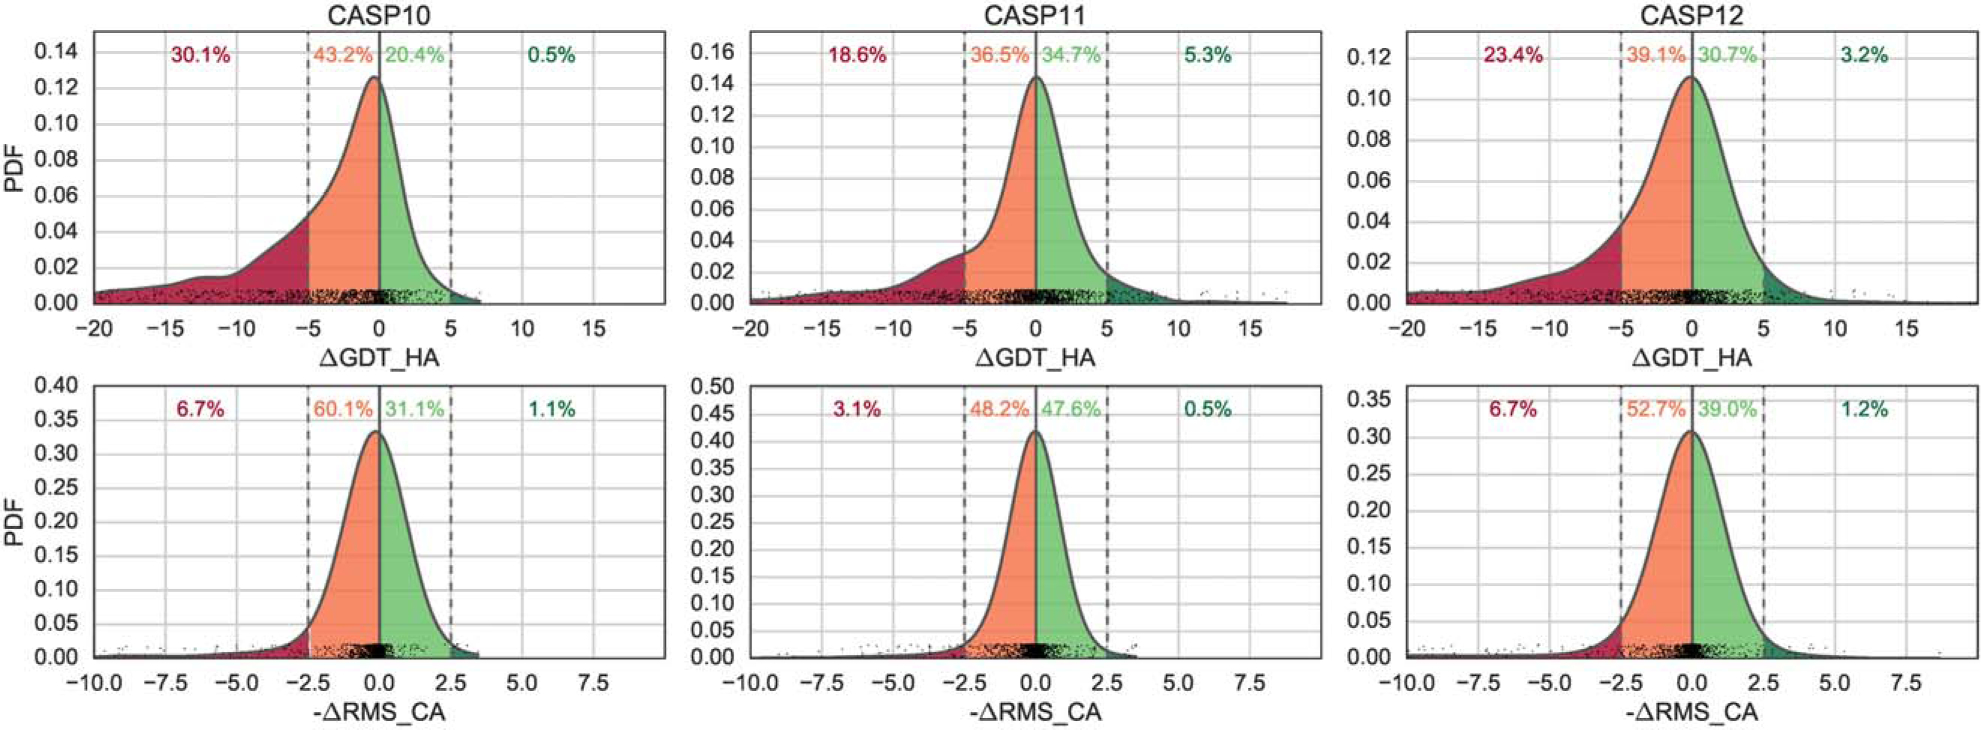
We here report on the assessment of the model refinement predictions submitted to the 12th Experiment on the Critical Assessment of Protein Structure Prediction (CASP12). This is the fifth refinement experiment since CASP8 (2008) and, as with the previous experiments, the predictors were invited to refine selected server models received in the regular (nonrefinement) stage of the CASP experiment. We assessed the submitted models using a combination of standard CASP measures. The coefficients for the linear combination of Z-scores (the CASP12 score) have been obtained by a machine learning algorithm trained on the results of visual inspection. We identified eight groups that improve both the backbone conformation and the side chain positioning for the majority of targets. Albeit the top methods adopted distinctively different approaches, their overall performance was almost indistinguishable, with each of them excelling in different scores or target subsets. What is more, there were a few novel approaches that, while doing worse than average in most cases, provided the best refinements for a few targets, showing significant latitude for further innovation in the field.

Keywords: CASP; CASP12; enhanced sampling algorithms; model refinement; molecular dynamics; protein structure prediction.


Figures

FIGURE 1
FIGURE 1
Target structures with interdomain or interchain contacts. The domains to be refined are in cyan, additional domains are in gray. The interacting regions that were removed from the assessment are shown in red. These are Q65-F75 in TR868, I8-S21 in TR870, F107-A124 in TR876, V142-Y152 in TR866. In the case of TR887, the green region represents the swap segment added to the target structure from the second monomer
FIGURE 2
FIGURE 2
Correlation between eight evaluation metrics for all targets and all submissions. Pair-wise scatter plots are in the left lower triangular part of the table; the correlation coefficients are in the upper one
FIGURE 3
FIGURE 3
Normalized probability distributions of ΔGDT_HA differences between the refined and starting models for different target lengths (top row of graphs) and different starting GDT_HA (bottom row). Data for first submitted models are presented; y axis shows values of the probability density function (PDF) of the distribution
FIGURE 4
FIGURE 4
Performance of CASP12 groups as evaluated by the differences in GDT_HA scores between the refined and starting models. The data are shown for all targets (top panel) and for three target subclasses with different GDT_HA scores of starting models (that is, different difficulties of original targets for tertiary structure prediction). Only models ranked as #1 by the predictors are considered. The quartiles are shown as dotted lines in the violin plots. Groups are sorted according to decreasing ΔGDT_HA mean on all targets (top panel)
FIGURE 5
FIGURE 5
Overall performance by group as measured by RMSD, GDT_HA, SphGr and QCS Z-scores. Each panel shows boxplots of per-target Z-scores for a specific measure. Groups are ordered left to right by the sum of RMSD Z-scores (top panel, higher is better). Missing predictions are assigned a value of −2 for each target. The number of submitted targets for each group are reported in gray on top of the box plots for MolPrb
FIGURE 6
FIGURE 6
Cumulative group ranking for the eight selected metrics. The plot shows the number of times a group appears with a particular ranking in the best 10 models according to the various metrics considered separately. When a group is not in the best 10, we report whether the score is better or worse than that of the “naïve” submission. Thus, the sum of all bar heights for each group is always equal to eight (total number of metrics). Only groups appearing among the best 10 according to at least 2 metrics are shown
FIGURE 7
FIGURE 7
Discrepancies between the GDT_HA and SphereGrinder scores for two different models on two refinement targets—TR882 and TR948. The target structure is colored blue, the starting model—gray and the prediction—based on per-residue distances (A) between the corresponding Ca atoms in the superposition, ranging from green (improved over starting model) to yellow (no improvement) and red (worse). For clarity, part of the structure has been removed from target TR948
FIGURE 8
FIGURE 8
Overall performance by group as measured by the S^CASP12 assessors score. Groups are ordered left-to-right by their rank (i.e., decreasing sum of S^ over all targets)
FIGURE 9
FIGURE 9
Overall performance by group as measured by the S^CASP12 assessors score on the targets grouped into three bins based on the starting model’s GDT_HA (top row) and target size (lower row). Groups in each panel are ordered left-to-right by their rank (decreasing sum of S^CASP12 over all targets). Only the first submitted models are considered
FIGURE 10
FIGURE 10
Some examples of notable refinement. The target structure is shown in blue, the starting model in gray and the prediction with a color scale based on per-residue distances (A) between the corresponding Ca atoms in the superposition, ranging from green (improved over starting model) to yellow (no improvement), and red (worse)
FIGURE 11
FIGURE 11
Four predictions that improved over the starting model for target TR594 by >10 GDT_HA points The target structure is shown in blue, the starting model in gray and the prediction with a color scale based on ΔRMSD ranging from green (improved over starting model) to yellow (no improvement) and red (worse)
FIGURE 12
FIGURE 12
Best model or method selection. The plot reports the percentage of submitted models #1 that correspond to the best of the five submitted models. The numbers on top of the bars report the number of model 1 s corresponding to the best models (not all groups submitted models for all targets). The asterisks mark the CASP12 top performers
FIGURE 13
FIGURE 13
Normalized probability distributions of ΔGDT HA and ΔRMSD scores in the latest three CASPs; y axis shows values of the probability density function of the distribution
FIGURE 14
FIGURE 14
Comparison of the refinement achieved by group 220 (GOAL) on targets for which the starting structure was provided by GOAL itself (“start”) or by other groups (“not-start”)

References

    1. MacCallum JL, Hua L, Schnieders MJ, Pande VS, Jacobson MP, Dill KA. Assessment of the protein-structure refinement category in CASP8. Proteins. 2009;77(S9):66–80. - PMC - PubMed
    1. Zhang Y Protein structure prediction: when is it useful? Curr. Opin. Struct. Biol. 2009;19(2):145–155. - PMC - PubMed
    1. Sliwoski G, Kothiwale S, Meiler J, Lowe EW. Computational Methods in Drug Discovery. Pharmacol. Rev. 2014;66(1):334–395. - PMC - PubMed
    1. Becker OM, Dhanoa DS, Marantz Y, et al. An integrated in silico 3D model-driven discovery of a novel, potent, and selective amidosulfonamide 5-HT1A agonist (PRX-00023) for the treatment of anxiety and depression. J. Med. Chem. 2006;49:3116–3135. - PubMed
    1. Giorgetti A, Raimondo D, Miele AE, Tramontano A. Evaluating the usefulness of protein structure models for molecular replacement. Bioinformatics. 2005;21(Suppl 2):ii72–ii76. - PubMed

Publication types