. 2017 Nov 2;551(7678):119-123.
doi: 10.1038/nature24299. Epub 2017 Oct 25.

A global resource allocation strategy governs growth transition kinetics of Escherichia coli

Affiliations

A global resource allocation strategy governs growth transition kinetics of Escherichia coli

David W Erickson et al. Nature. .

Abstract

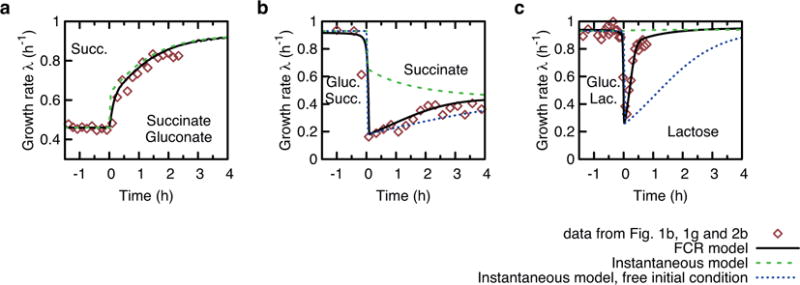
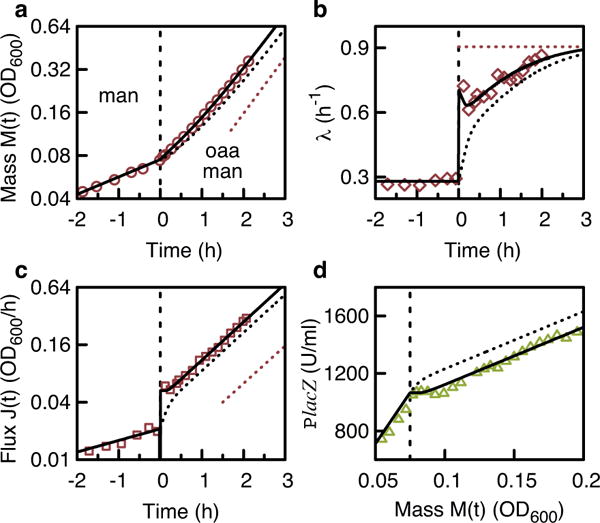
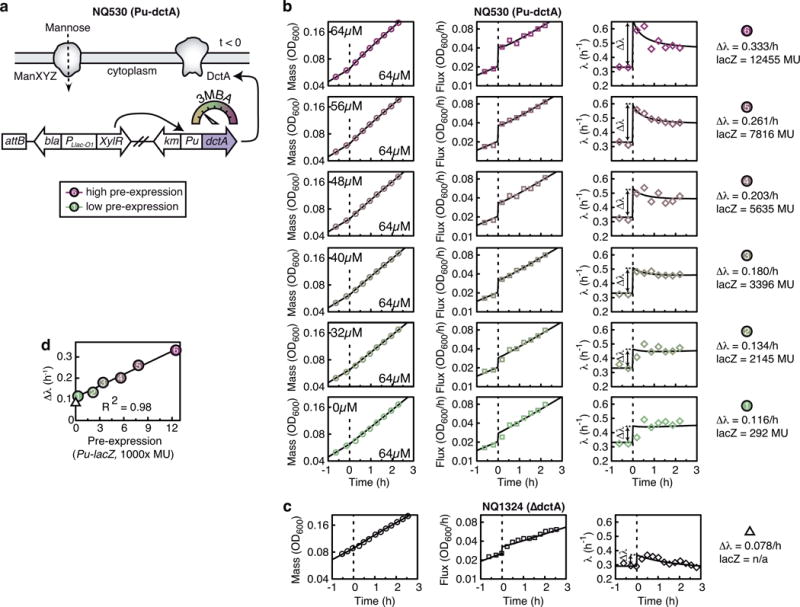
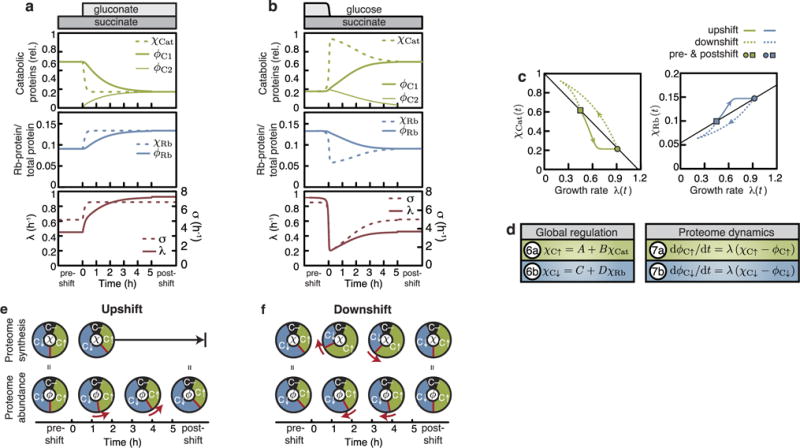
A grand challenge of systems biology is to predict the kinetic responses of living systems to perturbations starting from the underlying molecular interactions. Changes in the nutrient environment have long been used to study regulation and adaptation phenomena in microorganisms and they remain a topic of active investigation. Although much is known about the molecular interactions that govern the regulation of key metabolic processes in response to applied perturbations, they are insufficiently quantified for predictive bottom-up modelling. Here we develop a top-down approach, expanding the recently established coarse-grained proteome allocation models from steady-state growth into the kinetic regime. Using only qualitative knowledge of the underlying regulatory processes and imposing the condition of flux balance, we derive a quantitative model of bacterial growth transitions that is independent of inaccessible kinetic parameters. The resulting flux-controlled regulation model accurately predicts the time course of gene expression and biomass accumulation in response to carbon upshifts and downshifts (for example, diauxic shifts) without adjustable parameters. As predicted by the model and validated by quantitative proteomics, cells exhibit suboptimal recovery kinetics in response to nutrient shifts owing to a rigid strategy of protein synthesis allocation, which is not directed towards alleviating specific metabolic bottlenecks. Our approach does not rely on kinetic parameters, and therefore points to a theoretical framework for describing a broad range of such kinetic processes without detailed knowledge of the underlying biochemical reactions.


Conflict of interest statement

Author Information

The authors declare no competing financial interests. Readers are welcome to comment on the online version of the paper.

Figures

Extended Data Figure 1
Extended Data Figure 1. Growth laws
a, Dry mass per optical density OD600 nm is independent of the growth rate in the investigated conditions with an average of 509 μg dry weight per ml × OD600 nm value (black line). b, Protein mass per optical density OD600 nm shows a slight dependence on growth rate (black line: guide to the eye), in accordance with the increase of RNA and DNA in the cell at higher growth rates. Because the change is small in the range of growth rates of the up- and downshifts presented, we take the conversion from dry mass to total protein to be constant throughout the shifts presented. Dry mass and total protein data taken from ref. . c, Ribosomal proteome fraction of the cell ϕRb(λ) at steady-state growth at rate λ*, using RNA or protein as a reporter. The data are fitted with the linear relation ϕRb=ϕRb,0+λ/γ with φRb,0 = (0.049 ± 0.02) and γ = (11.02 ± 0.44) h−1. d, Catabolic proteins (ϕCat(λ),leftaxis) were measured with LacZ (induced with 1 mM IPTG) as a reporter and measuring Miller units (MU) (right axis; see ref. for MU). The linear relation was fitted with ϕLacZ=ϕLacZ,max(1λ/λC) with ϕLacZ,max=(21.8±0.5)×103MU and λC = (1.17 ± 0.05)h−1. e, The translational activity σ* is calculated from ϕRb(λ) (c) as σ=λ/ϕRb(λ). f, g, Regulatory functions χ^Rb(σ) and χ^Cat(σ), functions of the translational activity σ*, are calculated by substituting λ* by σ* from the fits in c and d (see Supplementary equations (28) and (29)). h, i, Tables show all data plotted in c and d. Data in h were measured by growth on different carbon substrates, data in i were measured by growth of strains with titratable transporter expression, see list of strains in j.
Extended Data Figure 2
Extended Data Figure 2. Long-term dynamics and repeatability
a, Serial dilution experiment of the upshift of Fig. 1 (succinate, add gluconate). The top graph shows optical density OD600 nm as a measure of biomass M(t), the middle graph shows biomass flux J(t), and the bottom graph shows the growth rate λ(t) = J(t)/M(t). Shortly after the upshift, the cell culture was diluted 4- and 16-fold in fresh medium, grown in parallel to the original culture, and the optical density was recorded for the diluted cultures once they reached an optical density of around 0.05. As the growth rate is independent of the cell density, data from the original and the diluted cultures collapse, showing that for longer times the growth rate reaches its final level (dashed line). b, Repeatability. Biomass (top), flux (middle) and growth rate (bottom) for (left to right) the upshift from Fig. 1a–e and the downshift shown in Fig. 1f–j. Theory (black line) and data (red diamonds) are identical to Fig. 1. Four independent repeats (purple, orange, green and blue) are plotted on top of the data shown in Fig. 1.
Extended Data Figure 3
Extended Data Figure 3. Upshifts from succinate and pyruvate
a–h, NCM3722 grown exponentially on 20 mM succinate (succ.) or 20 mM pyruvate (pyr.) as the sole carbon substrate. At t = 0 a second, subsequently co-utilized carbon substrate was added: 0.2% arabinose (a, e); 0.2% xylose (b, f); 0.2% glycerol (c, g); 0.2% glucose (d); 20 mM gluconate (h). The left panels show optical density OD600 nm (a measure of biomass M(t), red circles), the middle panels show the derivative of OD600 nm (a measure for biomass flux J(t), red squares), and the right panels show growth rate (λ(t) = J(t)/M(t), red diamonds). Theory lines for M(t), J(t) and λ(t) were calculated using Supplementary equations (76), (70) and (77), using the initial condition Supplementary equation (52) for upshift without pre-expression. Initial and final growth rates were measured during steady-state growth on the respective carbon substrates.
Extended Data Figure 4
Extended Data Figure 4. Downshift with co-utilized carbon substrates
a–d, NCM3722 grown exponentially on 20 mM succinate (succ.) (a, b) or 20 mM pyruvate (pyr.) (c, d), combined with either 0.56 mM gluconate (gluc.) (a, c) or 1.11 mM glycerol (glyc.) (b, d). At around t = 0, gluconate or glycerol were depleted. The left panels show optical density OD600 nm (a measure of biomass M(t), red circles), middle panels show the derivative of OD600 nm (a measure for biomass flux J(t), red squares), and right panels show the growth rate (λ(t) = J(t)/M(t), red diamonds). Theory lines for M(t), J(t) and λ(t) were calculated solving the differential equation for the translational activity σ(t) (Supplementary equation (22)), and those defining the internal fluxes and protein content (Supplementary equations (19)–(21) and (22)–(24)) numerically. The uptake of the depleting substrate (glycerol or gluconate) was calculated from Supplementary equation (20), using the Michaelis constants Km = 212 μM (gluconate) and Km = 5.6 μM (glycerol). Since gluconate transport has a low affinity, it depletes slowly (see a and c), which is accurately described by our modelling of catabolism. Initial and final growth rates were measured during steady-state growth on the respective carbon substrates.
Extended Data Figure 5
Extended Data Figure 5. Performance of models of growth kinetics without gene regulation
a–c, This figure shows the result of three nutrient shifts discussed in the main text: Succinate-gluconate upshift from Fig. 1b (a); Succinate–glucose downshift from Fig. 1g (b); Glucose–lactose diauxie shift from Fig. 3b (c). Experimental data are shown as red symbols. Among existing models of growth transition, the one proposed by Dennis and Bremer allows for predicting growth transitions of upshifts. This model assumes that the flux jumps instantaneously to the final state without a regulatory scheme (see Supplementary Note 1 for a review). Predictions of this model, referred to here as the ‘instantaneous model’ are shown as the green dashed lines in all panels. Although the instantaneous model works well for upshifts (panel a), for which it was developed, it fails to describe downshifts (panels b and c), because it cannot describe a flux decrease. The instantaneous model cannot be fixed by matching the flux after glucose depletion (blue dotted lines in panels b and c), as it underestimates the recovery rate owing to a lacking regulatory scheme (Supplementary Note 1). By contrast, the FCR model introduced in this work, based on an active reallocation of protein synthesis during growth transitions, predicts the correct recovery rates (black solid lines) consistently for both up- and downshifts.
Extended Data Figure 6
Extended Data Figure 6. Upshift from mannose
a–c, NCM3722 grown exponentially on 0.1% mannose as the sole carbon substrate. At t = 0 (dashed line) oxaloacetic acid (OAA), subsequently co-utilized, is added. Optical density OD600 nm (a measure of biomass M(t), red circles) (a), the derivative of OD600 nm (a measure of biomass flux J(t), red squares) (b), growth rate (λ(t) = J(t)/M(t), red diamonds) (c). d, Expression of the catabolic proteins reporter LacZ is transiently repressed after the shift (vertical dashed line). Dotted black lines show solutions of the theory using the initial condition for no pre-expression (Supplementary equation (52)), which does not coincide with the experimental data (symbols). Using the initial condition for pre-expression (Supplementary equation (54)) and fitting the pre-expression level, the theory (black lines) describes the data very well, including the transient repression of LacZ in d. LacZ activity units U are defined as MU × OD600 nm.
Extended Data Figure 7
Extended Data Figure 7. Effect of pre-expression on upshift kinetics
a, E. coli NQ530 grown exponentially in mannose minimal medium with different levels of succinate transporter (DctA) pre-expressed via the titratable Pu promoter (regulator: XylR, inducer: 3MBA). At time t = 0, medium was supplemented with 20 mM succinate and DctA expression is set to a common level for all upshifts. b, Biomass M(t) (OD600 nm), biomass flux J(t) (derivative of OD600 nm) and growth rate λ(t) for different levels of pre-expression (3MBA concentration indicated in panels). DctA preexpression positively affects post-shift growth. The biomass flux J(t) (middle) shows a saltatory increase followed by exponential growth at final rate λf. For cultures with a high level of pre-expression, the instantaneous growth rate λ(t) (right) transiently overshot before relaxing to the final value λf. The increase is transient because the DctA level in the synthetic construct eventually decreases below the pre-expression level. The kinetic theory quantitatively captures the upshift kinetics for all pre-expression levels, when using the initial condition σ(0) as the single fit parameter (solid lines). (c) NQ 1324 (ΔdctA) shows a small increase in growth rate upon upshift, despite the succinate transporter DctA being knocked out. Final growth rate is not significantly increased over steady-state growth on mannose alone. Steady-state growth rate on succinate alone was barely detectable for NQ1324 (λ ≲ 0.02/h). e, Validation of theoretical prediction. The magnitude of saltatory increase in growth rate Δλ (indicated in the right panels of b, c) depends linearly on the preexpression levels. The saltatory increase of the dctA knockout shown in c is indicated by a triangle.
Extended Data Figure 8
Extended Data Figure 8. Proteome remodelling
a, b, Regulatory functions χ and protein fractions φ of catabolic proteins (relative to maximal expression), ribosomes (absorbance in mg RNA per mg protein) as well as growth rate λ(t) and translational activity σ(t) during growth shifts for the upshift and downshift of Fig. 1. Soon after upshift the regulatory functions of catabolic proteins χCat(t) and ribosomes χRb(t), driven by the translational activity σ(t) (green, blue and red dashed lines), have relaxed to the final state (a). A new proteome is thus synthesized at the final ratio, leading to a slow convergence to the final state by growth-mediated dilution. The shortfalls of carbon influx after glucose depletion lead to an upregulation of χCat(t) and a downregulation of χRb(t), driven by the translational activity σ(t) (green, blue and red dashed lines) (b). c, The regulatory functions χCat(t) and χRb(t), set by the translational activity σ(t), plotted versus growth rate λ(t). Thin black lines show the steady-state growth laws (Extended Data Fig. 1c, d and Supplementary Note 2). Despite the regulatory functions being derived from the growth laws (black lines), they diverge considerably during growth transitions, as they are controlled by the translational activity σ(t), and not the growth rate λ(t). d, Assuming co-regulation of the proteome sectors C↑ and C↓ with catabolic and ribosomal proteins (equations (6a) and (6b)), the dynamics of the proteome sectors can be described (equations (7a) and (7b); see Supplementary Note 5 for details). e, f, Graphical synopsis of the proteome remodelling of a and b, as predicted by equations (6a), (6b), (7a) and (7b). Red boundary and arrows show dynamics. In upshifts regulatory functions χ rapidly relax to their final states; in downshifts regulatory functions initially overshoot and relax slowly to their final states (see Supplementary Note 6 for extended discussion).
Extended Data Figure 9
Extended Data Figure 9. Biphasic relaxation kinetics
The figure shows the relaxation kinetics for growth shifts, as obtained from the FCR model. a-c, An upshift from slow growth λi = 0.3 h−1 (orange) and a downshift from fast pre-shift growth λi = 0.95 h−1 (green) is seen, both with the same growth rate directly after the shift, λ(0) = 0.3 h−1, and the same fast final growth rate λf = 0.95 h−1. d–f, An upshift from slow growth λi = 0.2 h−1 (orange) and a downshift from fast pre-shift growth λi = 0.95 h−1 (green) is seen, with λ(0) = 0.2 h−1, and the same slow growth rate λf = 0.95 h−1. a, d, The trajectories of the recovery in the space of growth rate (left y-axis), which is proportional to the catabolic protein fraction (right y-axis), and ribosome fraction φRb(t) (bottom x-axis). The initial condition φRb(0) depends on the pre-shift growth rate λi (top x-axis). The trajectories start at the points (φRb(0), λ(0)), indicated by coloured squares, and end at the final state (φRb,f, λf), marked with a black cross. As detailed in Supplementary Note 6, the kinetics are biphasic and can be understood using a simple geometric construction, which yields the dotted and dashed lines (see Supplementary Note 6.2). First, a relaxation associated with a timescale μf−1 (Supplementary equation (116)), along the grey dashed lines, during which protein synthesis contains more catabolic proteins and fewer ribosomes than the final composition of the proteome. The end of this kinetic phase is indicated by circles in all panels. Second, a slow motion along the diagonal dashed line on the timescale λf−1 (Supplementary equation (120)). Along this line, the translational activity, σ(t) = λ(t)/φRb(t), has relaxed to the final state (see b, e), where σ(t) has relaxed after the ‘circles’. As a result, the regulatory functions have relaxed to the final state too, and protein synthesis contains the same amount of catabolic proteins and ribosomes as in the final state. During this second phase, the proteome gradually adapts due to growth-mediated dilution of inherited proteins. c, f, The growth rate almost fully adapts during the first phase (from t = 0 to the circle) for the downshifts (green, cyan), but not for the upshifts (orange, purple). This difference is because of the high ribosome abundance in downshifts, which allows increased expression of catabolic proteins, and thus almost entirely avoids the slow phase, and is more prominent for shifts to fast final growth (a–c), than to slow final growth (d–f).
Extended Data Figure 10
Extended Data Figure 10. Protein degradation
a, Pulse-labelling allows the differentiation of pre-pulse and post-pulse protein mass. We added concentrated 15NH4Cl into the culture at the moment of gluconate upshift or a few minutes before glucose exhaustion during the downshift. Comparing to a third isotope species (spiked-in 15N-reference culture) allows tracking the levels of pre-shift proteins over time. b, A schematic showing the levels of total cellular protein (black) and cellular protein existing at pulse time (blue) as the culture is instantaneously upshifted. Stable protein levels are characterized by a zero-slope line (blue solid line), whereas degrading or exported cellular proteins exhibit a negative-slope line (blue dashed line, red arrow). c, The post-shift levels of 40 cellular proteins of highest mass fraction were quantified using the pulse-labelling approach. Light (L, 14N) over heavy (H, 15N) relative protein levels are plotted as a function of time. These proteins span diverse biological functions, cellular localization, size and structure. Together, they account for 35-40% of the total protein mass detected throughout the shift (estimated by summing their mass abundances listed in Supplementary Table 2 for each condition). With the exception of flagellin (fliC, red box), we did not observe decreasing protein levels for either the upshift or downshift series on the 2-h timescale for large-abundance proteins, which we could confidently quantify. Flagellin is exported to the cell periphery by a dedicated transport system, and probably shed into the medium during steady-state growth. As shed proteins are not collected at the same efficiency as proteins in cells, the decline of pre-labelled FliC serves as a positive control for the method.
Figure 1
Figure 1. Nutrient up- and downshifts
E. coli K-12 grown in minimal medium (and IPTG to induce LacZ) are shifted by the addition of a second nutrient or by the depletion of a nutrient. a–e, Upshift upon addition of a second nutrient: 20 mM succinate (present continuously), 20 mM gluconate (present only after t = 0). f–j Downshift upon depletion of a nutrient: 20 mM succinate (present continuously), 0.03% glucose (depleted around t = 0). a, f, Optical density (OD600 nm, red circles), RNA abundance (RNA amount per culture volume, blue inverted triangles), and LacZ activity per culture volume, both relative to t = 0 (green triangles), are plotted versus time. The slope of the dotted line indicates final growth rates (upshift, λf = 0.98 h−1; downshift, λf = 0.45 h−1). b, g, Instantaneous growth rate λ(t) (red diamonds). Red dotted lines indicate λf. c, h, Time derivative of OD600 nm (biomass flux, red squares). The slope of the dotted line indicates λf. d, e, i, j, Absolute LacZ activity and RNA abundance plotted versus OD600 nm. The slopes of the green and blue lines indicate final expression levels (defined in fractions of the total protein, see Supplementary equation (8) in Supplementary Note 2); the slopes of the orange lines indicate predicted expression levels immediately after the shift. The data are highly repeatable, see Extended Data Fig. 2. In all panels, the black curves are fit-parameter-free predictions of the FCR model, obtained as outlined in Methods.
Figure 2
Figure 2. Model of FCR
a, Flux balance and allocation of protein synthesis. Carbon substrates S1 and S2 are imported by uptake proteins Cat1 and Cat2 of abundances MCat1 and MCat2 at rates k1 and k2, respectively. Changes in the external concentrations of these substrates result in changes in the carbon influx JC (red, equation (1)), which supplies a pool of central precursors (squares). These precursors are consumed by the ribosomes (Rb) for protein synthesis, the flux of which JR (orange, equation (2b), with α being a conversion factor from carbon to protein) must balance the changes in the carbon influx at a coarse-grained timescale. Attaining this protein synthesis flux for a given number of ribosomes (of abundance MRb) requires changes in the translational activity σ as defined in equation (2a). Molecularly, changes in σ are attributed to changes in the precursor pool,. Parts of the protein synthesis flux are allocated to the expression of catabolic and ribosomal proteins, MRb and MCat1,2 (equations (3a) and (4a)). This allocation is determined by the global regulation functions χRb(t) and χCat(t), set molecularly by the precursor pool via ppGpp (blue arrows), and the cAMP–CRP system (green arrows), respectively, as well as the substrate-specific regulation h1,2 (Supplementary Note 3). b, The forms of the regulatory functions χ^Rb(σ)and χ^Cat(σ) (black lines) can be determined from the known steady-state measurements (Extended Data Fig. 1c, d) as derived in Supplementary Note 2.2d–f. The central simplifying assumption of the model is that the time-dependence of the regulation functions during growth transition is determined solely through the changes in σ, as expressed explicitly in equations (3b) and (4b).
Figure 3
Figure 3. Diauxic shift between hierarchically used carbon substrates
a, E. coli K-12 grown on 0.03% glucose and 0.2% lactose. Initially, only glucose is used. Around time t = 0 glucose was depleted and lactose uptake and metabolism were activated. The dotted red line indicates the growth rate on lactose only, λf = 0.95 h−1. b, The instantaneous growth rate λ(t) dropped abruptly after glucose depletion, followed by a rapid recovery to λf (dotted horizontal line). c, After glucose depletion, biomass flux increased at an increased rate, before settling to the final rate. The slope of the red dotted line indicates λf, the slope of the orange dotted line indicates μf d, Lactose catabolic enzyme LacZ (green triangles) is tightly repressed before the shift (98 U ml−1 at OD600 nm), then increases rapidly after the shift, before settling at the final expression level indicated by the slope of the green dotted line (1,557 U ml−1 at OD600 nm, obtained from steady-state growth in lactose only). The dotted orange line, with slope μf/λf × 1,557 U ml−1 OD600 nm = 7,866 U ml−1 OD600 nm, is the predicted response immediately after shift according to Supplementary equation (18) of Supplementary Note 2. The black curves are full predictions of the FCR theory using the timepoint of lac operon activation as the single fitting parameter (see Supplementary Note 3.2g).
Figure 4
Figure 4. Proteome composition during recovery
a, Expression of individual proteins during the up- and downshift of Fig. 1, relative to the pre-shift steady state (colour scale: log2). Proteins are grouped according to their steady-state response (see Methods) to decreasing growth rate by carbon limitation: C↑ (increase; green), C↓ (decrease; blue) and C (no response; black). b, c, Absolute proteome fractions of the protein sectors φC↑, φC↓ and φC− (symbols) and fit-parameter-free prediction (lines), derived under the assumption that all proteins in sectors C↑, C↓ and C follow simple rules of global allocation (Extended Data Fig. 9 and Supplementary Note 5). d, Mass fraction of individual pathways or protein groups during upshift (solid lines and symbols) and downshift (dashed lines and open symbols). Colours denote sector affiliation. All biosynthetic pathways follow the theoretical prediction assuming co-regulation. Motility expression (bottom right) is a clear exception, showing a 2 h delay increase during recovery from downshifts, when compared to the expected increase in expression (dashed line). TCA, tricarboxylic acid.

Comment in

References

    1. Monod J. The phenomenon of enzymatic adaptation and its bearings on problems of genetics and cellular differentiation. Growth. 1947;11:223–289.
    1. Kjeldgaard NO, Maaløe O, Schaechter M. The transition between different physiological states during balanced growth of Salmonella typhimurium. J Gen Microbiol. 1958;19:607–616. - PubMed
    1. Dennis PP, Bremer H. Regulation of ribonucleic acid synthesis in Escherichia coli: An analysis of a shift-up. J Mol Biol. 1973;75:145–159. - PubMed
    1. Thattai M, Shraiman BI. Metabolic switching in the sugar phosphotransferase system of Escherichia coli. Biophys J. 2003;85:744–754. - PMC - PubMed
    1. Kussell E, Leibler S. Phenotypic diversity, population growth, and information in fluctuating environments. Science. 2005;309:2075–2078. - PubMed

Publication types