. 2017 Oct 26;17(11):2453.
doi: 10.3390/s17112453.

Prostate Cancer Detection with a Tactile Resonance Sensor-Measurement Considerations and Clinical Setup

Affiliations

Prostate Cancer Detection with a Tactile Resonance Sensor-Measurement Considerations and Clinical Setup

Anders P Åstrand et al. Sensors (Basel). .

Abstract

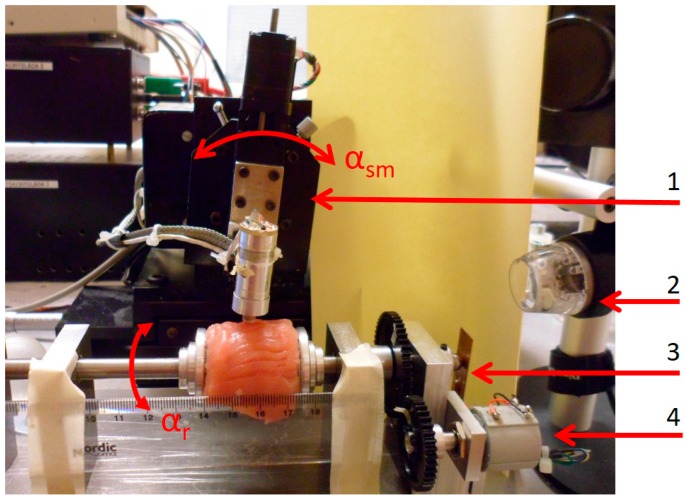
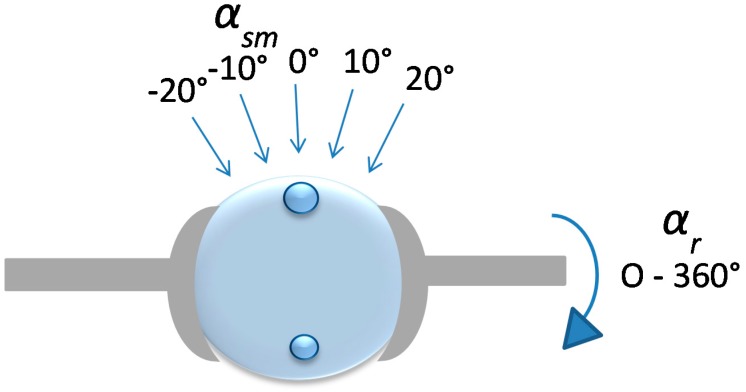
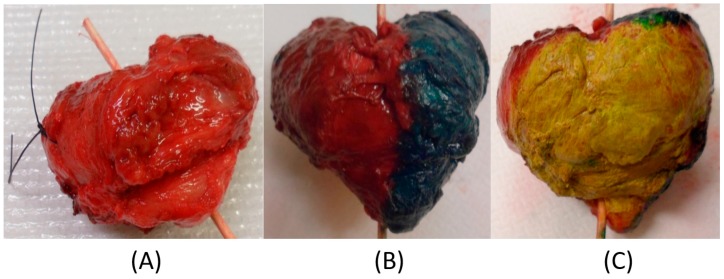
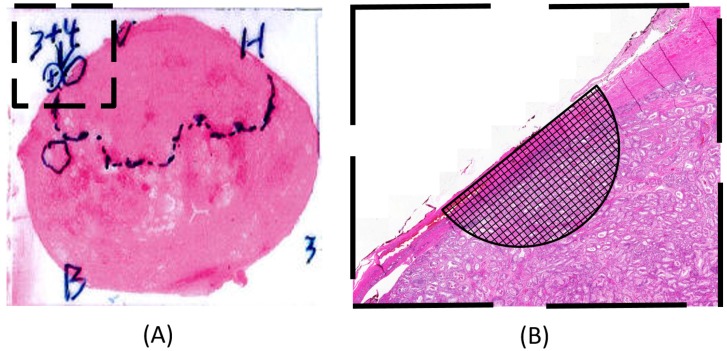
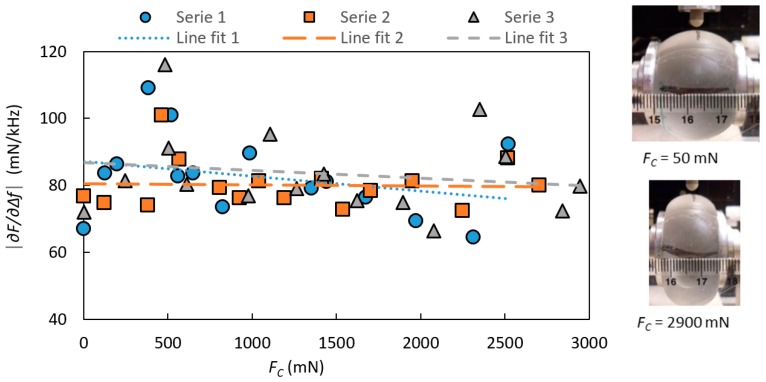
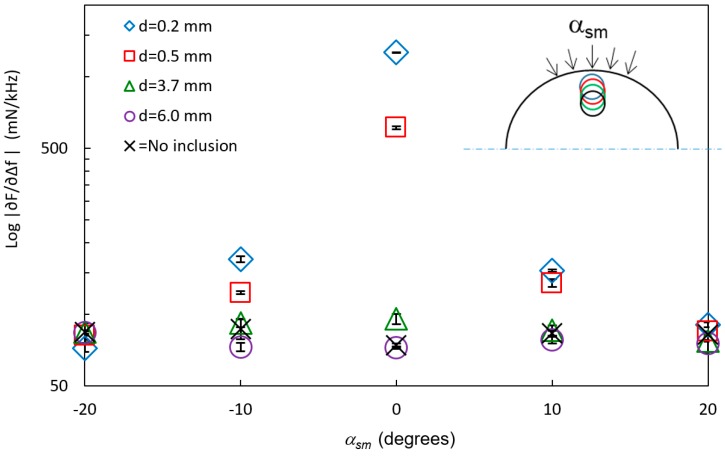
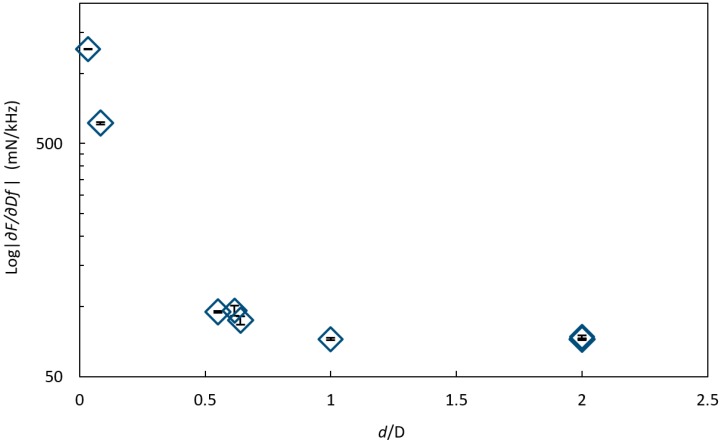
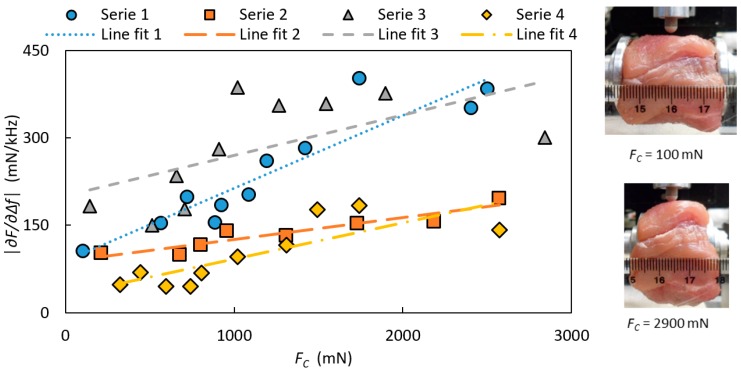
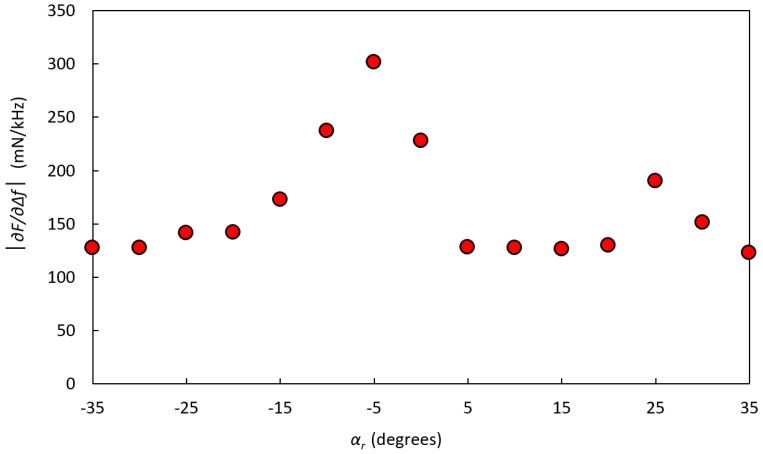
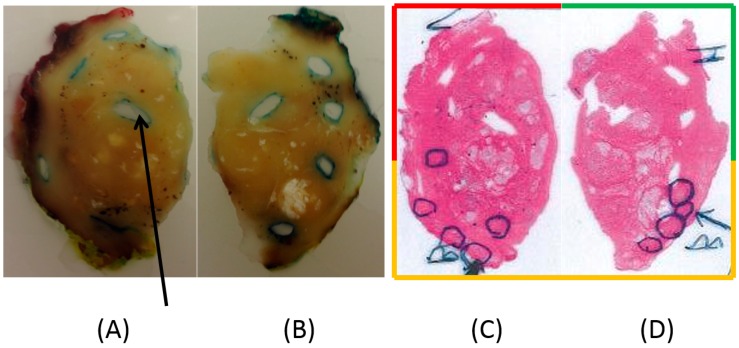
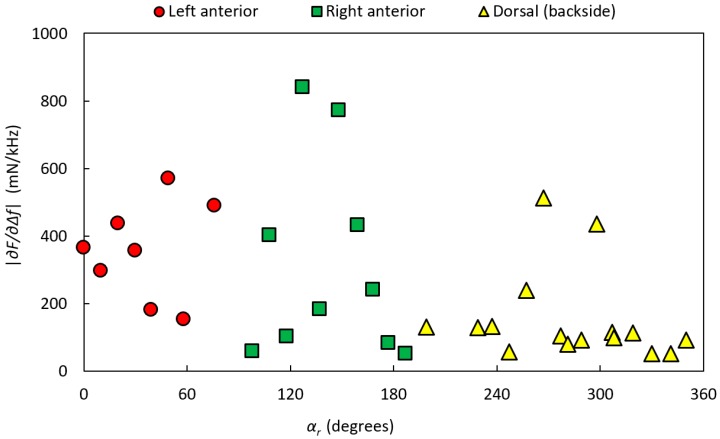
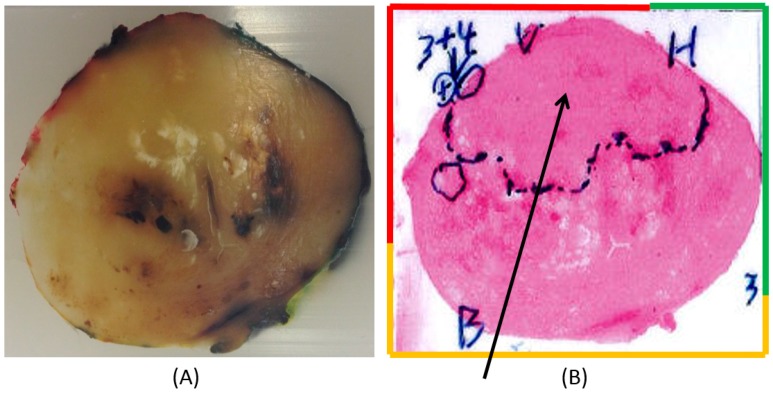
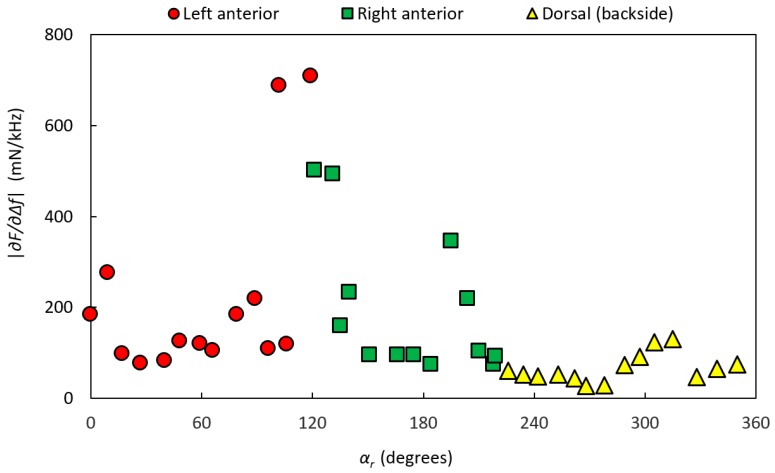
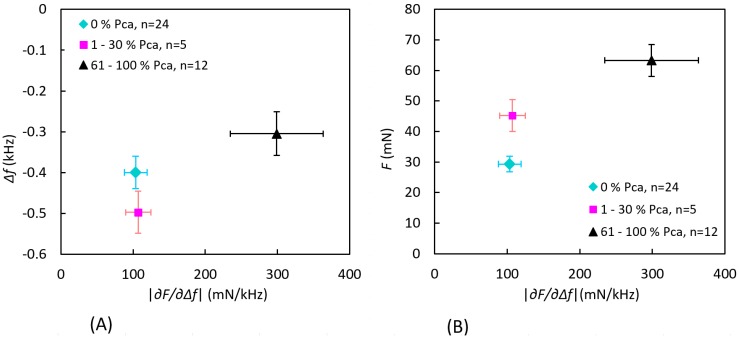
Tumors in the human prostate are usually stiffer compared to surrounding non-malignant glandular tissue, and tactile resonance sensors measuring stiffness can be used to detect prostate cancer. To explore this further, we used a tactile resonance sensor system combined with a rotatable sample holder where whole surgically removed prostates could be attached to detect tumors on, and beneath, the surface ex vivo. Model studies on tissue phantoms made of silicone and porcine tissue were performed. Finally, two resected human prostate glands were studied. Embedded stiff silicone inclusions placed 4 mm under the surface could be detected in both the silicone and biological tissue models, with a sensor indentation of 0.6 mm. Areas with different amounts of prostate cancer (PCa) could be distinguished from normal tissue (p < 0.05), when the tumor was located in the anterior part, whereas small tumors located in the dorsal aspect were undetected. The study indicates that PCa may be detected in a whole resected prostate with an uneven surface and through its capsule. This is promising for the development of a clinically useful instrument to detect prostate cancer during surgery.

Keywords: piezoelectric sensor; prostate cancer; resonance sensor; tactile sensor; tissue stiffness.


Conflict of interest statement

The authors report no conflicts of interest. The authors alone are responsible for the content and writing of the paper. The founding sponsors had no role in the design of the study; in the collection, analyses, or interpretation of data; in the writing of the manuscript; or in the decision to publish the results.

Figures

Figure 1
Figure 1
The sensor system set-up with a sample of porcine muscle mounted in the rotatable holder, ready for measurements. (1) The rotational stage to control the contact angle α. and the angle of the sensor movement, αsm; (2) USB-microscope; (3) The cantilever strain gauge; (4) A sensor for measuring the rotation angle αr.
Figure 2
Figure 2
Illustration of a silicone sphere with embedded inclusions mounted in the rotatable sample holder. The movement of the sensor (not shown) for each MP was always kept perpendicular to the surface of the silicone. This was ensured by the rotation of the rotational stage by an angle αsm.
Figure 3
Figure 3
The resected radical prostatectomy specimen shortly after surgery from a 70-year-old man (Prostate 1 (P-1)). (A) Prostate gland without dye; (B) Dyed (green and red) on the (right and left) anterior side, apex is pointing down; (C) Dyed (yellow) on the dorsal side (the part facing the rectum).
Figure 4
Figure 4
Illustration showing how the enlarged semi-circle together with the millimeter grid was used to estimate the proportion of tumor tissue within a given area near and below the surface for each measurement point. (A) A hematoxylin–eosin-stained tissue slice with the pathologists’ markings of areas with tumor tissue. The diameter of the prostate in the photomicrograph in (A) is approximately 40 mm; (B) A blow-up of the tissue area marked with a square in (A) for a certain measurement point in a high-resolution digital image.
Figure 5
Figure 5
The stiffness parameter |F/f| with the indentation depth I = 0.6 mm, measured on a homogeneous silicone sphere as a function of the clamping force, FC. The measurements were made at an angle of sensor movement αsm = 0°. To the right, two pictures illustrate the visible effect of FC on the silicone sphere.
Figure 6
Figure 6
The logarithm of the stiffness parameter log|F/f| (mean ± SD, n = 6) at different angles of sensor movements αsm (see insert) on silicone spheres with inclusions with the diameter D = 6 mm but at different depths, d. Measurements made between the inclusions are marked “No inclusions”. The standard deviations (SD < 8.4 mN/kHz) are included in the graph.
Figure 7
Figure 7
The logarithm of the stiffness parameter log|F/f| (mean ± SD, n = 6) against the ratio between the depths d of the inclusion and the diameter D of the inclusion, d/D, at αsm = 0° on inclusions of different sizes and at different depths in a silicon sphere showing that the inclusions could be detected up to about d/D = 0.6. The standard deviations are included in the graph.
Figure 8
Figure 8
The stiffness parameter |F/f| for four separate measurement series as a function of the clamping force, FC measured on tissue from a porcine muscle with the indentation depth I = 0.6 mm and at the angle of sensor movement αsm = 0°. To the right, two pictures are illustrating the visible effect of FC on the tissue.
Figure 9
Figure 9
The stiffness parameter |F/f| on a sample of porcine muscle tissue with a hidden inclusion of silicone with Shore hardness 88, positioned at the rotation angle αr = −5° and located at a depth d = 3 ± 0.5 mm below the surface. The clamping force was FC = 425 ± 39 mN.
Figure 10
Figure 10
(A,B) Photographs of slices of the left and right sides of P-1, embedded in paraffin; (C,D) Scans of the corresponding photomicrographs. The original diameter of P-1 was 50 mm. Multiple areas of dorsal parts of the prostate identified as tumor tissue with a Gleason score of 6 (3 + 3) are marked with circles. The arrow in (A) shows one of the punch holes where tissue was removed after the stiffness analysis for further pathological assessments. In (A,B), the periphery of the sliced tissue shows traces of the red, green, and yellow staining of the surface made by the pathologist. The frame surrounding (C,D) is colored red, green, and yellow correspondingly.
Figure 11
Figure 11
The stiffness parameter |F/f| of P-1 as a function of the rotational angle, αr, along the circumference of the gland. The prostate was clamped in the rotatable holder with the clamping force FC = 760 ± 99 mN. The data are divided into dorsal, left anterior, and right anterior according to the dyed areas made by the pathologist.
Figure 12
Figure 12
A slice of Prostate 2 (P-2). The diameter of P-2 was 40 mm. (A) A slice embedded in paraffin and stained at the periphery in order to locate the left anterior (red), right anterior (green), and dorsal (yellow) parts of the prostate. (B) Scanned photomicrograph of a section of the corresponding prostate slice. The arrow points out a large area marked by the pathologist in the anterior aspect containing cancer. In the left anterior, a tumor with a Gleason score of 7 (3 + 4) is also pointed out.
Figure 13
Figure 13
The stiffness parameter |F/f| of P-2 as a function of the rotational angle, αr, along the circumference of the gland. The prostate gland was clamped with the clamping force FC = 460 ± 85 mN in the rotatable holder. The data are divided into dorsal, left anterior, and right anterior according to the dyed areas made by the pathologist.
Figure 14
Figure 14
Measured values grouped by the amount of PCa occurrence within a semicircle with a radius of 3.5 mm at each measurement point for P-2. The data show the mean value of the stiffness parameter |F/f| ± standard error of the mean as a function of (A) the frequency shift Δf and (B) the contact force F. There were no findings in the interval 31–60% PCa.

References

    1. Omata S., Terunuma Y. New tactile sensor like the human hand and its applications. Sens. Actuators A Phys. 1992;35:9–15. doi: 10.1016/0924-4247(92)87002-X. - DOI
    1. Jalkanen V., Andersson B.M., Bergh A., Ljungberg B., Lindahl O.A. Resonance sensor measurements of stiffness variations in prostate tissue in vitro—A weighted tissue proportion model. Physiol. Meas. 2006;27:1373–1386. doi: 10.1088/0967-3334/27/12/009. - DOI - PubMed
    1. Jalkanen V., Andersson B.M., Bergh A., Ljungberg B., Lindahl O.A. Prostate tissue stiffness as measured with a resonance sensor system: A study on silicone and human prostate tissue in vitro. Med. Biol. Eng. Comput. 2006;44:593–603. doi: 10.1007/s11517-006-0069-6. - DOI - PubMed
    1. Lindahl O.A., Ängquist K.-A., Ödman S. Impression technique for the assessment of oedema—Technical improvement and methodological evaluation of a new technique. Med. Biol. Eng. Comput. 1991;29:591–597. doi: 10.1007/BF02446090. - DOI - PubMed
    1. Sasai S., Zhen Y.-X., Suetake T., Tanita Y., Omata S., Tagami H. Palpation of the skin with a robot finger: An attempt to measure skin stiffness with a probe loaded with a newly developed tactile vibration sensor and displacement sensor. Skin Res. Technol. 1999;5:237–246. doi: 10.1111/j.1600-0846.1999.tb00136.x. - DOI

LinkOut - more resources