

Global Association of Air Pollution and Cardiorespiratory Diseases: A Systematic Review, Meta-Analysis, and Investigation of Modifier Variables
- PMID: 29072932
- PMCID: PMC5922189
- DOI: 10.2105/AJPH.2017.303839
Global Association of Air Pollution and Cardiorespiratory Diseases: A Systematic Review, Meta-Analysis, and Investigation of Modifier Variables
Abstract
Background: Little is known about the health risks of air pollution and cardiorespiratory diseases, globally, across regions and populations, which may differ because of external factors.
Objectives: We systematically reviewed the evidence on the association between air pollution and cardiorespiratory diseases (hospital admissions and mortality), including variability by energy, transportation, socioeconomic status, and air quality.
Search methods: We conducted a literature search (PubMed and Web of Science) for studies published between 2006 and May 11, 2016.
Selection criteria: We included studies if they met all of the following criteria: (1) considered at least 1 of these air pollutants: carbon monoxide, sulfur dioxide, nitrogen dioxide, ozone, or particulate matter (PM2.5 or PM10); (2) reported risk for hospital admissions, mortality, or both; (3) presented individual results for respiratory diseases, cardiovascular diseases, or both; (4) considered the age groups younger than 5 years, older than 65 years, or all ages; and (5) did not segregate the analysis by gender.
Data collection and analysis: We extracted data from each study, including location, health outcome, and risk estimates. We performed a meta-analysis to estimate the overall effect and to account for both within- and between-study heterogeneity. Then, we applied a model selection (least absolute shrinkage and selection operator) to assess the modifier variables, and, lastly, we performed meta-regression analyses to evaluate the modifier variables contributing to heterogeneity among studies.
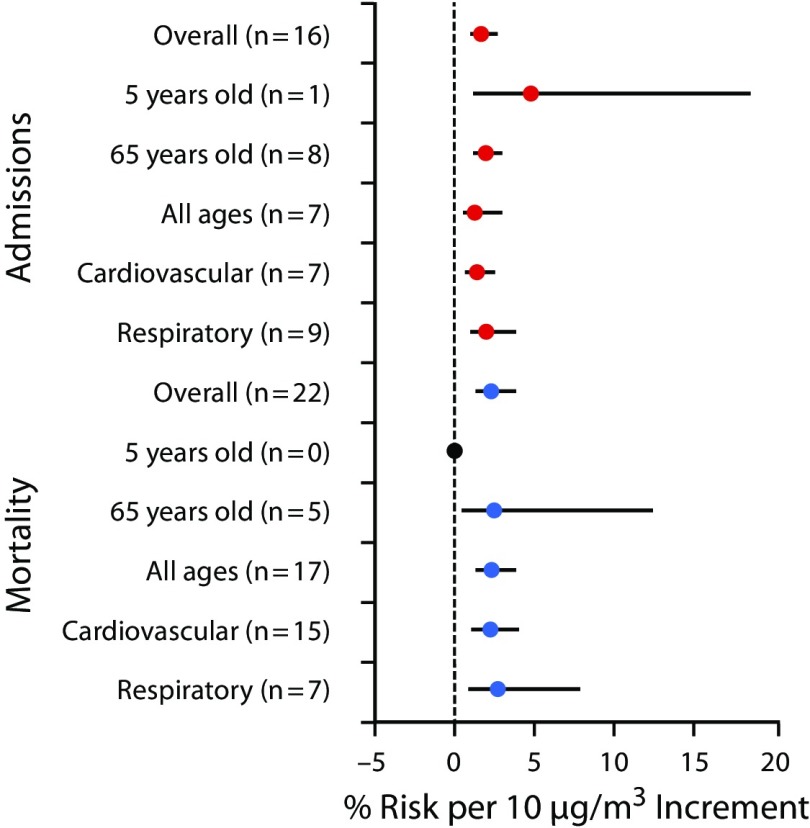
Main results: We assessed 2183 studies, of which we selected 529 for in-depth review, and 70 articles fulfilled our study inclusion criteria. The 70 studies selected for meta-analysis encompass more than 30 million events across 28 countries. We found positive associations between cardiorespiratory diseases and different air pollutants. For example, when we considered only the association between PM2.5 and respiratory diseases ( Figure 1 , we observed a risk equal to 2.7% (95% confidence interval = 0.9%, 7.7%). Our results showed statistical significance in the test of moderators for all pollutants, suggesting that the modifier variables influence the average cardiorespiratory disease risk and may explain the varying effects of air pollution.
Conclusions: Variables related to aspects of energy, transportation, and socioeconomic status may explain the varying effect size of the association between air pollution and cardiorespiratory diseases. Public Health Implications. Our study provides a transferable model to estimate the health effects of air pollutants to support the creation of environmental health public policies for national and international intervention.
Figures
References
-
- World Health Organization. Global Health Observatory. 2014. Available at: http://www.who.int/gho/ncd/mortality_morbidity/en. Accessed June 10, 2014.
-
- Branis M, Linhartova M. Association between unemployment, income, education level, population size and air pollution in Czech cities: evidence for environmental inequality? A pilot national scale analysis. Health Place. 2012;8(5):1100–1104. - PubMed
-
- Makri A, Stilianakis N. Vulnerability to air pollution health effects. Int J Hyg Environ Health. 2008;211(3-4):326–336. - PubMed
Publication types
MeSH terms
Substances
LinkOut - more resources
Full Text Sources
Other Literature Sources
Medical
Miscellaneous
