

Focal Liver Lesions: Computer-aided Diagnosis by Using Contrast-enhanced US Cine Recordings
- PMID: 29072980
- PMCID: PMC5831265
- DOI: 10.1148/radiol.2017170365
Focal Liver Lesions: Computer-aided Diagnosis by Using Contrast-enhanced US Cine Recordings
Abstract
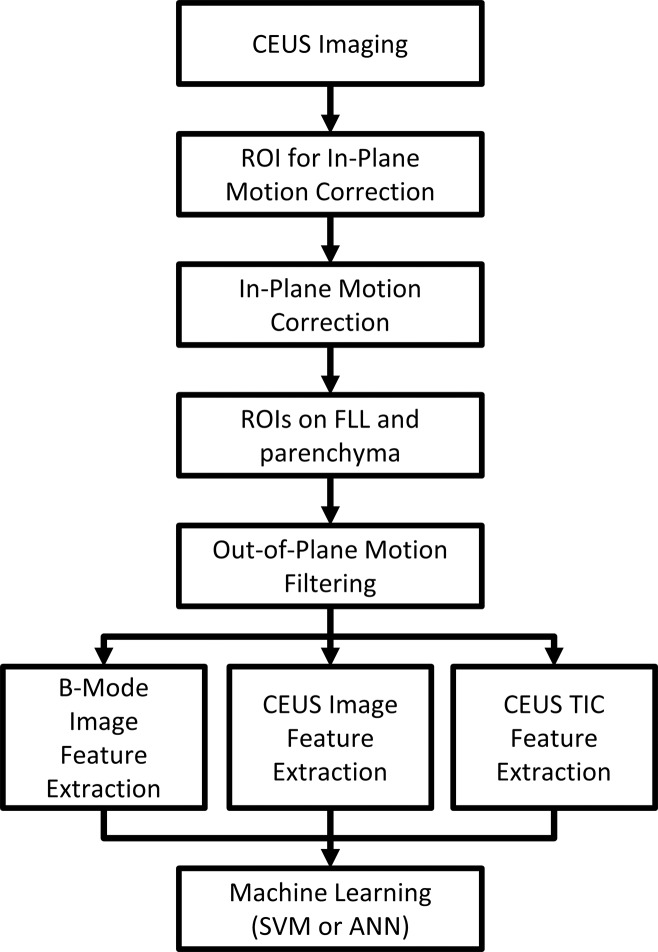
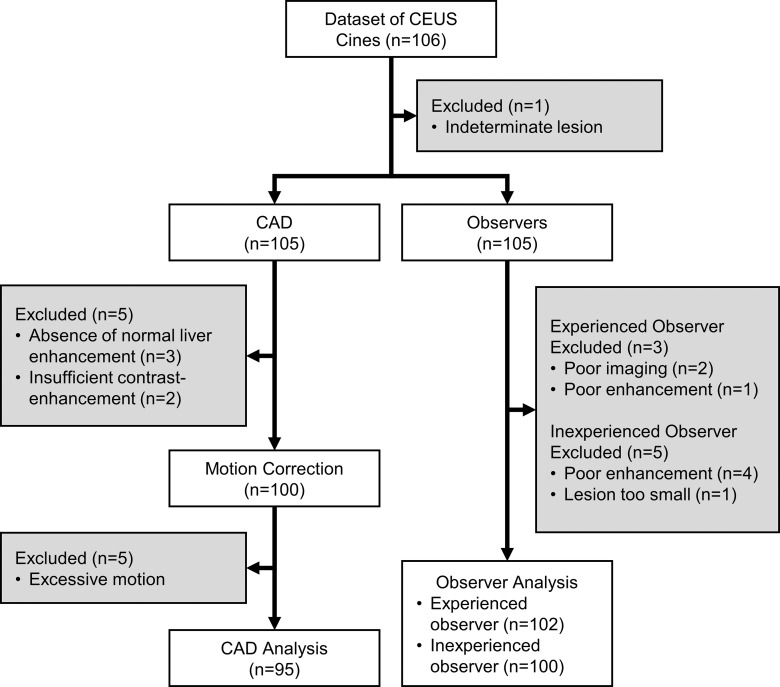
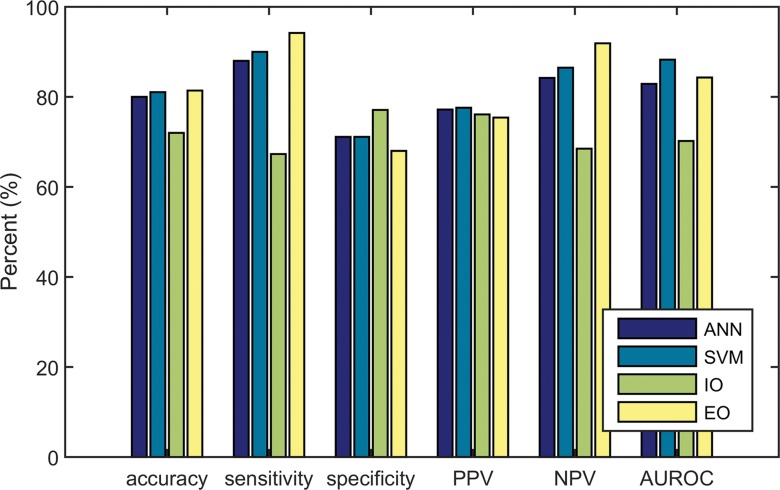
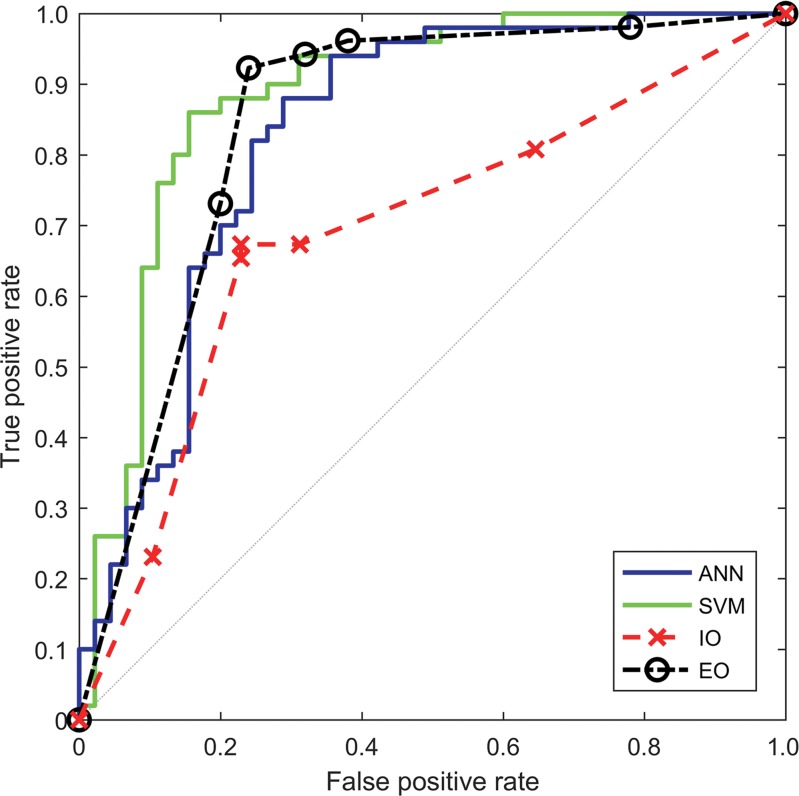
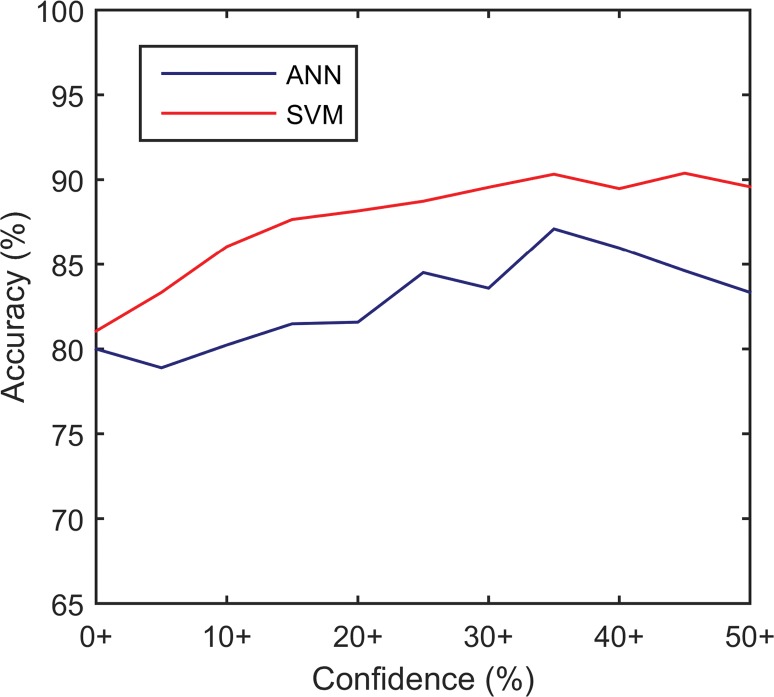
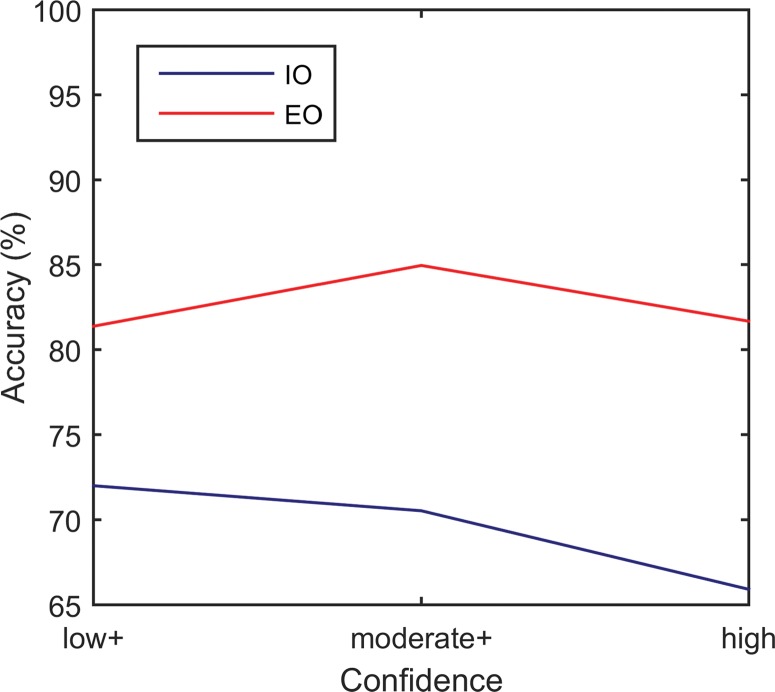
Purpose To assess the performance of computer-aided diagnosis (CAD) systems and to determine the dominant ultrasonographic (US) features when classifying benign versus malignant focal liver lesions (FLLs) by using contrast material-enhanced US cine clips. Materials and Methods One hundred six US data sets in all subjects enrolled by three centers from a multicenter trial that included 54 malignant, 51 benign, and one indeterminate FLL were retrospectively analyzed. The 105 benign or malignant lesions were confirmed at histologic examination, contrast-enhanced computed tomography (CT), dynamic contrast-enhanced magnetic resonance (MR) imaging, and/or 6 or more months of clinical follow-up. Data sets included 3-minute cine clips that were automatically corrected for in-plane motion and automatically filtered out frames acquired off plane. B-mode and contrast-specific features were automatically extracted on a pixel-by-pixel basis and analyzed by using an artificial neural network (ANN) and a support vector machine (SVM). Areas under the receiver operating characteristic curve (AUCs) for CAD were compared with those for one experienced and one inexperienced blinded reader. A third observer graded cine quality to assess its effects on CAD performance. Results CAD, the inexperienced observer, and the experienced observer were able to analyze 95, 100, and 102 cine clips, respectively. The AUCs for the SVM, ANN, and experienced and inexperienced observers were 0.883 (95% confidence interval [CI]: 0.793, 0.940), 0.829 (95% CI: 0.724, 0.901), 0.843 (95% CI: 0.756, 0.903), and 0.702 (95% CI: 0.586, 0.782), respectively; only the difference between SVM and the inexperienced observer was statistically significant. Accuracy improved from 71.3% (67 of 94; 95% CI: 60.6%, 79.8%) to 87.7% (57 of 65; 95% CI: 78.5%, 93.8%) and from 80.9% (76 of 94; 95% CI: 72.3%, 88.3%) to 90.3% (65 of 72; 95% CI: 80.6%, 95.8%) when CAD was in agreement with the inexperienced reader and when it was in agreement with the experienced reader, respectively. B-mode heterogeneity and contrast material washout were the most discriminating features selected by CAD for all iterations. CAD selected time-based time-intensity curve (TIC) features 99.0% (207 of 209) of the time to classify FLLs, versus 1.0% (two of 209) of the time for intensity-based features. None of the 15 video-quality criteria had a statistically significant effect on CAD accuracy-all P values were greater than the Holm-Sidak α-level correction for multiple comparisons. Conclusion CAD systems classified benign and malignant FLLs with an accuracy similar to that of an expert reader. CAD improved the accuracy of both readers. Time-based features of TIC were more discriminating than intensity-based features. © RSNA, 2017 Online supplemental material is available for this article.
Figures
References
-
- Bartolotta TV, Taibbi A, Midiri M, Matranga D, Solbiati L, Lagalla R. Indeterminate focal liver lesions incidentally discovered at gray-scale US: role of contrast-enhanced sonography. Invest Radiol 2011;46(2):106–115. - PubMed
-
- Claudon M, Dietrich CF, Choi BI, et al. Guidelines and good clinical practice recommendations for Contrast Enhanced Ultrasound (CEUS) in the liver - update 2012: a WFUMB-EFSUMB initiative in cooperation with representatives of AFSUMB, AIUM, ASUM, FLAUS and ICUS. Ultrasound Med Biol 2013;39(2):187–210. - PubMed
-
- Friedrich-Rust M, Klopffleisch T, Nierhoff J, et al. Contrast-enhanced ultrasound for the differentiation of benign and malignant focal liver lesions: a meta-analysis. Liver Int 2013;33(5):739–755. - PubMed
-
- von Herbay A, Westendorff J, Gregor M. Contrast-enhanced ultrasound with SonoVue: differentiation between benign and malignant focal liver lesions in 317 patients. J Clin Ultrasound 2010;38(1):1–9. - PubMed
Publication types
MeSH terms
Substances
Grants and funding
LinkOut - more resources
Full Text Sources
Other Literature Sources
Medical
Miscellaneous
