. 2017 Oct 24;114(43):11285-11290.
doi: 10.1073/pnas.1712829114. Epub 2017 Oct 9.

Distinct ice patterns on solid surfaces with various wettabilities

Affiliations

Distinct ice patterns on solid surfaces with various wettabilities

Jie Liu et al. Proc Natl Acad Sci U S A. .

Abstract

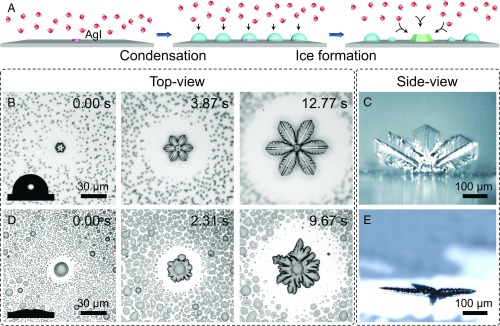
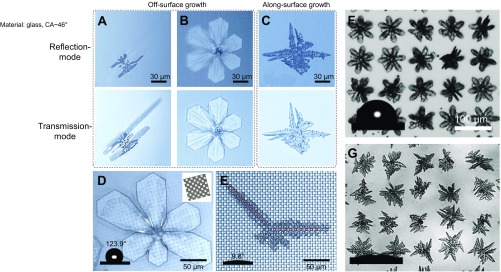
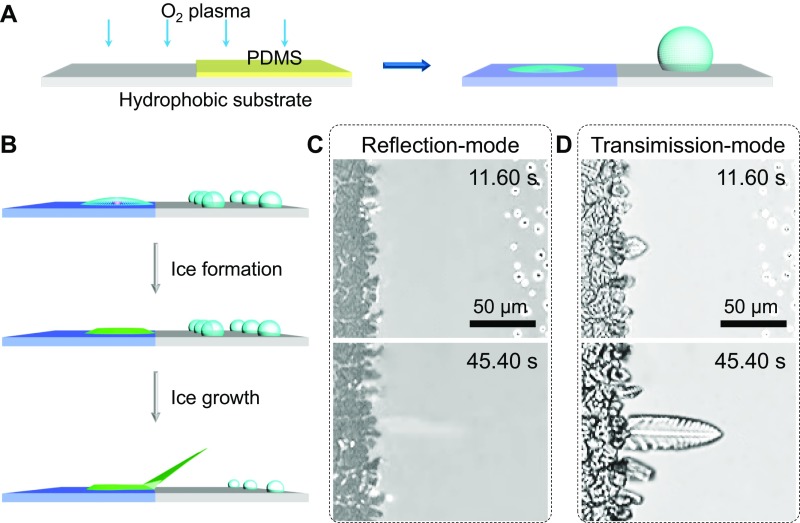
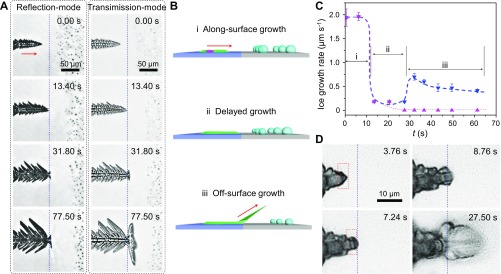
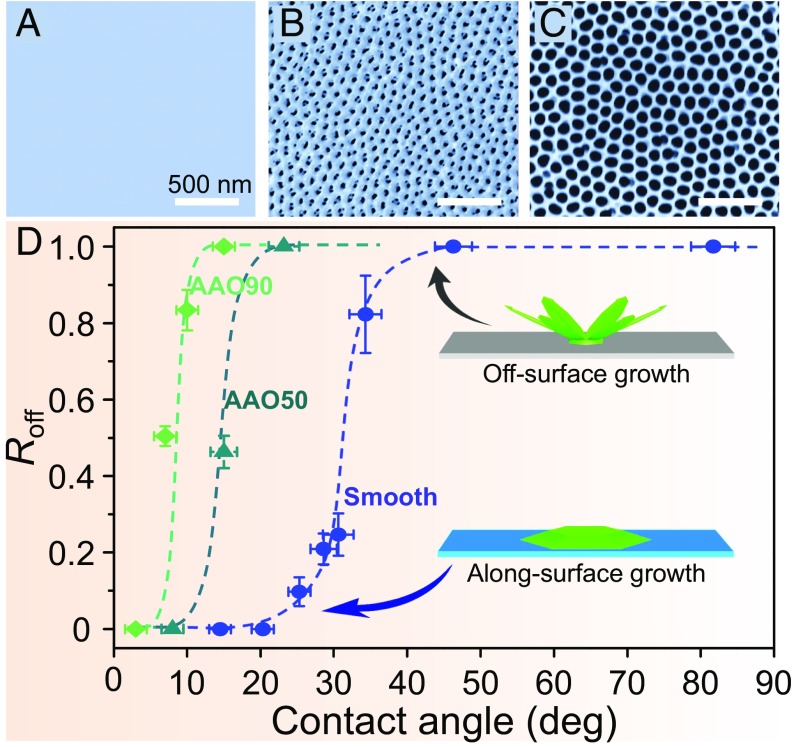
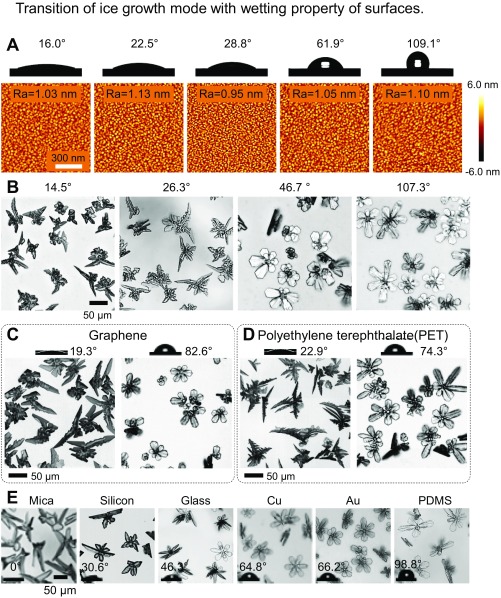
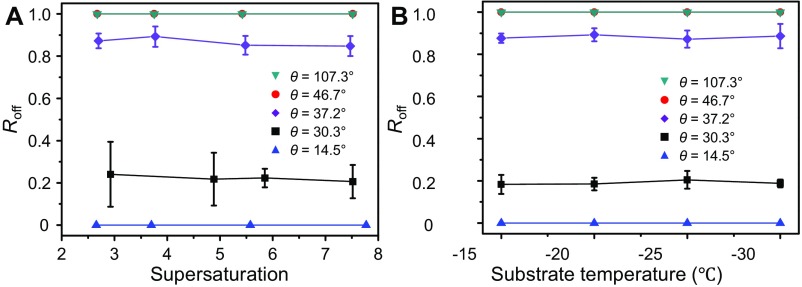
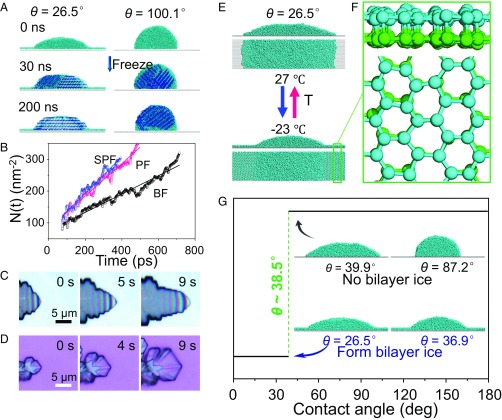
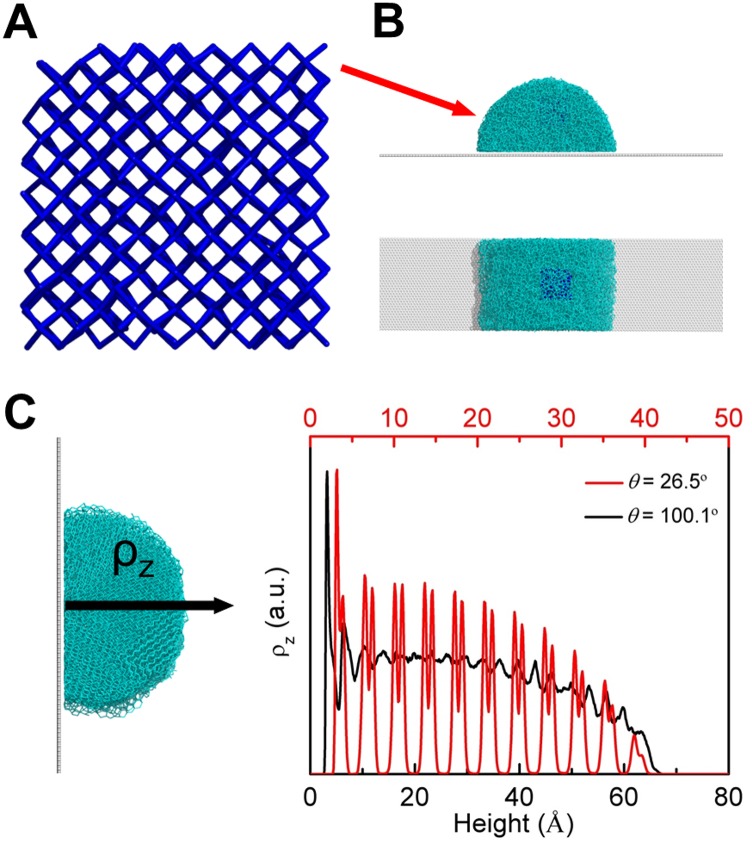
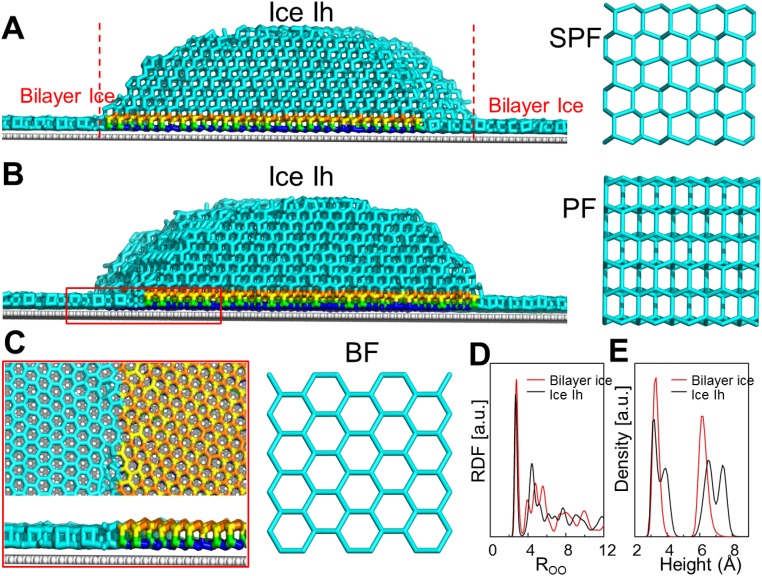
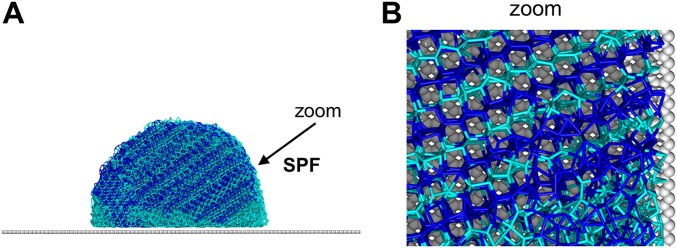
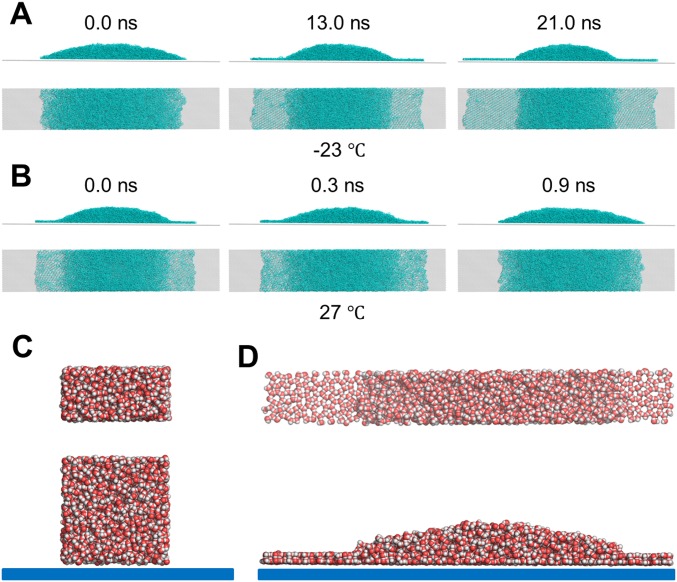
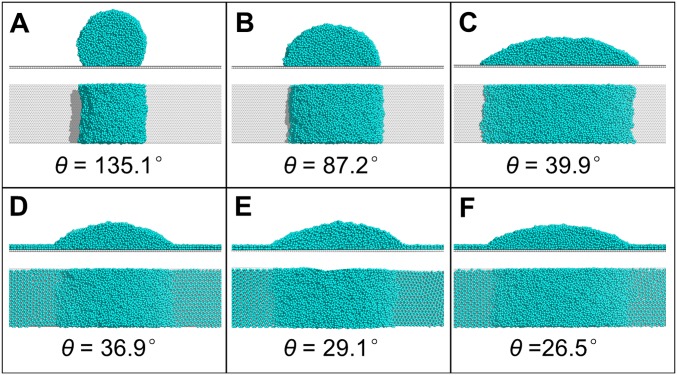
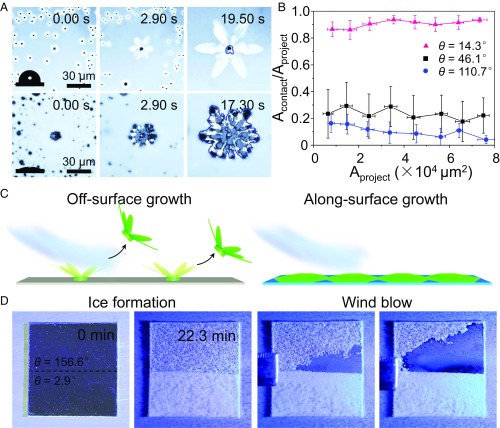
No relationship has been established between surface wettability and ice growth patterns, although ice often forms on top of solid surfaces. Here, we report experimental observations obtained using a process specially designed to avoid the influence of nucleation and describe the wettability-dependent ice morphology on solid surfaces under atmospheric conditions and the discovery of two growth modes of ice crystals: along-surface and off-surface growth modes. Using atomistic molecular dynamics simulation analysis, we show that these distinct ice growth phenomena are attributable to the presence (or absence) of bilayer ice on solid surfaces with different wettability; that is, the formation of bilayer ice on hydrophilic surface can dictate the along-surface growth mode due to the structural match between the bilayer hexagonal ice and the basal face of hexagonal ice (ice Ih), thereby promoting rapid growth of nonbasal faces along the hydrophilic surface. The dramatically different growth patterns of ice on solid surfaces are of crucial relevance to ice repellency surfaces.

Keywords: antiicing; ice crystal; ice growth; molecular dynamics simulation; surface wettability.


Conflict of interest statement

The authors declare no conflict of interest.

Figures

Fig. 1.
Fig. 1.
Two ice growth modes on hydrophilic and hydrophobic surfaces. (A) A schematic illustration of the experimental design used to investigate the effect of solid surfaces on ice growth via the introduction of ice nucleation active sites (AgI nanoparticles) on solid surfaces. This allowed ice nucleation to occur at almost the same time and temperature over the entire solid surfaces in the same environment. (B) Selected snapshots captured at different times using an optical microscope coupled to a high-speed camera. These top-view images show the growth process of six-leaf clover-like ice on a hydrophobic surface (θ = 107.3°). (C) A side-view snapshot that shows the morphology of the ice on the same hydrophobic surface produced by the OSG mode. (D) Selected snapshots captured at different times using an optical microscope coupled to a high-speed camera. These top-view images show the growth process of sunflower-like ice on a hydrophilic surface (θ = 14.5°). (E) A side-view snapshot of the ice morphology on the same hydrophilic surface resulting from the ASG mode. The surface temperature is −15 °C, and the supersaturation is 5.16.
Fig. S1.
Fig. S1.
Methods for distinguishing the growth modes of ice on solid surfaces. (AC) Differences between the outline of the ice–substrate interface and the ice can be used to distinguish between ice growth modes. (A and B) Two types of ice morphology were seen on solid surfaces, resulting from the initial orientation of the ice crystals on the surfaces. We observed the ice morphology on a transparent glass slide (θ = 46.7°) through an inverted optical microscope. The ice–substrate interface can be seen in (Upper) reflection mode and appears dark because little light is reflected back. By contrast, the profile of the ice can be clearly identified in (Lower) transmission mode. Clearly, for both types of ice morphologies, the outline of the ice–substrate interface is smaller than that of the ice, implying that both types of ice exhibit OSG mode. (C) The outline of the ice–substrate interface of ASG ice is almost the same as that of the ice itself. (D and E) The dependence of the ice morphology on the surface roughness can also be used to distinguish between ice growth modes. (D) A microscopic snapshot showing that the morphology of OSG ice bears little similarity to the surface structure (i.e., square micropores with a size of 5 μm and depth of 5 μm, θ = 123.9°). Inset shows the orientation of the surface structure. (E) A microscopic snapshot showing that the growth orientation of ASG ice is completely consistent with the surface structure (i.e., square micropores with a size of 5 μm and depth of 5 μm, θ ∼ 9.8°), as indicated by the red dashed lines. Distinctive ice growth modes of ice on (F) hydrophobic surface and (G) hydrophilic surface with different wetting properties when the distribution of the silver iodide nanoparticles was controlled. The distance of adjacent nucleation active sites is 80 μm. The surface temperature is −15 °C, and the supersaturation is 5.16.
Fig. S2.
Fig. S2.
Preparation of a hybrid hydrophobic/hydrophilic surface and the effect of the initial shape of the ice on the growth mode. (A) A schematic showing the hybrid surface with one hydrophilic half (θ = 2.9°) and another hydrophobic half (θ = 107.3°) designed to explore the different growth modes of ice on surfaces with different wettabilities. (B) A schematic illustration showing that the ice evolved from a water droplet located on the hydrophilic region and along the boundary would demonstrate a flat initial shape, which is determined by the contact angle of the hydrophilic part. The ice exhibits the OSG mode at the boundary when its growth is oriented toward the hydrophobic side, indicating that the ice shape has very little effect on the ice growth mode. (C) Selected snapshots taken using an inverted microscope in reflection mode showing that when ice grows over the hydrophobic/hydrophilic boundary, no ice–substrate interface could be observed. (D) The outline of ice corresponding to that shown in C observed using an inverted microscope in transmission mode. The turned-up ice on the hydrophobic side indicates that the initial shape of the ice is not the main determining factor of the ice growth mode. The surface temperature is −15 °C, and the supersaturation is 5.16.
Fig. S3.
Fig. S3.
Effects of the surface wettability on the ice growth mode. (A) Reflection-mode images taken using inverted microscopy showing the evolution of the ice–substrate interface when the ice advances from a hydrophilic region to a hydrophobic region. Ice grew on the hydrophilic surface from 0.00 to 13.40 s, and subsequently, the advancing edge of the ice–substrate interface was restricted and gradually became parallel to the boundary of the two regions until 31.80 s. Then, until 77.50 s, the ice–substrate interface did not shift at all. Transmission-mode images reveal a small ice hand stretching away from the surface at 31.80 s, which subsequently continued to grow away from the surface, as shown in the image taken at 77.50 s. (B) Ice experiences three corresponding stages as it grows from hydrophilic regions to hydrophobic regions: (i) ASG, (ii) delayed growth, and (iii) OSG. (C) Accompanied by a switch in the ice growth mode, the growth rates of both projective ice (rice) and the ice–substrate interface (rinterface) advancing edge changed. Both growth rates decreased from 2.3 ± 0.2 μm⋅s−1 to nearly 0 instantly when the ice grew to the boundary, and the growth mode switched from stage i to ii. Ice growth was delayed for ∼20 s by the high barrier of the boundary during stage ii, whereas rinterface = 0 and rice > 0 during stage iii. The decrease in rice in stage iii might be attributable to the increasing distance between the ice edge and the substrate. (D) Selected snapshots captured by high-speed camera showing the point at which ice transitions from the ASG mode to the OSG mode at a hydrophobic/hydrophilic boundary in detail. An obvious accumulation process was observed as the ice advanced over the boundary from the hydrophilic to the hydrophobic region. The surface temperature is −15 °C, and the supersaturation is 5.16.
Fig. 2.
Fig. 2.
Dependence of the ice growth mode on the surface wettability and roughness. Surfaces with different roughness were used to detect the ice growth mode on solid surfaces: (A) a nanometer-scale smooth surface (aluminum surface), (B) AAO-50 (AAO with a mean pore size of 50 nm), and (C) AAO-90 (AAO with a mean pore size of 90 nm). The average pitch of the nanopores of all AAO samples is 100 nm. (D) The ASG-to-OSG transition at a critical contact angle. On the smooth surface (blue dashed line), the transition from the ASG mode to the OSG mode occurs at θ = 32.5° ± 1.9°. Roff represents the appearance probability of OSG ice. As the mean pore size increases, the transition shifts to a smaller contact angle. We have investigated about 400 ice growth events to get the mean values of each dot. The different colored guide lines correspond to the substrates marked with the same color. Insets present the two distinct growth modes (ASG and OSG) of ice on solid surfaces. The surface temperature is −15 °C, and the supersaturation is 5.16.
Fig. S4.
Fig. S4.
Morphological details of ice on solid surfaces made of different materials having different wettabilities. (A) The water contact angles of nanosmooth surfaces (aluminum surfaces modified with FAS) could be changed by applying oxygen plasma for different durations. Corresponding AFM images were taken and show that the surface roughness on each surface modified with O plasma is almost the same despite the change in the contact angle. (B) Microscopic top-view images showing the ice morphology on smooth aluminum surfaces with different wettabilities. When the contact angle exceeds 32.5° ± 1.9°, ice undergoes the OSG mode. (C and D) The ice morphology on graphene and PET. When the contact angle is 19.3° on the graphene surface and 22.9° on the PET surface, the ice follows the ASG mode. By contrast, the ice exhibits the OSG mode when the contact angle is 82.6° on the graphene surface and 74.3° on the PET surface. (E) Ice grown on different surfaces, such as glass slide, copper, gold, and PDMS, follows the OSG mode because the contact angles of these materials are all >32.5° ± 1.9°. By contrast, ice grown on mica exhibits the ASG mode. The surface temperature is −15 °C, and the supersaturation is 5.16.
Fig. S5.
Fig. S5.
Effects of supersaturation and temperature on the ice growth mode on solid surfaces. Roff represents the appearance probability of OSG ice. (A) Evolution of Roff with supersaturation (the substrate temperature was −15 °C) showing that Roff remains almost unchanged as the supersaturation varied from 2.5 to 8 on flat aluminum surfaces with different contact angles (14.5° to 107.3°). (B) Evolution of Roff with the degree of supercooling showing that the value of Roff remains nearly constant when on surfaces with contact angles ranging from 14.5° to 107.3°. Clearly, neither the supersaturation nor the temperature strongly influence the ice growth mode on surfaces. Indeed, their effects were never able to overcome the gap in Roff caused by the surface wettability. We have investigated about 400 ice growth events to get the mean values of each dot.
Fig. 3.
Fig. 3.
Understanding the mechanism underlying wettability-dependent ice growth modes. (A) Snapshots from the MD simulations of ice growth on a hydrophilic surface (θ = 26.5° ± 1.2°) or hydrophobic surface (θ = 100.1° ± 1.0°). After equilibration, the ice formed on the hydrophilic surface turns into a single crystal with the SPF and PF perpendicular to the substrate, whereas the ice formed on the hydrophobic surface becomes a polycrystal. (B) The number of water molecules per unit area within one of the three crystal faces of hexagonal ice Ih at −23 °C versus the simulation time: the BF (black curve), PF (red curve), and SPF (blue curve), for ice grown on the hydrophilic surface. (C and D) Selected snapshots captured using an optical microscope, revealing details of the ice growing (layer-by-layer fashion) in ASG mode (on mica, θ = 0°) and OSG mode (on a silicon wafer, θ = 63.6°) on solid surfaces at −20 °C. The supersaturation is 2.36. (E) Two illustrations (side and top views) of the simulation system showing the reversible (Lower) appearance and (Upper) disappearance of bilayer ice on a hydrophilic surface at low (−23 °C) and high temperatures (27 °C), respectively. (F) Side and top views of bilayer ice (the zoomed-in area marked by the rectangular box in E, Lower). (G) In the MD simulation, the critical contact angle is 38.5° for the formation of bilayer ice on a hydrophilic surface at −23 °C. The four Insets show snapshots of four independent simulations on solid surfaces with different wettabilities.
Fig. S6.
Fig. S6.
MD simulations of water growth on a surface. (A) An ice core (blue) with 512 water molecules was introduced into the water droplet (B) to study the effects of substrate wettability on the ice growth mode at 250 K. (B) A (Upper) side view and (Lower) top view of the system are shown. (C) Density profile in the z direction (defined in Left) for water molecules near a hydrophilic surface, which show a characteristic double-peak behavior (red line in Right), indicating that the BF is parallel to the substrate. For comparison, the density profile in the z direction for water molecules near a hydrophobic surface (black line) shows no strong characteristics, indicating that a polycrystal is formed.
Fig. S7.
Fig. S7.
Equilibrium structure of ice on a hydrophilic surface. (A and B) A side view snapshot of the system with a hydrophilic surface (θ = 26.5° ± 1.2°) in which all water molecules are in the ice phase. Here the SPF and PF (A and B, Right) are perpendicular to the solid substrate. The first two layers near the surface are shown in C. Bilayer hexagonal ice is seen in the area surrounding the droplet. The first two water layers underneath the droplet are in the ice Ih phase, and the BF (C, Right) is parallel to the substrate. (D) Radical distribution functions (RDFs) for water and water in bilayer ice outside the droplet (red line) and in the first two layers underneath the droplet (black line). The RDFs for the water in bilayer ice and water in the first two layers underneath the water droplet exhibit peaks at distances of r = 2.76 Å and r = 2.69 Å, respectively, which are very similar. (E) Density profiles along the z axis for water molecules in bilayer ice outside the droplet (red line) and the first two layers under the droplet (black line). The density profile in the z direction for water molecules near the hydrophilic surface in the first two layers under the droplet shows characteristic double-peak behavior, indicating that it is in the ice Ih phase and that its BF is parallel to the substrate. By contrast, the density profile in the z direction for water molecules near the hydrophilic surface in bilayer ice outside the droplet shows single-peak behavior.
Fig. S8.
Fig. S8.
Equilibrium structure of ice on a hydrophobic surface. (A) A side-view snapshot of the system with a hydrophobic surface (θ = 100.1° ± 1.0°) in which all water molecules are in the ice phase. (B) Polycrystalline ice formed at the late equilibrium stage (∼200 ns) and a magnified zoom-in image of one of its SPFs.
Fig. S9.
Fig. S9.
MD simulations of a water droplet on a hydrophilic surface at different temperatures. (A) Snapshots of the MD simulations of a water droplet (using mW model) on a hydrophilic surface (θ=26.5°±1.2°) at 250 K after preequilibration of the initial structure at 300 K for 1 ns. (B) Snapshots of the MD simulations of a water droplet on the hydrophilic surface (θ=26.5°±1.2°) at 300 K using the initial structure taken from the MD simulation at 250 K performed as described above. Clearly, bilayer ice formed on the hydrophilic surface at low temperature (250 K) but disappeared as the temperature increased (300 K). This process is reversible. (C and D) Independent MD simulations of water droplets on the hydrophilic surface with the TIP4P/2005 water model were also performed. (Upper) Top view and (Lower) side views of the initial water droplet on a smooth hydrophilic substrate. Here the oxygen–wall interaction is described by the 9–3 LJ potential function, U(r)=ε[(σ/r)9(σ/r)3], where the LJ parameters are σOwl=2.2578Å and εOwl=8.0698 kcal⋅mol−1. All intermolecular interactions, including the long-range charge–charge interaction and the LJ interaction between oxygen atoms, are truncated at 10.0 Å. (D) (Upper) Top and (Lower) side views of the water droplet on the smooth substrate at the end of the MD simulation (10 ns). Bilayer hexagonal ice is observed, indicating that the formation of bilayer ice on the substrate is not sensitive to the water model (mW or TIP4P/2005).
Fig. S10.
Fig. S10.
Effects of surface wettability on bilayer ice formation on solid surfaces. Snapshots of the MD simulations of water droplets on surfaces with different wettabilities at 250 K. When θ36.9° (DF), bilayer ice is observed on the surface at 250 K. Note that this bilayer ice disappears when θ39.9° (AC), indicating that the transition point for the observation of bilayer hexagonal ice is located at 38.5°±1.6°.
Fig. 4.
Fig. 4.
Wettability-dependent ice–substrate contact area and its application for easy deicing. (A) Snapshots taken using an inverted optical microscope showing distinct contact areas between the ice and substrate (Acontact) depending on the wettability of the surface. The contact angles are (Upper) 107.3° and (Lower) 14.5°. The contact areas between ices and substrates are enclosed in blue lines. (B) The ratio of the ice–substrate contact area (Acontact/Aproject) versus the projected ice area (Aproject) for three substrates with different wettabilities. We have investigated about 100 ice growth events to get the mean values of each dot. (C) A scheme demonstrating that OSG ice can be easily blown away by a breeze, whereas ASG ice remains stuck to the solid surface. (D) An experiment designed to further verify the point made in C using a hybrid surface, of which one half had θ = 2.9° and the other half had θ = 107.3° (2 cm × 2 cm). The surface temperature was −20.2 °C to allow ice to grow simultaneously on both areas when the substrates were exposed to humid air at a relative humidity of 0.42 ± 0.05.

References

    1. Atkinson JD, et al. The importance of feldspar for ice nucleation by mineral dust in mixed-phase clouds. Nature. 2013;498:355–358. - PubMed
    1. Ball P, Stillinger FH. H2O: A biography of water. Nature. 1999;401:850–850.
    1. Murray BJ, Knopf DA, Bertram AK. The formation of cubic ice under conditions relevant to Earth’s atmosphere. Nature. 2005;434:202–205. - PubMed
    1. Abbatt JPD, et al. Solid ammonium sulfate aerosols as ice nuclei: A pathway for cirrus cloud formation. Science. 2006;313:1770–1773. - PubMed
    1. Doxey AC, Yaish MW, Griffith M, McConkey BJ. Ordered surface carbons distinguish antifreeze proteins and their ice-binding regions. Nat Biotechnol. 2006;24:852–855. - PubMed

Publication types