. 2017 Oct 24;114(43):11392-11397.
doi: 10.1073/pnas.1705748114. Epub 2017 Oct 9.

Small-molecule inhibitors directly target CARD9 and mimic its protective variant in inflammatory bowel disease

Affiliations

Small-molecule inhibitors directly target CARD9 and mimic its protective variant in inflammatory bowel disease

Elizaveta S Leshchiner et al. Proc Natl Acad Sci U S A. .

Abstract

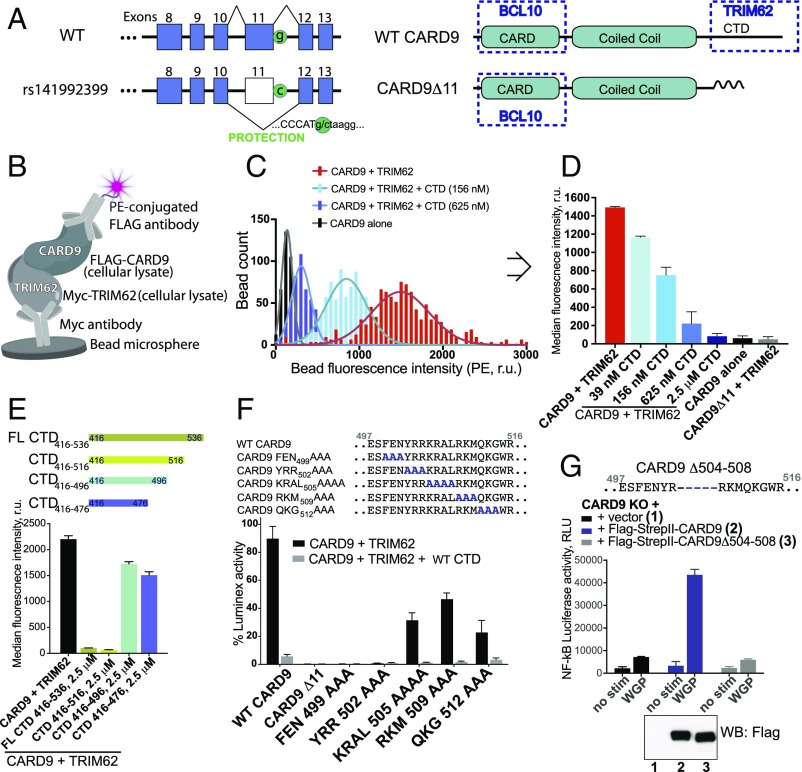
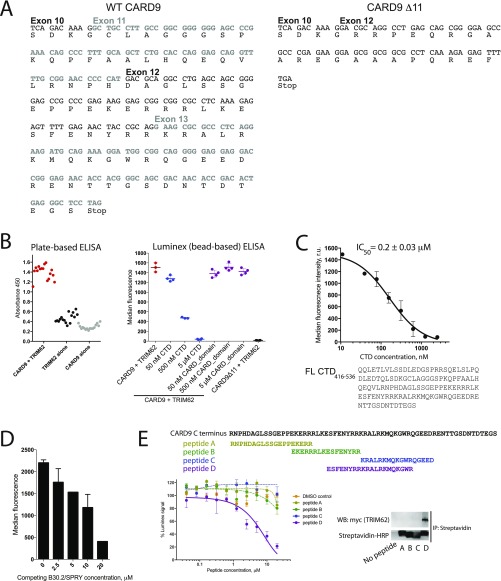
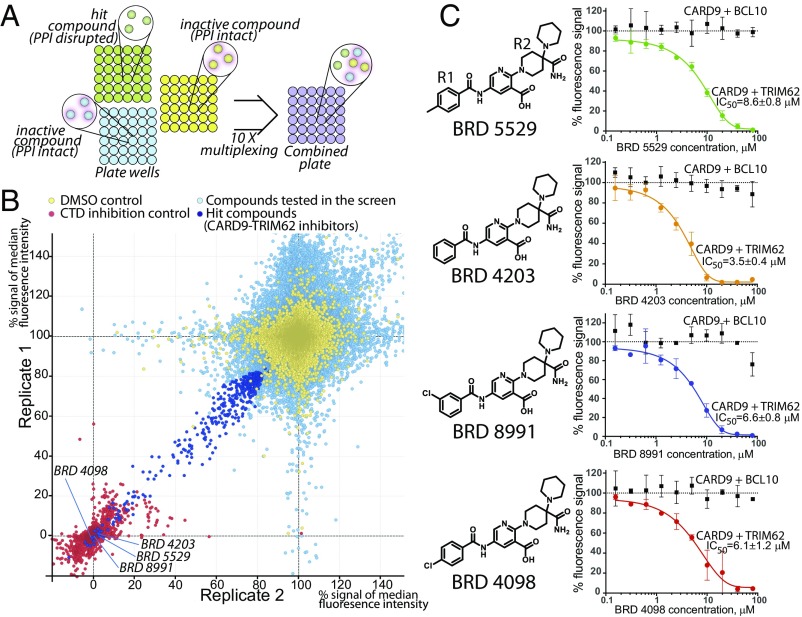
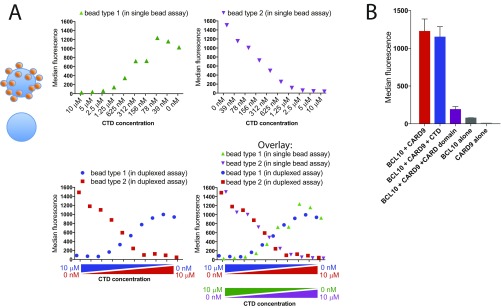
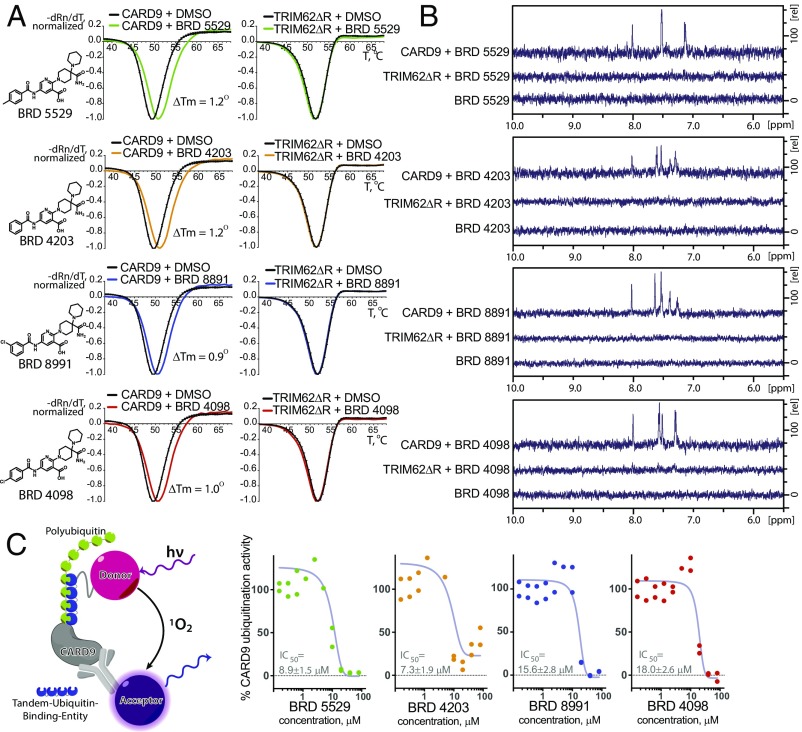
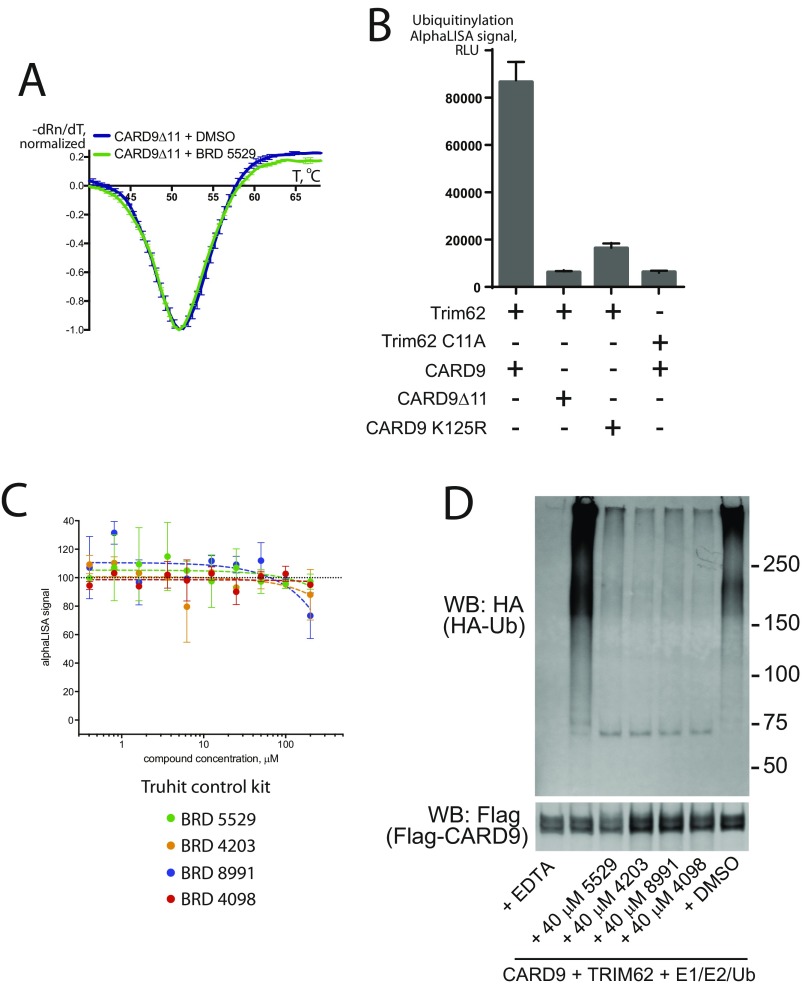
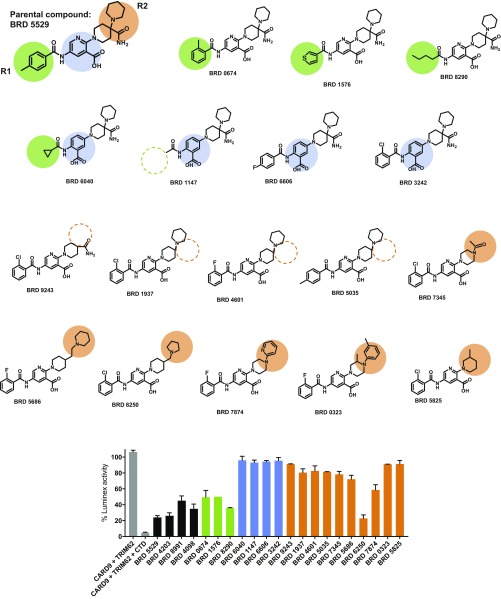
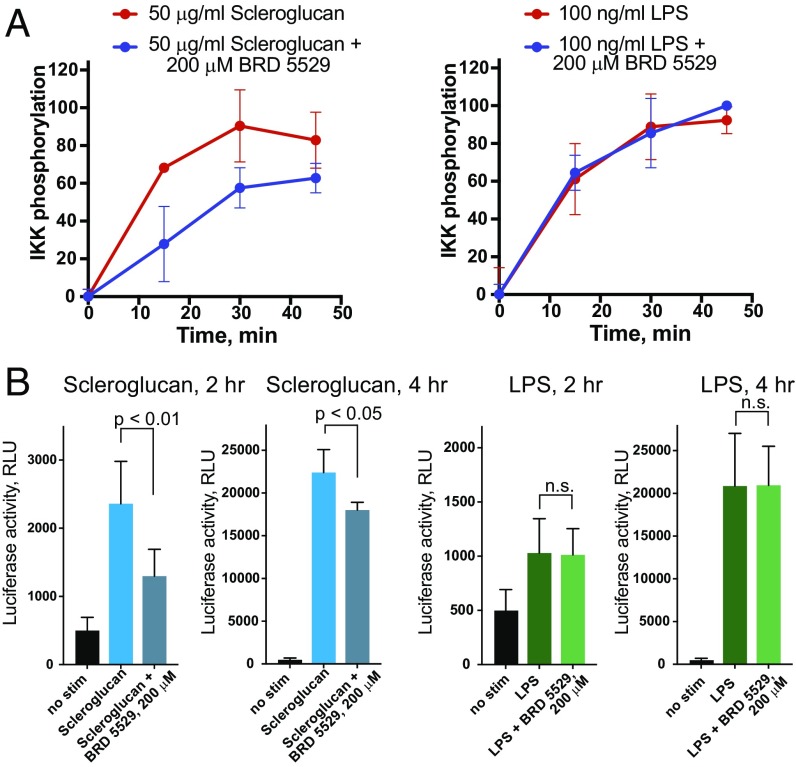
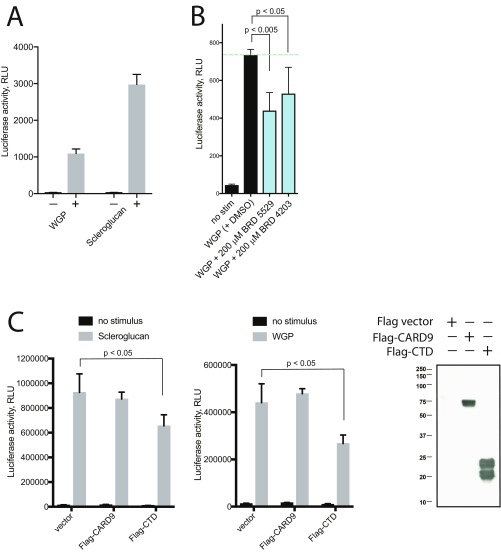
Advances in human genetics have dramatically expanded our understanding of complex heritable diseases. Genome-wide association studies have identified an allelic series of CARD9 variants associated with increased risk of or protection from inflammatory bowel disease (IBD). The predisposing variant of CARD9 is associated with increased NF-κB-mediated cytokine production. Conversely, the protective variant lacks a functional C-terminal domain and is unable to recruit the E3 ubiquitin ligase TRIM62. Here, we used biochemical insights into CARD9 variant proteins to create a blueprint for IBD therapeutics and recapitulated the mechanism of the CARD9 protective variant using small molecules. We developed a multiplexed bead-based technology to screen compounds for disruption of the CARD9-TRIM62 interaction. We identified compounds that directly and selectively bind CARD9, disrupt TRIM62 recruitment, inhibit TRIM62-mediated ubiquitinylation of CARD9, and demonstrate cellular activity and selectivity in CARD9-dependent pathways. Taken together, small molecules targeting CARD9 illustrate a path toward improved IBD therapeutics.

Keywords: CARD9; inflammatory bowel disease; small molecules; therapeutics.


Conflict of interest statement

Conflict of interest statement: S.L.S. and B.F.C. were coauthors on a 2015 review article. S.L.S. and K.M.S. were coauthors on a 2015 research paper. B.F.C. and K.M.S. independently supplied reagents to the same laboratory. There was no active collaboration.

Figures

Fig. 1.
Fig. 1.
A highly sensitive bead-based ELISA reveals the key determinants of CARD9–TRIM62 interaction. (A) The CARD9Δ11 protective variant encodes a G-to-C substitution resulting in disruption of a splice site and exon 11 skipping. WT CARD9 consists of CARD domain (interacts with BCL10), coiled coil domain, and C-terminal domain (CTD) (binds TRIM62 during CARD9 activation, disrupted in the protective variant). (B) Bead-based assay designed to detect CARD9–TRIM62 PPI in vitro. (C) Histogram of fluorescence intensity of each bead for CARD9 and TRIM62 (red), CARD9, and TRIM62 in the presence of CTD (156 nM, light blue; 625 nM, dark blue), or CARD9 alone in the absence of TRIM62 (black). (D) Median fluorescence intensity is taken from integrated signals of all individual beads in a well and provides a robust measure of CARD9–TRIM62 PPI disruption, as evidenced by a dose-dependent CTD competition. CARD9Δ11 is unable to bind TRIM62. (E) CARD9–TRIM62 disruption by four truncated CTD constructs (CTD416–536, CTD416–516, CTD416–496, or CTD416–476). (F) Mutational mapping of key CARD9 residues responsible for TRIM62 binding. (G) Human variant CARD9Δ504–508 precisely corresponds to the key TRIM62-interacting residues and results in disrupted CARD9 signaling, as measured by Dectin-1–triggered NF-κB–driven luciferase activity in THP-1 cells. Western blot confirms equivalent protein expression. RLU, relative light units; r.u., relative units. Data in Fig. 1 are mean ± SD for at least triplicates.
Fig. S1.
Fig. S1.
Development of a bead-based ELISA for quantifying CARD9–TRIM62 interaction. (A) DNA and protein sequences of WT CARD9 and CARD9Δ11. (B) Signal-to-noise comparison of a plate-based ELISA with bead-based readout. CARD9–TRIM62 interaction (red) can be inhibited by competition with purified CTD (5 μM, blue), but not by purified CARD domain (amino acids 2–98; 5 μM, purple). Data are expressed as median PE fluorescence per bead ± SD. (C) C-terminal B30.2/SPRY domain of TRIM62 competitively inhibits interaction between CARD9 and TRIM62, as measured by the bead-based ELISA. Data are expressed as median PE fluorescence per bead ± SD. (D) Short peptides corresponding to key TRIM62-interacting CARD9 residues, but not to other regions of CARD9 CTD, can competitively inhibit CARD9–TRIM62 interaction. Data are expressed as median PE fluorescence per bead ± SD. (E) Peptides inhibit CARD9–TRIM62 interaction by directly binding TRIM62, as evidenced by immunoprecipitation using biotinylated peptides and streptavidin pulldown from cellular lysate of HEK293T cells overexpressing myc-TRIM62. Functional inhibition data are expressed as the mean of percent Luminex signal (100% = median PE fluorescence per bead when no peptide inhibitor is present) ± SD.
Fig. 2.
Fig. 2.
A high-throughput screen identifies selective CARD9–TRIM62 PPI inhibitors. (A) Color-coded beads are plated and incubated with compounds in individual wells in the presence of CARD9 and TRIM62. After a wash step, beads are then combined for antibody staining and detection steps. (B) Replicate 1 vs. replicate 2 plot for all of the compounds (132,813) screened in duplicate in the CARD9–TRIM62 disruption assay. Yellow, neutral controls (DMSO); red, positive control (purified CTD, 5 μM); light blue, screened compounds (20 μM); dark blue, hits selected for followup investigation. Axis units are median PE fluorescence per bead within sample, normalized with respect to CTD positive control (0%) and DMSO negative control (100%). (C) Structural family of hit compounds are potent dose-dependent inhibitors in the CARD9–TRIM62 PPI assay (colored lines and data points) and inactive in the CARD9–BCL10 PPI assay (black lines and data points). Data are mean of percent Luminex signal (100% = median PE fluorescence per bead with DMSO control) ± SD of at least triplicates.
Fig. S2.
Fig. S2.
Multiplexing of bead-based ELISA for high-throughput screening. (A) To confirm that there is no reequilibration of the TRIM62-bound CARD9 between the different beads derived from different plates, single bead assays (Top two panels) were compared with the duplexed assay composed of two bead types/color codes (Bottom Left). The ability of CTD to disrupt CARD9–TRIM62 fully overlapped in duplexed versus single bead assays, confirming the independence of CARD9–TRIM62 interactions on each bead during simultaneous readout. Data are expressed as median PE fluorescence per bead. (B) CARD9–BCL10 assay was developed in which Myc-BCL10 produced in HEK293T lysates was immobilized on anti–myc-conjugated beads for binding to Flag-CARD9. The BCL10–CARD9 signal was present only when both lysates were present (red bar), and not in the case of either protein alone (dark gray and light gray bard). BCL10–CARD9 complexes were quantified with phycoerythrin (PE)-labeled anti-Flag antibodies and expressed as median PE fluorescence per bead (y axis). BCL10–CARD9 interaction was inhibited by the presence of purified CARD domain (amino acids 2–98; 5 μM, purple), but not by purified CTD (amino acids 416–536; 5 μM, blue). Data are expressed as median PE fluorescence per bead ± SD.
Fig. 3.
Fig. 3.
CARD9–TRIM62 PPI inhibitors directly bind CARD9, but not TRIM62, and disrupt its ubiquitinylation in vitro. (A) Differential scanning fluorimetry (DSF) profiles of CARD9 and TRIM62ΔRING (labeled as TRIM62ΔR) in the presence or absence of the hit compounds. DMSO was used as neutral control. x axis, temperature, degrees Celsius; y axis, −dRn/dT (negative first derivative of fluorescence intensity, normalized). Data represent the mean ± SD of triplicates. (B) STD NMR spectra for mixtures of CARD9 with compound, TRIM62ΔRING with compound, and compound alone. x axis, chemical shift change [Δ] ppm (parts per million); y axis, relative signal intensity. (C) An alphaLISA assay was designed to detect polyubiquitinylation of CARD9 in the presence of reconstituted E1–E2–E3 TRIM62 complex. Data represent percent AlphaLISA signal (100% = mean AlphaLISA signal with DMSO control).
Fig. S3.
Fig. S3.
Development of a functional assay for CARD9 ubiquitinylation by TRIM62. (A and B) AlphaLISA assay detects TRIM62-mediated CARD9 ubiquitinylation in the presence of WT TRIM62 and WT CARD9. Ubiquitinylation of CARD9 was significantly decreased with TRIM62 C11A (ligase-dead mutant), CARD9Δ11, or CARD9 K125R lacking a key lysine for TRIM62-mediated ubiquitinylation. Data are expressed as mean AlphaLISA signal ± SD. (C) The family of hit compounds tested in the Truhit AlphaLISA assay designed for detection of nonspecific AlphaLISA inhibitors. Data are expressed as mean of percent AlphaLISA signal (100% = mean AlphaLISA signal with DMSO control) ± SD. (D) Western blotting detects the inhibition of in vitro CARD9 ubiquitinylation reaction by the family of the hit compounds. Results are representative of three independent experiments.
Fig. S4.
Fig. S4.
Structure–activity relationship in the family of hit compounds as measured by CARD9–TRIM62 interaction assay. Tested structures are depicted, along with color codes highlighting the differences between the parental and the SAR compounds. Gray, CARD9–TRIM62 signal and the CTD inhibitor control. Black, parental compounds BRD5529, BRD4203, BRD8991m and BRD4098. Green, substitutions in the (−R1) portion of the structure, which appear to be well tolerated. Blue, substitutions in the pyridinecarboxylic acid core of the structure, which are detrimental to the compounds’ activity. Orange, substitutions in the aliphatic region of the structure, which result in variable activity, and are likely possible to develop further. Functional inhibition data are expressed as the mean of percent Luminex signal (100% = median PE fluorescence with DMSO control) ± SD.
Fig. 4.
Fig. 4.
BRD5529 attenuates CARD9 signaling in a stimulus-dependent manner. (A) Phosphorylation of IKK in primary BMDCs was assessed by flow cytometry. Cells were treated with the indicated stimuli (Dectin-1, scleroglucan; TLR4 control, LPS) in the presence or absence of 200 μM BRD5529. y axis, percent IKK phosphorylation compared with maximum phospho-IKK within experimental series. Data are represented as mean of at least triplicate ± SD. (B) NF-κB activation in THP-1 cells reconstituted with Dectin-1 and NF-κB–driven luciferase reporter. Cells were stimulated with scleroglucan (Left, blue bars) or LPS (Right, green bars) ± 200 μM BRD5529 for 2 h or 4 h. RLU, relative light units. Data are mean ± SD of at least quadruplicates. P values were calculated by Student’s t test. n.s., nonsignificant.
Fig. S5.
Fig. S5.
WGP (whole glucan particle, dispersible) Dectin-1–mediated signaling to NF-κB is inhibited by the CARD9-targeting compounds. (A) Scleroglucan is a more potent ligand than WGP that activates Dectin-1–mediated signaling. NF-κB activation in THP-1 cells reconstituted with Dectin-1 was measured by NF-κB–driven luciferase reporter in the presence or absence of 50 μg/mL WGP or scleroglucan. (B) Cells were stimulated with WGP (50 μg/mL) in the presence or absence of 200 μM BRD5529 or BRD4203. At the 4-h time point, luciferase activity was quantified. RLU, relative light units. For A and B, data represent the mean ± SD of at least six replicates and are representative of two independent experiments. P values were calculated by Student’s t test. (C) Inhibition of Dectin-1–mediated (scleroglucan or WGP stimulated) NF-κB luciferase reporter inhibition by heterologous expression of CTD of CARD9 in wild-type THP-1 cells. Flag-vector plasmid or Flag-CARD9 were used as negative controls, and CTD expression was confirmed by anti-Flag Western blot. Data represent mean ± SD of three replicates and are representative of two independent experiments.

References

    1. Jostins L, et al. International IBD Genetics Consortium (IIBDGC) Host-microbe interactions have shaped the genetic architecture of inflammatory bowel disease. Nature. 2012;491:119–124. - PMC - PubMed
    1. Anderson CA, et al. Meta-analysis identifies 29 additional ulcerative colitis risk loci, increasing the number of confirmed associations to 47. Nat Genet. 2011;43:246–252. - PMC - PubMed
    1. Beaudoin M, et al. Quebec IBD Genetics Consortium; NIDDK IBD Genetics Consortium; International IBD Genetics Consortium Deep resequencing of GWAS loci identifies rare variants in CARD9, IL23R and RNF186 that are associated with ulcerative colitis. PLoS Genet. 2013;9:e1003723. - PMC - PubMed
    1. Franke A, et al. Genome-wide meta-analysis increases to 71 the number of confirmed Crohn’s disease susceptibility loci. Nat Genet. 2010;42:1118–1125. - PMC - PubMed
    1. Rivas MA, et al. National Institute of Diabetes and Digestive Kidney Diseases Inflammatory Bowel Disease Genetics Consortium (NIDDK IBDGC); United Kingdom Inflammatory Bowel Disease Genetics Consortium; International Inflammatory Bowel Disease Genetics Consortium Deep resequencing of GWAS loci identifies independent rare variants associated with inflammatory bowel disease. Nat Genet. 2011;43:1066–1073. - PMC - PubMed

Publication types

MeSH terms