. 2017 Oct 24;114(43):11524-11529.
doi: 10.1073/pnas.1710311114. Epub 2017 Oct 9.

TREM2 deficiency attenuates neuroinflammation and protects against neurodegeneration in a mouse model of tauopathy

Affiliations

TREM2 deficiency attenuates neuroinflammation and protects against neurodegeneration in a mouse model of tauopathy

Cheryl E G Leyns et al. Proc Natl Acad Sci U S A. .

Abstract

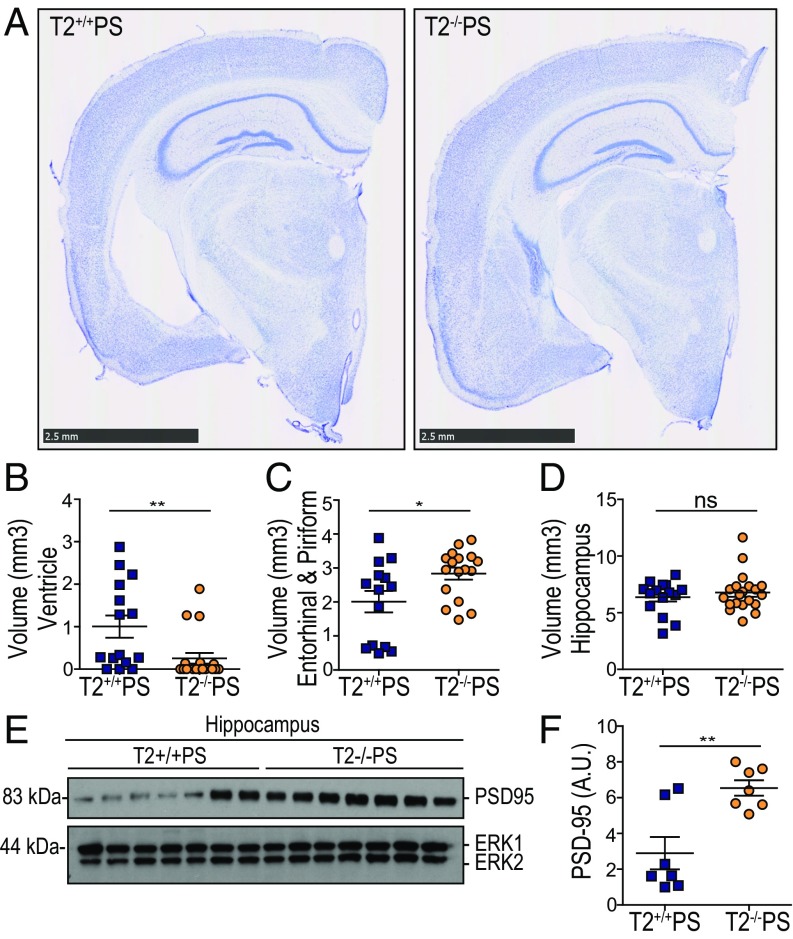
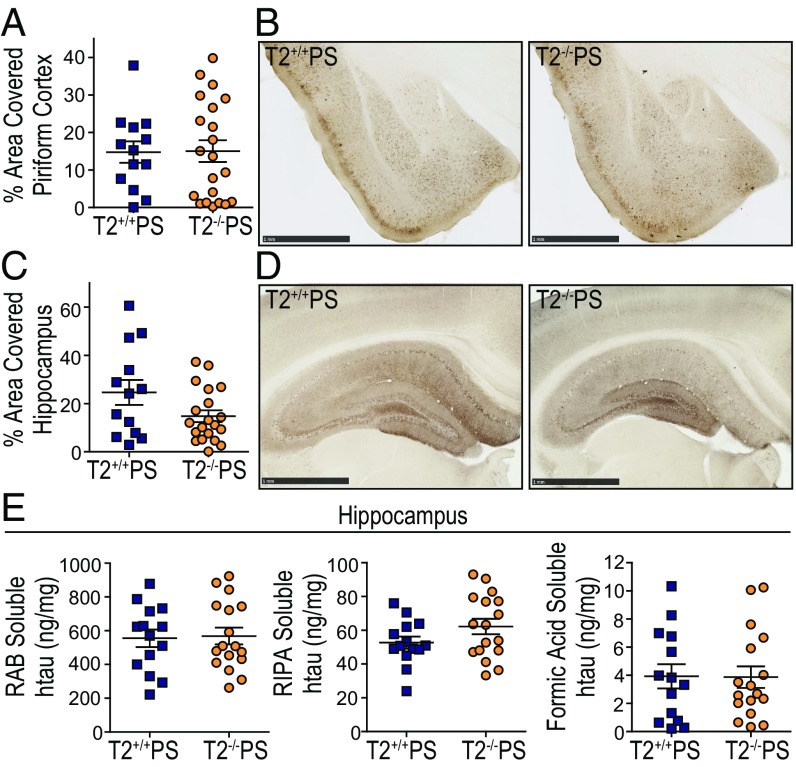
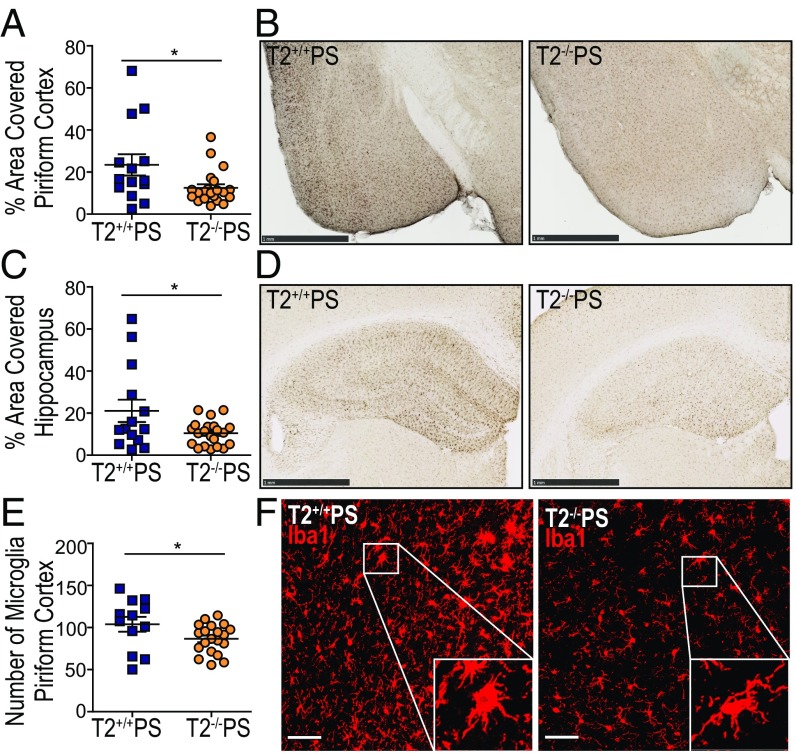
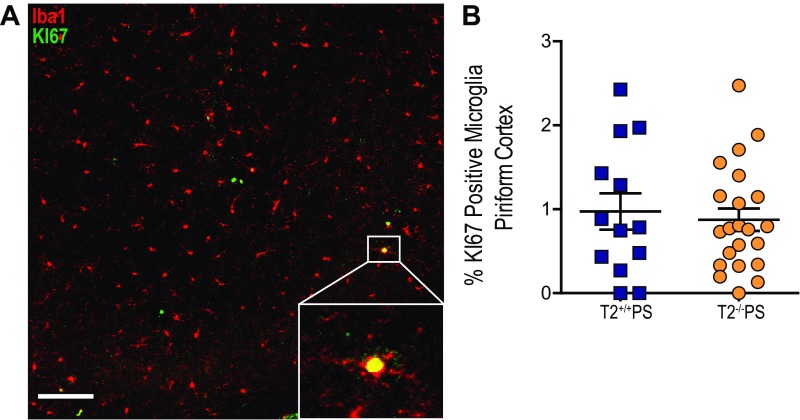
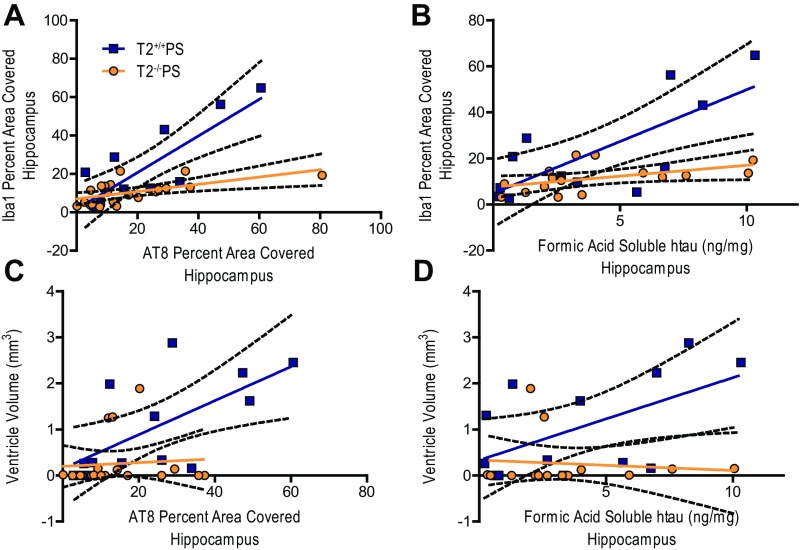
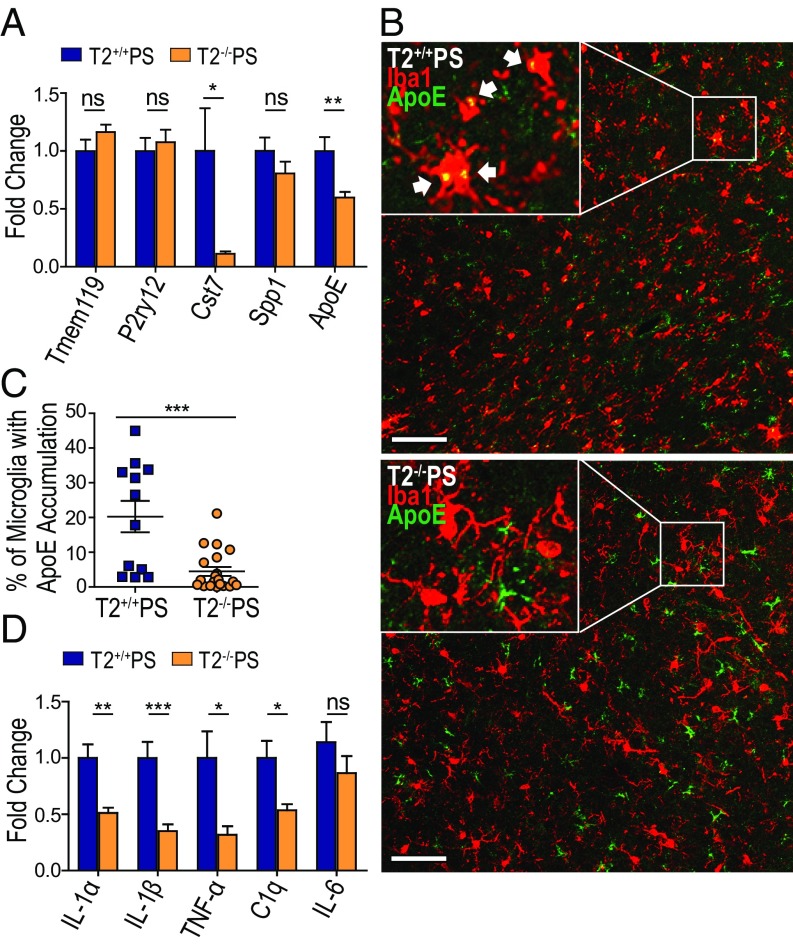
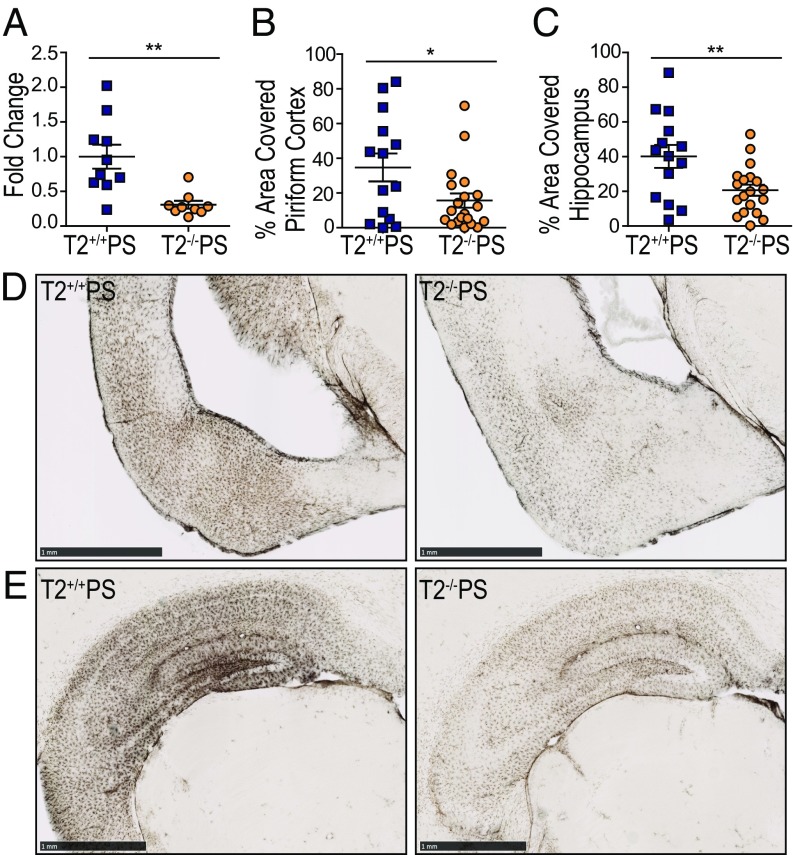
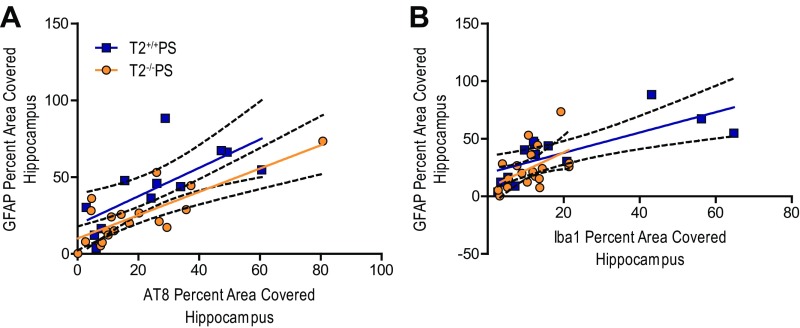
Variants in the gene encoding the triggering receptor expressed on myeloid cells 2 (TREM2) were recently found to increase the risk for developing Alzheimer's disease (AD). In the brain, TREM2 is predominately expressed on microglia, and its association with AD adds to increasing evidence implicating a role for the innate immune system in AD initiation and progression. Thus far, studies have found TREM2 is protective in the response to amyloid pathology while variants leading to a loss of TREM2 function impair microglial signaling and are deleterious. However, the potential role of TREM2 in the context of tau pathology has not yet been characterized. In this study, we crossed Trem2+/+ (T2+/+) and Trem2-/- (T2-/-) mice to the PS19 human tau transgenic line (PS) to investigate whether loss of TREM2 function affected tau pathology, the microglial response to tau pathology, or neurodegeneration. Strikingly, by 9 mo of age, T2-/-PS mice exhibited significantly less brain atrophy as quantified by ventricular enlargement and preserved cortical volume in the entorhinal and piriform regions compared with T2+/+PS mice. However, no TREM2-dependent differences were observed for phosphorylated tau staining or insoluble tau levels. Rather, T2-/-PS mice exhibited significantly reduced microgliosis in the hippocampus and piriform cortex compared with T2+/+PS mice. Gene expression analyses and immunostaining revealed microglial activation was significantly attenuated in T2-/-PS mice, and there were lower levels of inflammatory cytokines and astrogliosis. These unexpected findings suggest that impairing microglial TREM2 signaling reduces neuroinflammation and is protective against neurodegeneration in the setting of pure tauopathy.

Keywords: Alzheimer’s disease; TREM2; neurodegeneration; neuroinflammation; tau.


Conflict of interest statement

Conflict of interest statement: C.E.G.L. and D.M.H. are listed as inventors on a patent licensed by Washington University to C2N Diagnostics on the therapeutic use of anti-tau antibodies. D.M.H. cofounded and is on the scientific advisory board of C2N Diagnostics, LLC. C2N Diagnostics, LLC, has licensed certain anti-tau antibodies to AbbVie for therapeutic development. D.M.H. is on the scientific advisory board of Proclara Biosciences and consults for Genentech, Eli Lilly, AbbVie, GlaxoSmithKline, and Denali. J.D.U., M.B.F., F.R.S., L.J.K., J.R.S., G.O.R., E.A., and M.C. declare no competing financial interests.

Figures

Fig. 1.
Fig. 1.
TREM2 deficiency attenuates neurodegeneration in PS19 mice. (A) Representative images of Nissl staining from T2+/+PS and T2−/−PS mice. (Scale bars, 2.5 mm.) Quantification of the average volume of the (B) ventricles (P = 0.0034; T2+/+PS, n = 15; T2−/−PS, n = 19), (C) entorhinal and piriform cortex (P = 0.0232; T2+/+PS, n = 14; T2−/−PS, n = 17), and (D) hippocampus (P = 0.4589; T2+/+PS, n = 15; T2−/−PS, n = 20). (E) Immunoblot analysis from hippocampal RIPA lysates of PDS-95 in T2+/+PS and T2−/−PS mice. ERK served as a loading control. (F) Quantification of the relative protein levels for PSD-95 to the internal control, ERK1. Blots shown in E are cropped. Full-length blots are presented in Fig. S1. A Mann–Whitney test was used to determine statistical significance for ventricular volume due to the nonparametric data set. For all other graphs, significance was determined by an unpaired, two-tailed Student’s t test. Significance was defined as *P < 0.05 and **P < 0.01.
Fig. S1.
Fig. S1.
Full scans of immunoblot data. Unedited film from PSD-95 (∼83-kDa) and ERK1/2 (∼44- and 42-kDa) immunoblots.
Fig. 2.
Fig. 2.
No differences were observed in tau phosphorylation or solubility in 9-mo-old T2+/+PS and T2−/−PS mice. Quantification of the percent area covered by biotinylated AT8 staining in the (A) piriform cortex (P = 0.9499; T2+/+PS, n = 13; T2−/−PS, n = 21) and (B) hippocampus (P = 0.0652; T2+/+PS, n = 13; T2−/−PS, n = 20). Representative images of biotinylated AT8 p-tau staining in the (C) piriform cortex and (D) hippocampus from T2+/+PS and T2−/−PS mice. (Scale bars, 1 mm.) (E) Tau solubility in the hippocampus was quantified using a human-tau (htau) specific sandwich ELISA to measure (Left) RAB-soluble htau (P = 0.8562; T2+/+PS, n = 14; T2−/−PS, n = 17), (Center) RIPA-soluble htau (P = 0.1233; T2+/+PS, n = 14; T2−/−PS, n = 17), and (Right) FA-soluble htau levels (P = 0.9584; T2+/+PS, n = 14; T2−/−PS, n = 17). Data are presented as mean ± SEM. Significance was determined using an unpaired, two-tailed Student’s t test.
Fig. 3.
Fig. 3.
TREM2 deficiency reduces microgliosis in PS19 mice. Quantification of the percent area covered by Iba1 staining in the (A) piriform cortex (P = 0.0242; T2+/+PS, n = 14; T2−/−PS, n = 21) and (B) hippocampus (P = 0.0266; T2+/+PS, n = 14; T2−/−PS, n = 21). Representative images of Iba1 staining in the (C) piriform cortex and (D) hippocampus from T2+/+PS and T2−/−PS mice. (Scale bars, 1 mm.) (E) Quantification of immunofluorescence staining for Iba1-positive cell bodies in the piriform cortex (P = 0.0478; T2+/+PS, n = 12; T2−/−PS, n = 20). (F) Representative images of Iba1 immunofluorescence staining in the piriform cortex. Microglia in T2+/+PS mice display a more ramified phenotype as opposed to in T2−/−PS mice where microglia appear quiescent. Images represent maximum-intensity projections of z stacks. (Scale bars, 50 µm.) Data are mean ± SEM. Significance was determined using an unpaired, two-tailed Student’s t test with *P < 0.05.
Fig. S2.
Fig. S2.
No effect of TREM2 deficiency on KI-67–positive microglia in the piriform cortex. (A) Quantification of KI-67–positive microglia in the piriform cortex (P = 0.6844; T2+/+PS: 0.9725 ± 0.2171, n = 13; T2−/−PS: 0.8738 ± 0.2406, n = 22). (B) Representative image of KI-67–positive microglia. Images represent maximum-intensity projections of z stacks. (Scale bars: 50 µm.) Data are mean ± SEM. Significance was determined using an unpaired, two-tailed Student’s t test with *P < 0.05.
Fig. S3.
Fig. S3.
Correlations between tau pathology, microgliosis, and degeneration in the hippocampus of T2+/+PS and T2−/−PS mice. Significant correlations were observed between Iba1 microglial staining and (A) AT8 p-tau staining (T2+/+PS: n = 12, **P < 0.01, R2 = 0.6743; T2−/−PS: n = 21, **P < 0.01, R2 = 0.3392) and (B) FA-soluble htau levels (T2+/+PS: n = 12, **P < 0.01, R2 = 0.5560; T2−/−PS: n = 16, *P < 0.05, R2 = 0.2475) in both groups, but were stronger in T2+/+PS mice. Additionally, significant correlations for ventricular size and (C) AT8 p-tau staining (T2+/+PS: n = 13, *P < 0.05, R2 = 0.4312; T2−/−PS: n = 19, not significant P > 0.05, R2 = 0.0064) and (D) FA-soluble htau levels (T2+/+PS: n = 13, *P < 0.05, R2 = 0.3185; T2−/−PS: n = 14, not significant P > 0.05, R2 = 0.0114) were observed for T2+/+PS but not T2−/−PS mice. Solid, colored lines represent the best-fit line with a linear regression, and black, dashed lines represent 95% confidence intervals.
Fig. 4.
Fig. 4.
Decreased microglial activation and inflammatory gene expression in T2−/−PS mice. (A) Expression of microglial homeostatic (Tmem119: P = 0.1755; and P2ry12: P = 0.6323) and activated markers in the cortex of T2+/+PS and T2−/−PS mice (Cst7: P = 0.0274; Spp1: P = 0.2256; ApoE: P = 0.0088). (B) Representative images of ApoE-positive puncta in Iba1-positive cell bodies from coimmunofluorescence staining in the piriform cortex of T2+/+PS and T2−/−PS mice. Images represent maximum-intensity projections of z stacks. (Scale bars, 50 µm.) (C) Quantification of the percentage of Iba1-positive microglial cell bodies with ApoE accumulation in the piriform cortex (P = 0.0003; T2+/+PS, n = 12; T2−/−PS, n = 20). (D) Expression of inflammatory genes in the cortex of T2+/+PS and T2−/−PS mice (IL-1α, P = 0.0021; IL-1β, P = 0.0009; TNF-α, P = 0.0133; and C1q, P = 0.0136; IL-6, P = 0.5512). n = 9–10 for all qRT-PCR analyses. All graphs represent the mean ± SEM. Significance was determined using an unpaired, two-tailed Student’s t test with “ns” denoting not significant, *P < 0.05, **P < 0.01, and ***P < 0.001.
Fig. 5.
Fig. 5.
Reduced astrogliosis in T2−/−PS mice. (A) Expression of cortical GFAP (P = 0.0019). Quantification of the percent area covered by GFAP staining in the (B) piriform cortex (P = 0.0282; T2+/+PS, n = 14; T2−/−PS, n = 20) and (C) hippocampus (P = 0.0067; T2+/+PS, n = 14; T2−/−PS, n = 19). Representative images of GFAP immunohistochemistry in the (D) piriform cortex and (E) hippocampus of T2+/+PS and T2−/−PS mice. (Scale bars, 1 mm.) Data are mean ± SEM. Significance was determined using an unpaired, two-tailed Student’s t test with *P < 0.05 and **P < 0.01.
Fig. S4.
Fig. S4.
Correlations between astrogliosis, tau pathology, and microgliosis in the hippocampus of T2+/+PS and T2−/−PS mice. Strong, significant correlations were observed between GFAP staining and (A) AT8 p-tau staining (T2+/+PS: n = 12, **P < 0.01, R2 = 0.5130; T2−/−PS: n = 19, ***P < 0.001, R2 = 0.6311) for both T2+/+PS and T2−/−PS mice. (B) Correlations between GFAP and Iba1 were reduced in T2−/−PS compared with T2+/+PS mice (T2+/+PS: n = 13, **P < 0.01, R2 = 0.5610; T2−/−PS: n = 19, *P < 0.05, R2 = 0.2430). Solid, colored lines represent the best-fit line with a linear regression, and black, dashed lines represent 95% confidence intervals.

References

    1. Holtzman DM, Morris JC, Goate AM. Alzheimer’s disease: The challenge of the second century. Sci Transl Med. 2011;3:77sr1. - PMC - PubMed
    1. Itagaki S, McGeer PL, Akiyama H, Zhu S, Selkoe D. Relationship of microglia and astrocytes to amyloid deposits of Alzheimer disease. J Neuroimmunol. 1989;24:173–182. - PubMed
    1. Sheffield LG, Marquis JG, Berman NE. Regional distribution of cortical microglia parallels that of neurofibrillary tangles in Alzheimer’s disease. Neurosci Lett. 2000;285:165–168. - PubMed
    1. Wyss-Coray T, Mucke L. Inflammation in neurodegenerative disease—a double-edged sword. Neuron. 2002;35:419–432. - PubMed
    1. Leyns CEG, Holtzman DM. Glial contributions to neurodegeneration in tauopathies. Mol Neurodegener. 2017;12:50. - PMC - PubMed

Publication types