. 2017 Oct 24;114(43):E9066-E9075.
doi: 10.1073/pnas.1704862114. Epub 2017 Oct 11.

Packaging and transfer of mitochondrial DNA via exosomes regulate escape from dormancy in hormonal therapy-resistant breast cancer

Affiliations

Packaging and transfer of mitochondrial DNA via exosomes regulate escape from dormancy in hormonal therapy-resistant breast cancer

Pasquale Sansone et al. Proc Natl Acad Sci U S A. .

Erratum in

Abstract

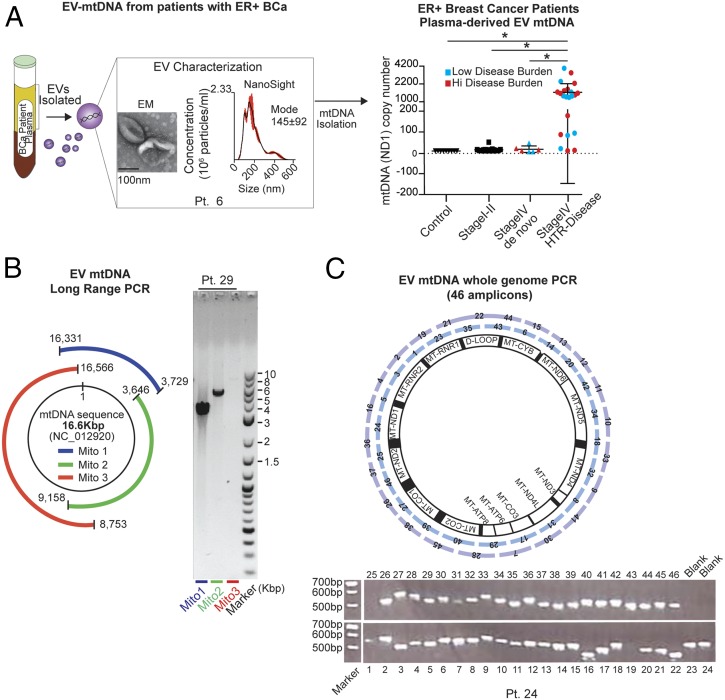
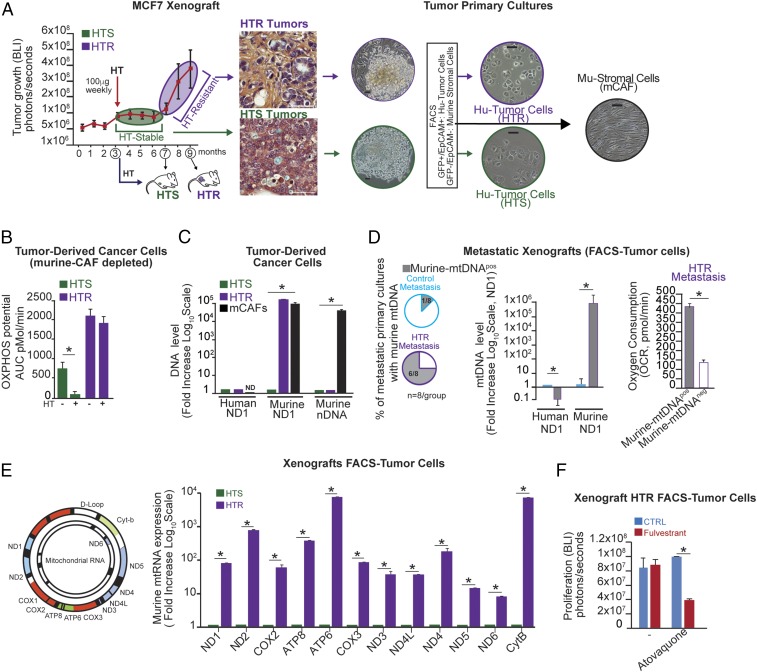
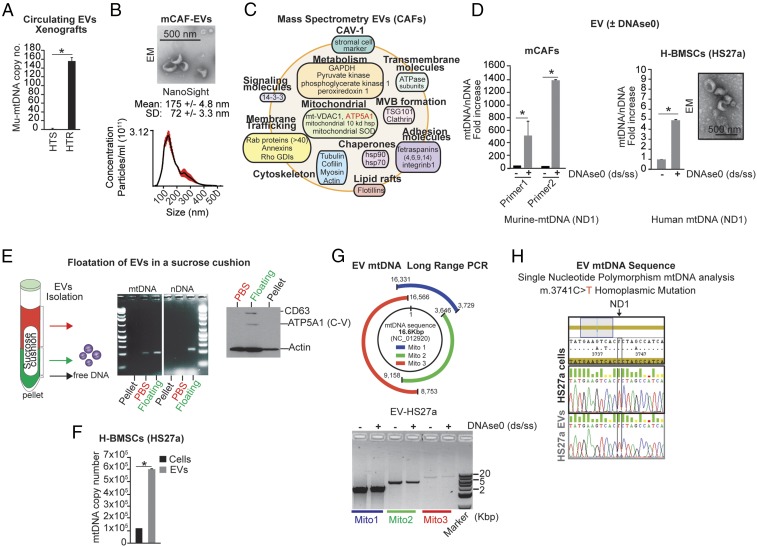
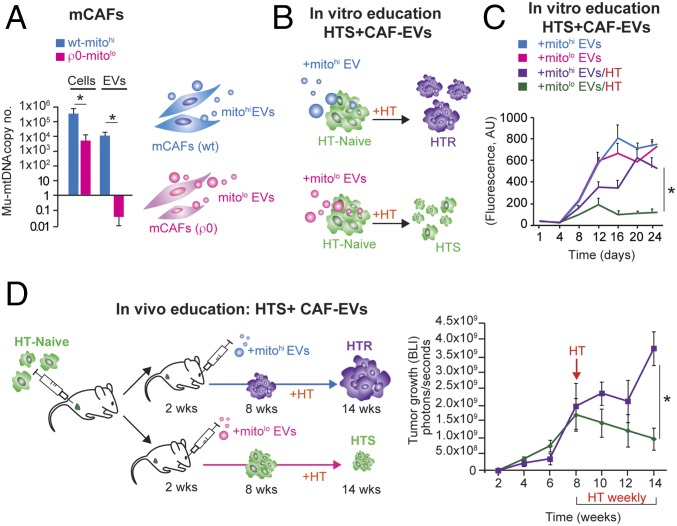
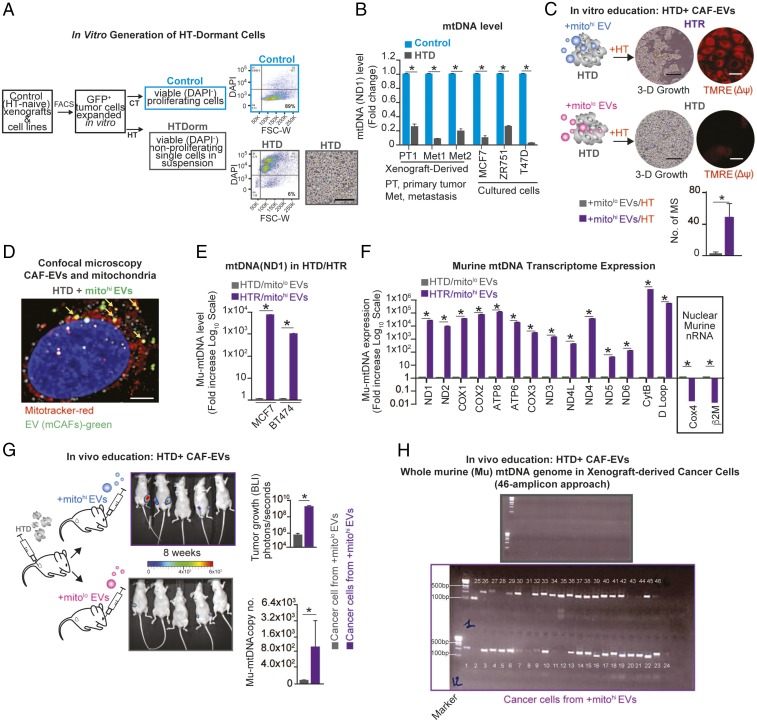
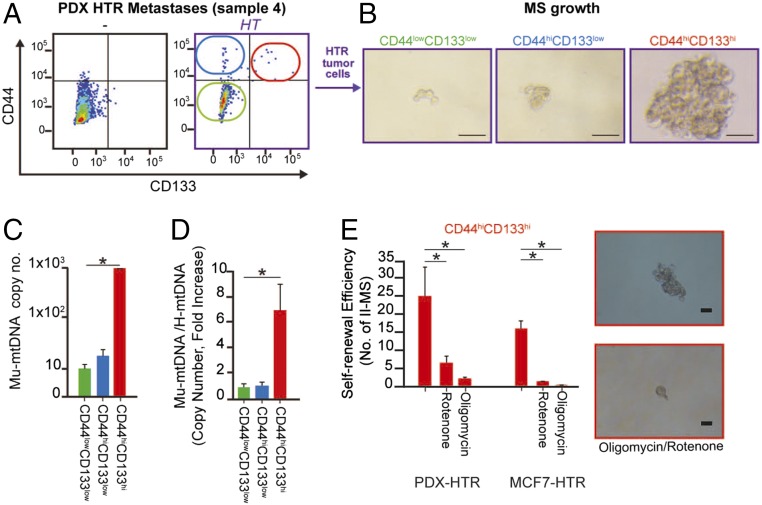
The horizontal transfer of mtDNA and its role in mediating resistance to therapy and an exit from dormancy have never been investigated. Here we identified the full mitochondrial genome in circulating extracellular vesicles (EVs) from patients with hormonal therapy-resistant (HTR) metastatic breast cancer. We generated xenograft models of HTR metastatic disease characterized by EVs in the peripheral circulation containing mtDNA. Moreover, these human HTR cells had acquired host-derived (murine) mtDNA promoting estrogen receptor-independent oxidative phosphorylation (OXPHOS). Functional studies identified cancer-associated fibroblast (CAF)-derived EVs (from patients and xenograft models) laden with whole genomic mtDNA as a mediator of this phenotype. Specifically, the treatment of hormone therapy (HT)-naive cells or HT-treated metabolically dormant populations with CAF-derived mtDNAhi EVs promoted an escape from metabolic quiescence and HTR disease both in vitro and in vivo. Moreover, this phenotype was associated with the acquisition of EV mtDNA, especially in cancer stem-like cells, expression of EV mtRNA, and restoration of OXPHOS. In summary, we have demonstrated that the horizontal transfer of mtDNA from EVs acts as an oncogenic signal promoting an exit from dormancy of therapy-induced cancer stem-like cells and leading to endocrine therapy resistance in OXPHOS-dependent breast cancer.

Keywords: cancer stem cells; exosomes; hormonal therapy; metastasis; mitochondrial DNA.


Conflict of interest statement

Conflict of interest statement: P.S. and J.B. hold a patent on this discovery (US 62/451,453).

Figures

Fig. 1.
Fig. 1.
Mitochondrial genome identified in EVs from the plasma of patients with HTR disease. (A) Circulating EVs were isolated from the plasma (5–10 mL) of 22 patients with HTR metastatic disease [patients with high-volume disease (>10% of organ involvement) are denoted in red, and those with low-volume disease (<1% of organ involvement) are denoted in blue], 9 healthy controls, 12 patients with early-stage breast cancer following removal of their cancer, and 6 patients with de novo metastatic breast cancer who had not yet received treatment. MtDNA copy number quantification was determined after DNase treating EVs by qPCR for the ND1 gene (10 ng of DNA was used). A representative NanoSight plot (mode and size) and electron micrographs are also shown (patient 6). Data are reported as the mean ± SD for experiments performed in triplicate; each point represents a patient value. *P < 0.005 (Student’s t test). (B) Schematic and representative gel electrophoresis image of long-range PCR (three contiguous amplicons: Mito1, 3.9 kbp; Mito2, 5.5 kbp; Mito3, 7.8 kbp) encoding the complete 16.6-kbp circular mitochondrial genome purified from EVs in the plasma of patient 29 (2 ng of total DNA). (C) Schematic and a representative gel electrophoresis image of whole-genome amplification (using 46 overlapping PCR amplicons covering the complete mtDNA genome) from patient-derived EV-DNA (1 ng for each PCR) (EVs were derived from patient 24, see uncropped gel SI Appendix, Fig. S1B). For EV analysis of all patients, see SI Appendix, Table S1.
Fig. 2.
Fig. 2.
The horizontal transfer of host (murine) mtDNA associates with HTR disease. (A) Representative tumor-growth kinetics (determined by bioluminescence imaging, BLI) of GFP+/Luciferase+MCF7 xenografts (n = 10) treated weekly with fulvestrant once MFP tumors were established (3 mo after inoculation), which led to a 4-mo period of disease stability on HT (HTS) followed by exponential growth on HT (HTR). Representative H&E images of tumors and primary cultures from unsorted as well as FACS-purified cancer cells (GFP+/Epcam+) and mCAFs (GFP/Epcam) are shown. (Scale bars, 100 μm.) (B) OXPHOS potential in tumor-derived cancer cells ± HT (fulvestrant, 10 μM) in A was measured by Seahorse technology. (C) DNA level expressed as fold change (human and murine nuclear and mitochondrial) (log10 scale) in cancer cells and mCAFs isolated from HTS and HTR disease in A. (D) Percentage of metastatic lesions isolated by FACS from tumor-bearing mice (n = 8 per group) expressing mu-mtDNA as determined by ND1 qPCR (2 ng of total DNA). OCRs in mu-mtDNA+ and control HTR cells were determined by Seahorse technology. (E) Mu-mtRNA expression of 12 genes (ND1, ND2, COX2, ATP8, ATP6, COX3, ND3, ND4L, ND4, ND5, ND6, CytB) is shown as fold change (log10 scale) determined by qRT-PCR in the HTR and HTS cells in A. (F) Proliferation potential in the presence of the mitochondrial complex III inhibitor atovaquone (1 μM) in HTR cells with/without HT (fulvestrant, 10 μM). The bar graph shows BLI values at the end point of the experiment (7 d). Data in BF are reported as the mean of three independent experiments; error bars indicate SD; *P < 0.05 (student’s t test).
Fig. 3.
Fig. 3.
Stromal-derived EVs harbor the mitochondrial genome. (A) qPCR of mu-mtDNA copy number (ND1 gene) in circulating EV DNA isolated from HTR and HTS tumor-bearing mice (n = 3 per group). (B) Electron microscopy (scale bar, 500 nm) and NanoSight analyses of EVs isolated from mCAFs. The concentration of particles is reported as mean ± SD. (C) Representative exosomal proteins identified by quantitative mass spectrometry of mCAF-derived EVs (SI Appendix, Table S3). (D) Ratio of mtDNA/nDNA level by qPCR (two unique primer sets were used for murine ND1, and one set each was used for human ND1, murine GAPDH, and human GAPDH) in EVs isolated from mCAFs and human bone marrow stromal cells (H-BMSCs, HS27a) ± DNase0 treatment to eliminate exogenous DNA contamination (Materials and Methods). A representative electron microscopy image of HS27a EVs is shown. (Scale bar, 500 nm.) (E) Schematic and representative PCR gel electrophoresis of mtDNA (ND1) and nDNA (GAPDH) from fractions following sucrose cushion purification (SI Appendix, Materials and Methods) of mCAF-derived EVs. Free DNA was eliminated by DNase0 digestion before extraction of EV-DNA. Western blot analysis of Actin, the EV marker CD63, and the mitochondria marker ATP5A1 is also reported in each EV isolated component. (F) mtDNA level as absolute copy number (qPCR, ND1) from HS27a EVs and cells. (G) Schematic and representative gel electrophoresis image of long-range PCR (three contiguous amplicons; SI Appendix, Table S4) encoding the 16-kbp mtDNA genome from purified EVs ± DNase0. (H) Electropherogram of the DNA sequence of the ND1 gene showing a mutation conserved between HS27a cells and EVs (SI Appendix, Table S2). Data are presented as the mean of three independent experiments; error bars indicate SD; *P < 0.05 (student’s t test).
Fig. 4.
Fig. 4.
mCAF-derived EVs educate tumor cells, mediating HTR disease. (A) Mu-mtDNA copy number by qPCR in mCAFs and their EVs; Wt, wild type; ρ0, cells depleted for mtDNA (Materials and Methods). The bar graph reports the mean copy number (log10 scale) of three independent experiments; error bars indicate SD. *P < 0.05 (Student's t test). (B) Schematic showing HTS cells (green) treated with 3 × 10⁹ mCAF-derived EVs (wild-type mtDNAhi or ρ0-mtDNAlo) once weekly for 4 wk + HT (fulvestrant, 10 μM/wk), leading to the growth of wild-type mtDNAhi-EV–educated cells. (C) Proliferation (shown by Calcein AM staining) of BT474 (HTS cells) cultured for 24 d ± HT (fulvestrant, 10 μM/wk) and treated weekly with 3 × 10⁹ mCAF-derived EVs (wild-type mtDNAhi or ρ0 mtDNAlo). The mean ± SD for each time point of the growth curve is reported; *P < 0.05 (post hoc t test corrected for multiple comparisons after GLM for repeated measures). (D) Schematic and tumor growth curve of HTS cells (MCF7) injected into the MFP and subsequently educated weekly via retroorbital injection of 3 × 10⁹ with wild-type mitohi or ρ0-mtDNAlo EVs. After 8 wk, HT was administered (fulvestrant, 100 μg/wk) for 6 wk. The mean ± SEM for each time point of the growth curve is reported; *P < 0.05 (post hoc t test corrected for multiple comparisons after GLM for repeated measures).
Fig. 5.
Fig. 5.
mCAF-derived EVs promote the exit from HT-induced tumor dormancy. (A) Schematic of the experimental design and representative flow plots: HT-naive cells were FACS isolated from xenografts (GFP+) or luminal breast cancer cell lines and were treated with HT (fulvestrant, 10 μM/wk) for 2 mo; HTD cancer cells (6% of the viable population, HTDorm) were FACS purified (Dapi) and displayed a single-cell (nonproliferating) morphology in 3D. (Scale bar,100 μm.) (B) mtDNA levels (determined by qPCR and expressed as fold change; naive cells were used as reference) in luminal breast cancer cells and xenograft-derived cells (multiple models) ± HT (fulvestrant, 10 μM) for 2 mo. (C) Dormant MCF7 cells (HTD) were isolated (SI Appendix, Fig. S5) and treated weekly for 4 wk with 3 × 10⁹ mCAF-derived EVs (wt-mtDNAhi or ρ0-mtDNAlo) + HT (fulvestrant, 10 μM/wk). After 40 d, mammosphere (MS) number and mitochondrial membrane potential (Δψ) were determined by TMRE staining (red) in HTR/mitohi-EV– and HTD/mitolo-EV–educated cells. (Scale bars, 15 μm.) (D) Confocal microscopy of HTD cells incubated for 48 h with PKH67 Green-labeled mCAF EVs (green), MitoTracker-labeled mitochondria (red), and EVs colocalized with mitochondria (yellow). (Scale bar, 5 μm.) (E) Mu-mtDNA level (qPCR, ND1) shown as the fold increase (log10 scale) of the reference HTD from the two HTD–HTR models (MCF7 and BT474) described in C. (F) Mu-mtRNA expression of 14 genes (shown as fold change, −log10 scale) determined by qRT-PCR in HTR and HTS cells in E (reference HTD cells; MCF7); the expression of nuclear-encoded (nonmitochondrial) murine RNA transcripts was also determined (Cox4, β2M). (G) Schematic, representative photographs, and bar graph showing BLI of tumor growth derived from HTD cells (ZR751 GFP+/Luciferase+ cells) injected in the MFP of mice (n = 5 per group) that were treated weekly for 8 wk via retroorbital injection with 3 × 10⁹ wt-mitohi or ρ0-mitolo mCAF-derived EVs. Data are shown as mean ± SD at the end point (4 mo); *P < 0.05 (student’s t test). The mu-mtDNA level is reported as the copy number (qPCR, ND1) in FACS-purified ZR751 EV-educated cells at the end point of the experiment. (H) Representative gel electrophoresis from whole mu-mtDNA PCR amplification using a set of nuclear mitochondrial sequences (NumtS) excluding overlapping primers in cancer cells from G (grey, mitolow EV-derived tumor cells; purple mitohi EV-derived tumor cells) (Materials and Methods). Data in B, C, and EG are reported as the mean of three independent experiments; error bars indicate SD; In B, C, E, and F, *P < 0.05 (student’s t test).
Fig. 6.
Fig. 6.
mtDNA horizontal transfer in vivo preferentially occurs in CSCs, leading to increased self-renewal with hormonal therapy. (A) Representative CD133/CD44 expression by flow analysis of HRT PDX cancer cells and controls (no HT). Briefly, cancer cells were isolated from patient-derived bone metastases (sample 4), grown in culture dishes for 2 wk, and then injected into the MFP of NOD/SCID mice treated with HT (fulvestrant, 1 mg/wk). After 5 mo, tumor tissues were digested, and cancer cells were cultured in vitro and FACS sorted. (B) Representative images of 3D cell cultures (low-attachment plates at day 7) of the three cell populations derived from A. (Scale bars, 100 μm.) (C) The mu-mtDNA level is reported as copy number (qPCR, ND1) in FACS-purified cancer cell populations from A. (D) Bar graph showing mtDNA copy number as fold increase of the ratio of murine versus human mtDNA in cell populations from A. (E) Self-renewal potential as secondary mammosphere formation (II-MS) in the presence of mitochondrial poisons administered every 48 h in CD44hi/CD133hi CSCs at day 7 of 3D culture (rotenone 100 nM, oligomycin 200 nM). Data in CE are reported as the mean of three independent experiments; error bars indicate SD; *P < 0.05 (student’s t test).

References

    1. Peinado H, et al. Melanoma exosomes educate bone marrow progenitor cells toward a pro-metastatic phenotype through MET. Nat Med. 2012;18:883–891. - PMC - PubMed
    1. Zhang L, et al. Microenvironment-induced PTEN loss by exosomal microRNA primes brain metastasis outgrowth. Nature. 2015;527:100–104. - PMC - PubMed
    1. Desrochers LM, Antonyak MA, Cerione RA. Extracellular vesicles: Satellites of information transfer in cancer and stem cell biology. Dev Cell. 2016;37:301–309. - PMC - PubMed
    1. Fadoukhair Z, et al. Evaluation of targeted therapies in advanced breast cancer: The need for large-scale molecular screening and transformative clinical trial designs. Oncogene. 2016;35:1743–1749. - PubMed
    1. Ignatiadis M, Sotiriou C. Luminal breast cancer: From biology to treatment. Nat Rev Clin Oncol. 2013;10:494–506. - PubMed

Publication types