. 2017 Oct 24;114(43):E9105-E9114.
doi: 10.1073/pnas.1711596114. Epub 2017 Oct 9.

Spatial organization of a model 15-member human gut microbiota established in gnotobiotic mice

Affiliations

Spatial organization of a model 15-member human gut microbiota established in gnotobiotic mice

Jessica L Mark Welch et al. Proc Natl Acad Sci U S A. .

Abstract

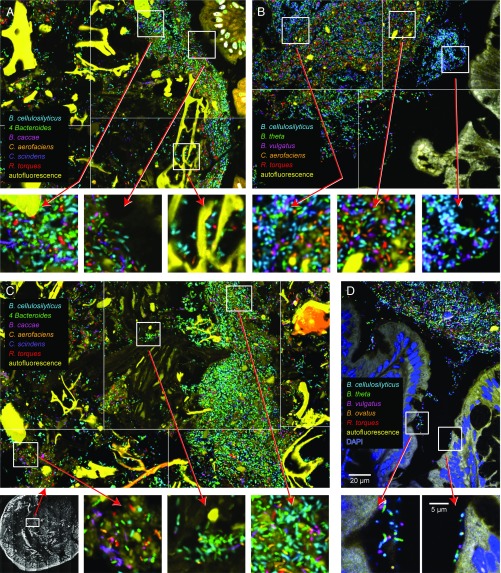
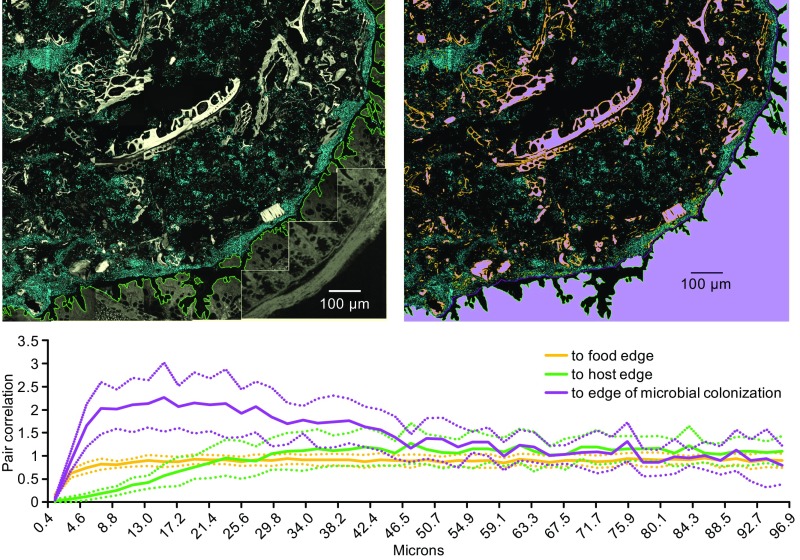
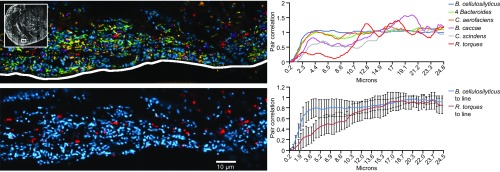
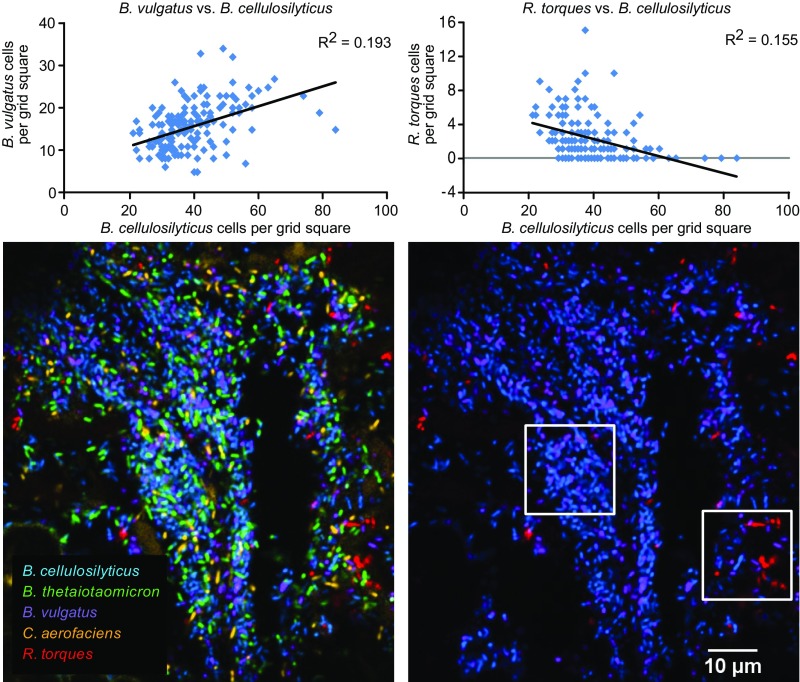
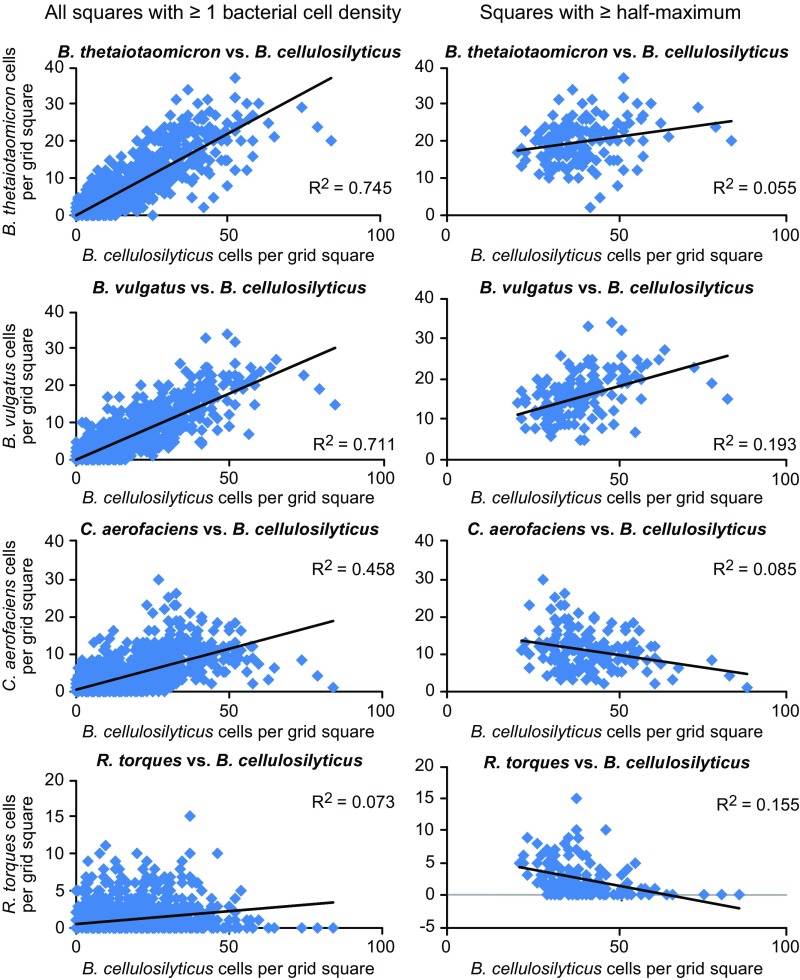
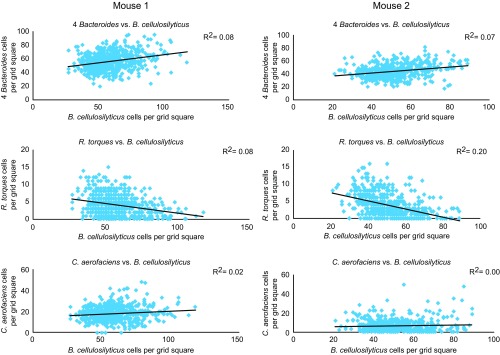
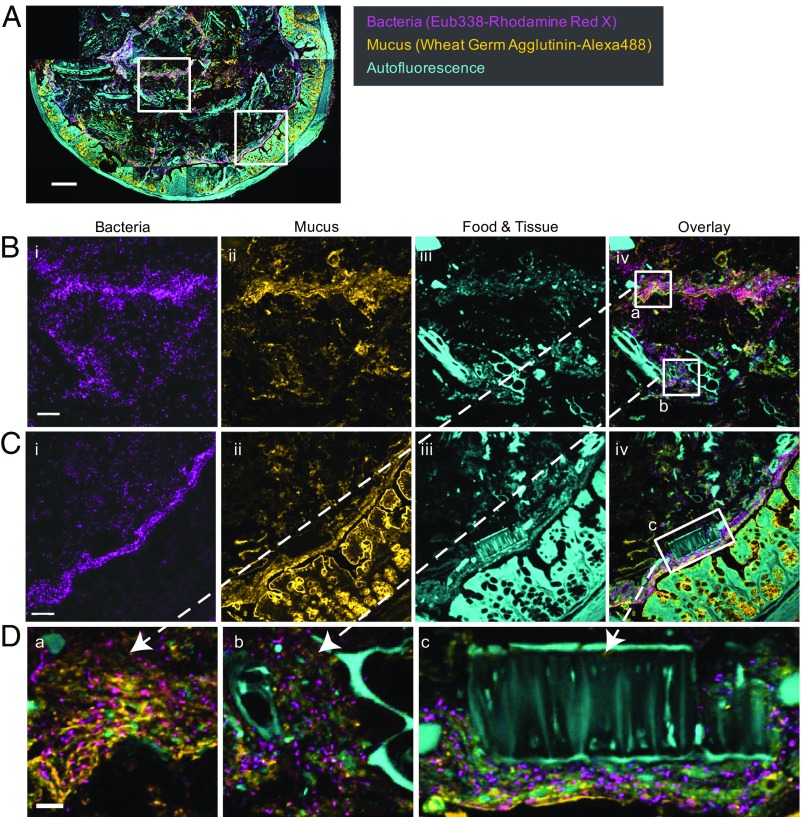
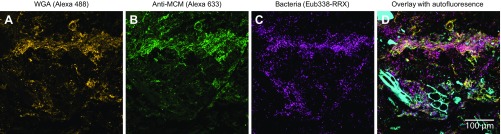
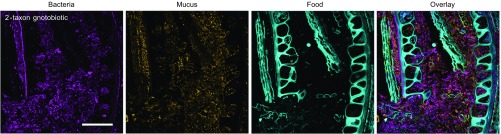
Knowledge of the spatial organization of the gut microbiota is important for understanding the physical and molecular interactions among its members. These interactions are thought to influence microbial succession, community stability, syntrophic relationships, and resiliency in the face of perturbations. The complexity and dynamism of the gut microbiota pose considerable challenges for quantitative analysis of its spatial organization. Here, we illustrate an approach for addressing this challenge, using (i) a model, defined 15-member consortium of phylogenetically diverse, sequenced human gut bacterial strains introduced into adult gnotobiotic mice fed a polysaccharide-rich diet, and (ii) in situ hybridization and spectral imaging analysis methods that allow simultaneous detection of multiple bacterial strains at multiple spatial scales. Differences in the binding affinities of strains for substrates such as mucus or food particles, combined with more rapid replication in a preferred microhabitat, could, in principle, lead to localized clonally expanded aggregates composed of one or a few taxa. However, our results reveal a colonic community that is mixed at micrometer scales, with distinct spatial distributions of some taxa relative to one another, notably at the border between the mucosa and the lumen. Our data suggest that lumen and mucosa in the proximal colon should be conceptualized not as stratified compartments but as components of an incompletely mixed bioreactor. Employing the experimental approaches described should allow direct tests of whether and how specified host and microbial factors influence the nature and functional contributions of "microscale" mixing to the dynamic operations of the microbiota in health and disease.

Keywords: bacterial–bacterial interactions; community biogeography; gut microbial ecology; microbiome function; multiplex fluorescence imaging.


Conflict of interest statement

The authors declare no conflict of interest.

Figures

Fig. 1.
Fig. 1.
Experimental design and workflow. Germ-free mice were gavaged with a 15-member consortium of human gut bacterial strains and killed 14 d later. Segments of proximal colon were encased in agarose, fixed with formaldehyde, embedded in glycol methacrylate (GMA) resin, sectioned, and hybridized with fluorescent probes. The resin remained in place during hybridization and imaging steps, preserving 3D spatial structure. Gut cross-sections were imaged as a tile scan of multiple fields of view to image entire sections at high resolution. Each field of view was imaged by excitation with six laser lines sequentially and processed by linear unmixing to create separate images for each of nine fluorophores and for autofluorescence from host tissue and ingested food particles. Each image was then segmented into binary images to allow for an automated count of cells in each square of an 8 × 8 grid for each field of view. The results are displayed as a heat map of cell abundance. The unmixed fluorophore channels were also false-colored and overlaid to produce the final unmixed image.
Fig. S1.
Fig. S1.
Spectral profiles demonstrating the specificity of FISH probes. A pure culture of each bacterial strain was hybridized with the probe targeting that strain and with a mixture of all 15 probes. Images of cells were acquired with excitation wavelengths of 633, 594, 561, 514, 488, and 405 nm sequentially. The resulting six image stacks were concatenated, and a single reference spectrum was measured from the concatenated stack. The fluorescence emission spectrum obtained from the single-probe hybridization (blue) is shown plotted with the emission spectrum from the probe mixture hybridization (red). Where spectra are identical, no cross-hybridization occurs. Additional peaks in the probe mixture spectrum indicate cross-hybridization; e.g., the spectrum in D indicates cross-hybridization of the B. thetaiotaomicron probe to B. ovatus. Despite cross-hybridization, strains are clearly differentiable based on the distinct shapes of the emission spectra. (A) B. thetaiotaomicron. (B) B. cellulosilyticus. (C) B. vulgatus. (D) B. ovatus. (E) B. caccae. (F) B. uniformis. (G) P. distasonis. (H) E. rectale. (I) R. torques. (J) C. scindens. (K) C. spiroforme. (L) F. prausnitzii. (M) R. obeum. (N) D. longicatena. (O) C. aerofaciens.
Fig. S2.
Fig. S2.
Bacterial colonization is dense in the proximal colon and sparse in the ileum in the gnotobiotic mouse model. (A) A small number of bacterial cells are visible in the ileum of a mouse colonized with the 15-strain consortium. (B) The proximal colon, by contrast, shows dense colonization in the lumen. (C and D) Imaging verified the absence of bacteria from both the ileum and colon of a germ-free mouse. Samples were embedded in methacrylate resin, sectioned, subjected to FISH with the Eub338 probe, and stained with DAPI and fluorophore-conjugated WGA.
Fig. 2.
Fig. 2.
Microbes are most abundant near host tissue and in patches in the lumen. Microbial density in each region of the cross-section is shown as a heat map (A) representing the number of cells hybridizing to the Eub338 probe and ranging from zero (dark blue) to 158 cells (red) per 19 × 19 μm grid square. The heat map is overlaid on a tile scan (Inset) of the section showing autofluorescence from host tissue and ingested food particles. (B) The density of individual taxa or groups of taxa shows a similar distribution. (C) A line-scan analysis of cell abundance along transects perpendicular to host tissue illustrates that taxa have similar distributions at this scale. Values shown are the percent of cells observed in each quantum of the transect, and are the mean of 245 transects from a total of five intestinal cross-sections from two mice. Transects consisted of 24 adjacent grid squares placed so that the fifth grid square contained the first bacterial cell labeled with the universal probe Eub338. Thus, the first four grid squares (76 µm) of each transect line would be empty unless occupied with a bacterial cell hybridizing to a specific probe but not to Eub338.
Fig. 3.
Fig. 3.
Colonization patterns in distinct microhabitats in the colon. Tiled images show the distribution of microbes relative to host tissue and large autofluorescent food particles. Images shown are representative of the region proximal to the epithelium (A and B), the region distal to the epithelium (lumen; C), and crypts (D). White boxes show the positions of higher magnification views (Lower) where individual bacterial cells are visible; low-magnification image in C shows the image location in the lumen. Microbes were spatially mixed at micrometer scales in all microhabitats. Legend in A also applies to C. Scale bars in D apply throughout the figure.
Fig. 4.
Fig. 4.
Spatial analysis of bacteria relative to visible landmarks. A tiled image (Upper Left) was segmented to identify bacterial cells and to outline the edge of large food particles, host tissue, and the edge of dense colonization (Upper Right; orange, green, and purple lines). Spatial correlation analysis was carried out using the method of linear dipoles (57), which calculates the pair cross-correlation function as the probability that two categories of object are located at a given distance from one another, normalized to their density in the image. This analysis revealed that bacteria tend to localize within 30 µm of the marked edge of colonization, but are underrepresented within 20 µm of the epithelium and within 5–10 µm of large food particles. Interiors of food particles and host tissue (Upper Right, magenta) were excluded from the analysis. Dotted lines indicate 95% confidence intervals generated by dividing the image into 10 radial sectors for analysis. Food particles and host tissue were identified by autofluorescence with 405-nm excitation, and their edges were outlined by eroding the image by seven pixels (∼1 µm) using FIJI. The edge of dense colonization was outlined by hand.
Fig. 5.
Fig. 5.
Distinctive community organization in the 10 µm closest to the mucosa. The microbial community near the mucosal epithelium is abundantly populated by B. cellulosilyticus, but R. torques is underrepresented in a narrow band close to the mucosa. The white boxed area in Inset shown in Upper Left denotes the field shown at higher magnification in Upper Left and Lower Left. (Upper Left) A representative image near the mucosa showing all taxa and a 1-µm-thick line representing the edge of microbial colonization. (Upper Right) Pair cross-correlation (PCC) analysis showing the probability of detecting a cell at each distance from the line, normalized to the density of cells in the image. Analysis was carried out using the method of linear dipoles as implemented in DAIME (57). (Lower Left) The B. cellulosilyticus and R. torques channels are shown separately for clarity and to demonstrate the rarity of R. torques in the 5- to 10-µm zone at the edge of the microbe-dense region. (Lower Right) Results of PCC analysis depicted as the mean of all 11 images from two sections in which a 100 µm length and 40 µm width of mucosal border was visible. Confidence intervals of 95% are shown for these two bacterial strains.
Fig. 6.
Fig. 6.
Distinctive organization of microbes relative to one another. Abundance of each taxon was tabulated within 1,572 grid squares measuring 19 × 19 μm (cf. individual squares in the heat map in Fig. 2) from a section hybridized with the species-specific probe set 1. Scatter plots of individual taxa show that the abundance of B. cellulosilyticus and B. vulgatus are positively correlated (Upper Left) while the abundance of B. cellulosilyticus and R. torques are negatively correlated (Upper Right). Scatter plots include only those grid squares that contain a high density of bacterial cells (at least 50% of the maximum density). An image of such a densely populated region (Lower) shows that B. cellulosilyticus and B. vulgatus are abundant in the same region of the image, while the abundance of R. torques is highest where abundance of the Bacteroides is low. These spatial relationships are consistent across mice, as demonstrated by analysis of both mice with the comprehensive probe set 3 (Fig. S4).
Fig. S3.
Fig. S3.
Correlation of bacterial abundance overall and in densely populated regions of images. Abundance of each bacterial strain was tabulated within 19 × 19 μm grid squares from a section hybridized with probe set 1, and the percent representation of the most abundant taxon, B. cellulosilyticus, was plotted against each of four less-abundant taxa. Left presents data for all 1,572 grid squares containing at least one bacterial cell; Right shows the 160 grid squares with at least 67 bacterial cells (equals half the maximum bacterial abundance of 134 cells per grid square). Taxon abundances are positively correlated when all data are considered (Left) but show variable relationships when considering only grid squares that contain a high density of bacterial cells (at least 50% of the maximum density).
Fig. S4.
Fig. S4.
Distinctive organization of microbes relative to one another is consistent across mice and probe sets. The abundance of each taxon was tabulated within 19 × 19 μm grid squares from three sections from mouse 1 and two sections from mouse 2, all hybridized with probe set 3. The abundance of the most abundant taxon, B. cellulosilyticus, was plotted against the abundance of the set of B. thetaiotaomicron, B. ovatus, B. vulgatus, and B. uniformis all hybridized with the same fluorophore (“four Bacteroides”) and against R. torques and C. aerofaciens. Scatter plots include only grid squares that contained a high density of bacterial cells (at least 50% of the maximum density). Relative abundance relationships are modest but consistent across mice and consistent with those found using probe set 1 (Fig. 6).
Fig. 7.
Fig. 7.
Dense bacterial aggregations occupy regions rich in mucus. (A) Cross-section of colon highlighting location of panels shown at higher magnification below. (B) Bacterial density (i) is heterogeneous in the lumen. Staining with fluorophore-labeled WGA (ii) shows high density of mucus in areas of the lumen that contain abundant bacteria. Large autofluorescent food particles (iii) occupy areas of the lumen in which bacterial density is low. (iv) Overlay of iiii. (C) Bacterial density (i) is also high in a narrow zone located at the edge of the mucosa. WGA staining (ii) shows a high density of mucus in this zone. Autofluorescent food particles (iii) are located within micrometers of the mucosa. (D) High-magnification views showing regions of the lumen with abundant mucus (a), large food particles (b), and a large food particle pressed close to the mucosa (c). The cross-section shown is adjacent to the one presented in Fig. 2. (Scale bars: A, 200 μm; B and C, 50 μm; D, 10 μm.)
Fig. S5.
Fig. S5.
Visualizing mucus, bacteria, and partially digested food particles in a colonic section. (A and B) Visualization of mucus with wheat germ agglutinin labeled with Alexa 488 (A) and Alexa 633-labeled antibodies directed at mouse colonic mucin (B). (C) Bacteria, identified by hybridization to the Rhodamine Red X-conjugated Eub338 probe, are most abundant in regions with abundant mucus. (D) Overlay of mucus stains, bacteria, and partially digested food particles (cyan).
Fig. S6.
Fig. S6.
Dense bacterial aggregations occupy areas rich in mucus. Images from a two-taxon gnotobiotic mouse colonized with B. thetaiotaomicron and E. rectale are comparable to images from the gnotobiotic mouse colonized with 15 taxa (Fig. 7) and show heterogeneous bacterial density in the lumen (magenta), with a high density of mucus labeled with wheat germ agglutinin (orange) in areas that contain abundant bacteria. Large autofluorescent food particles (cyan) occupy areas of the lumen where bacterial density is low. Methacrylate sections were hybridized with the Eub338 oligonucleotide probe labeled with Alexa 647 as well as species probes labeled with Rhodamine Red X and Alexa 594. Mucus was visualized with wheat germ agglutinin labeled with Alexa 488. Food autofluorescence spectra were read directly from the images for use in linear unmixing. (Scale bar: 100 μm.)

References

    1. Kolenbrander PE, Palmer RJ, Jr, Periasamy S, Jakubovics NS. Oral multispecies biofilm development and the key role of cell-cell distance. Nat Rev Microbiol. 2010;8:471–480. - PubMed
    1. Fischbach MA, Sonnenburg JL. Eating for two: How metabolism establishes interspecies interactions in the gut. Cell Host Microbe. 2011;10:336–347. - PMC - PubMed
    1. Traxler MF, Watrous JD, Alexandrov T, Dorrestein PC, Kolter R. Interspecies interactions stimulate diversification of the Streptomyces coelicolor secreted metabolome. MBio. 2013;4:e00459-13. - PMC - PubMed
    1. Wu M, et al. Genetic determinants of in vivo fitness and diet responsiveness in multiple human gut Bacteroides. Science. 2015;350:aac5992. - PMC - PubMed
    1. Earle KA, et al. Quantitative imaging of gut microbiota spatial organization. Cell Host Microbe. 2015;18:478–488. - PMC - PubMed

Publication types

LinkOut - more resources