. 2017 Oct 26;13(10):e1005757.
doi: 10.1371/journal.pcbi.1005757. eCollection 2017 Oct.

Dynamics and heterogeneity of brain damage in multiple sclerosis

Affiliations

Dynamics and heterogeneity of brain damage in multiple sclerosis

Ekaterina Kotelnikova et al. PLoS Comput Biol. .

Abstract

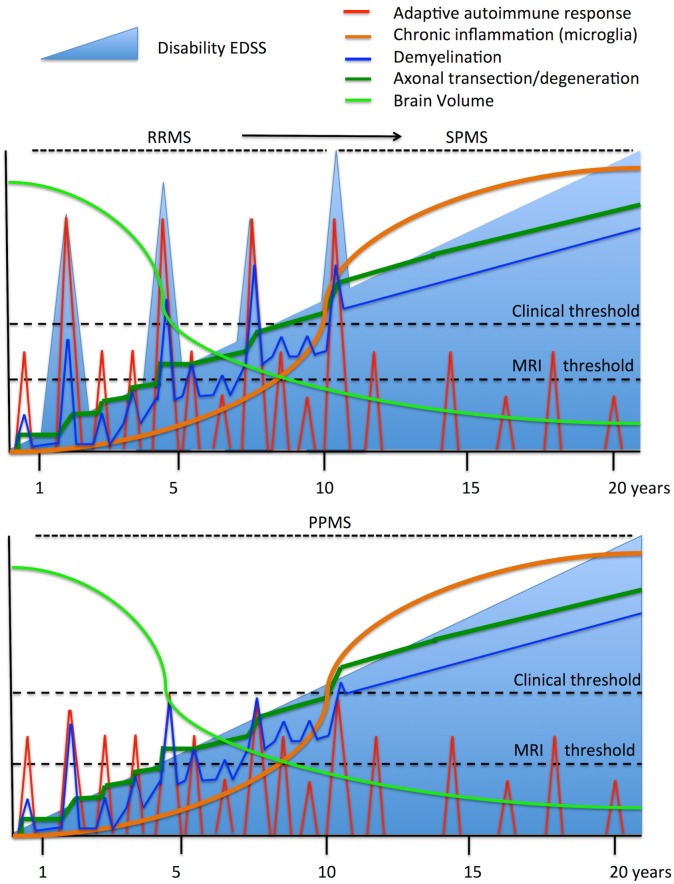
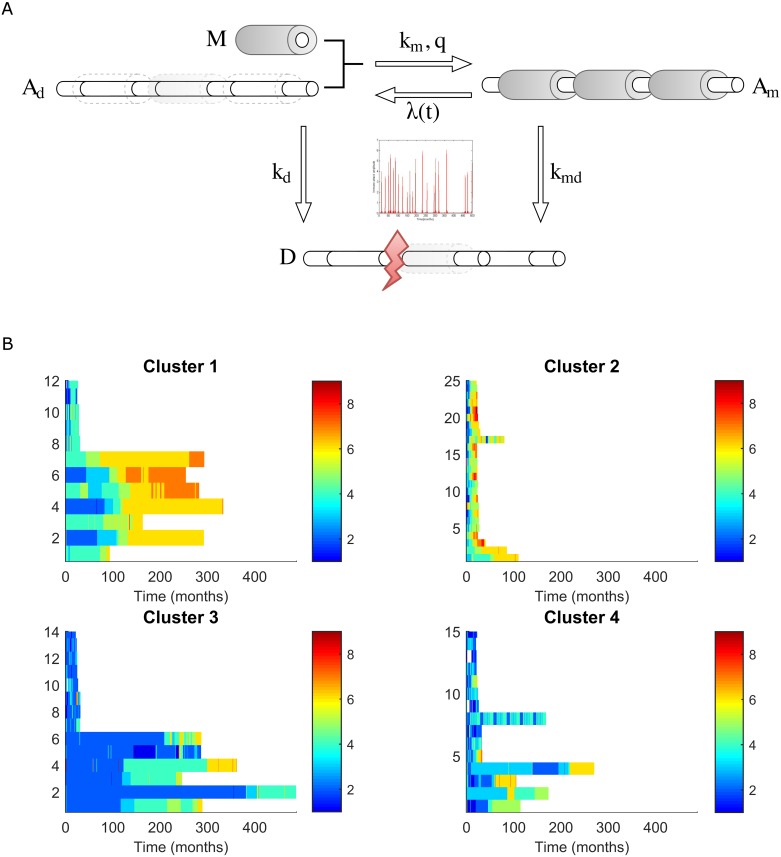
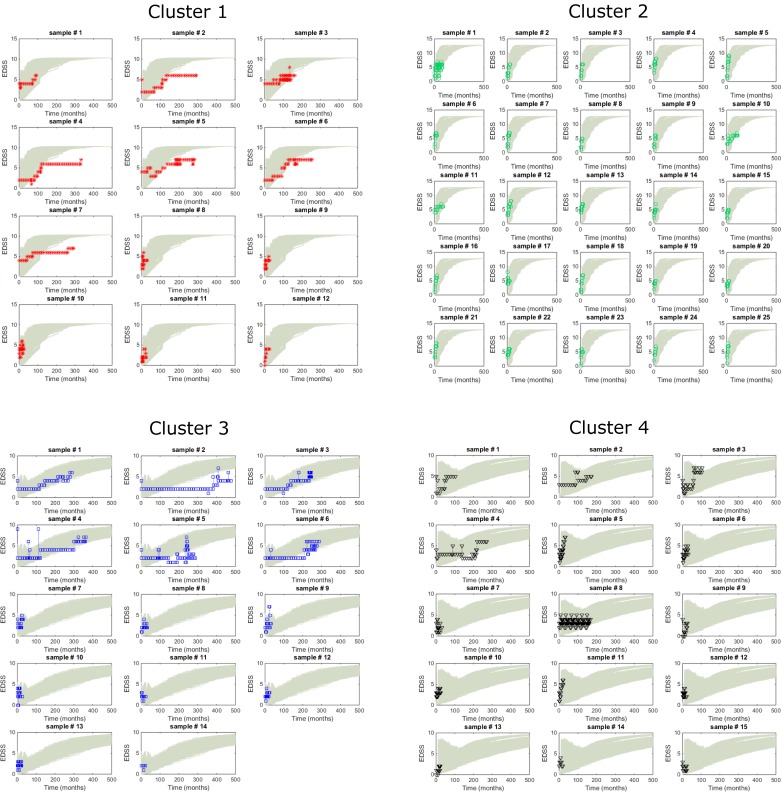
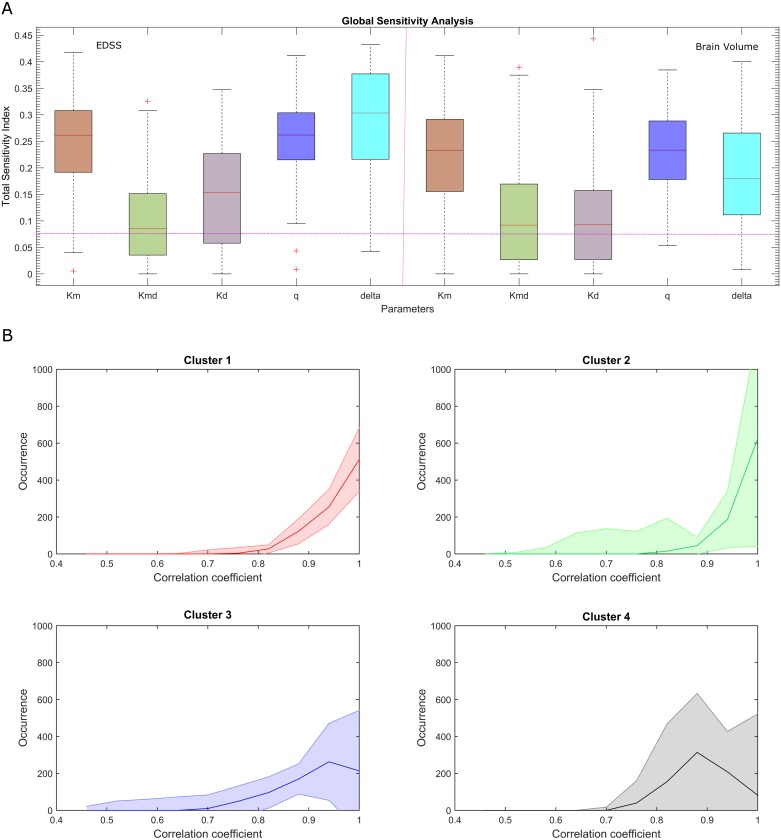
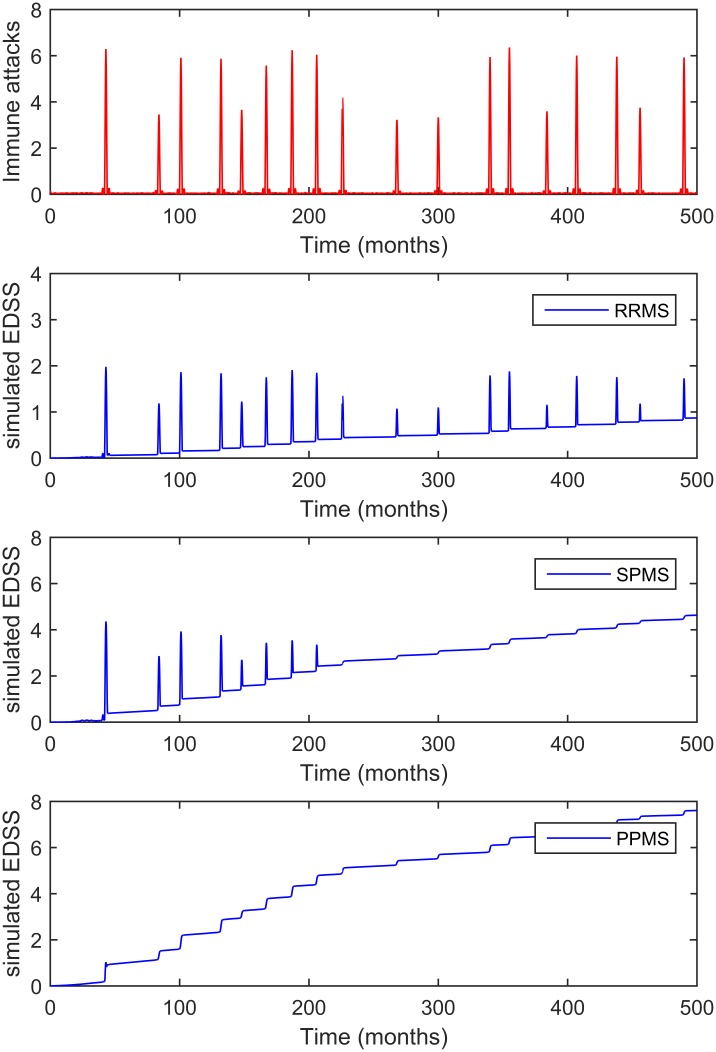
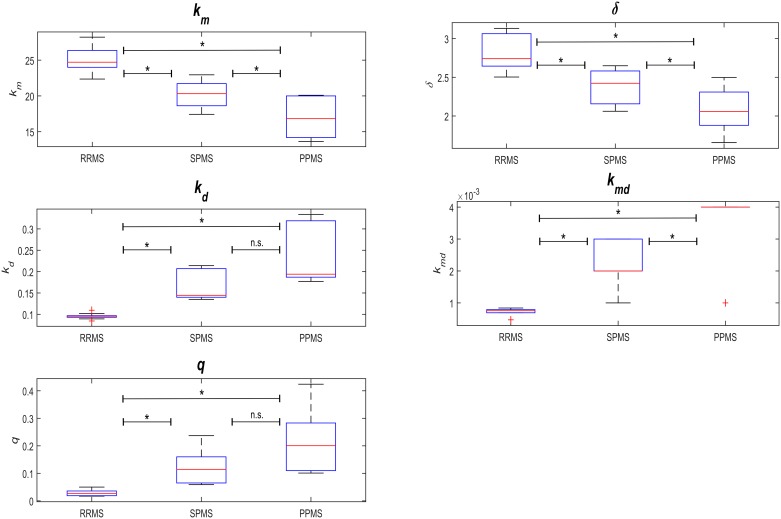
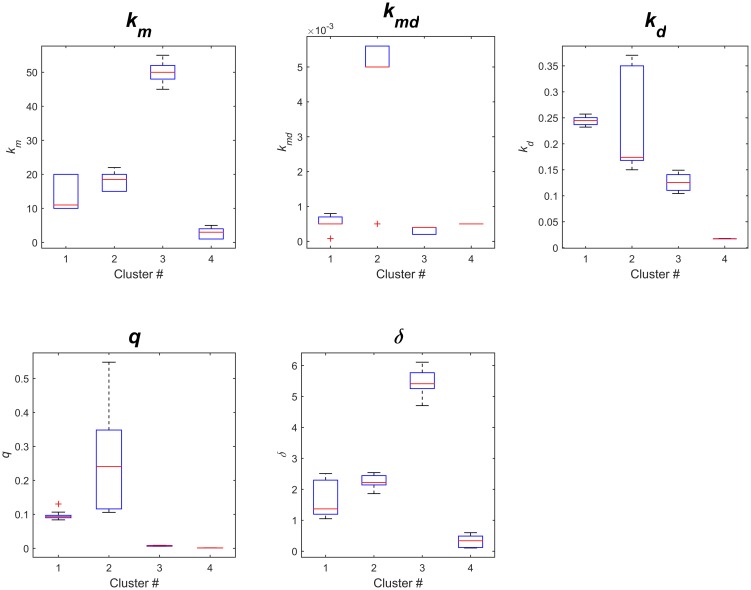
Multiple Sclerosis (MS) is an autoimmune disease driving inflammatory and degenerative processes that damage the central nervous system (CNS). However, it is not well understood how these events interact and evolve to evoke such a highly dynamic and heterogeneous disease. We established a hypothesis whereby the variability in the course of MS is driven by the very same pathogenic mechanisms responsible for the disease, the autoimmune attack on the CNS that leads to chronic inflammation, neuroaxonal degeneration and remyelination. We propose that each of these processes acts more or less severely and at different times in each of the clinical subgroups. To test this hypothesis, we developed a mathematical model that was constrained by experimental data (the expanded disability status scale [EDSS] time series) obtained from a retrospective longitudinal cohort of 66 MS patients with a long-term follow-up (up to 20 years). Moreover, we validated this model in a second prospective cohort of 120 MS patients with a three-year follow-up, for which EDSS data and brain volume time series were available. The clinical heterogeneity in the datasets was reduced by grouping the EDSS time series using an unsupervised clustering analysis. We found that by adjusting certain parameters, albeit within their biological range, the mathematical model reproduced the different disease courses, supporting the dynamic CNS damage hypothesis to explain MS heterogeneity. Our analysis suggests that the irreversible axon degeneration produced in the early stages of progressive MS is mainly due to the higher rate of myelinated axon degeneration, coupled to the lower capacity for remyelination. However, and in agreement with recent pathological studies, degeneration of chronically demyelinated axons is not a key feature that distinguishes this phenotype. Moreover, the model reveals that lower rates of axon degeneration and more rapid remyelination make relapsing MS more resilient than the progressive subtype. Therefore, our results support the hypothesis of a common pathogenesis for the different MS subtypes, even in the presence of genetic and environmental heterogeneity. Hence, MS can be considered as a single disease in which specific dynamics can provoke a variety of clinical outcomes in different patient groups. These results have important implications for the design of therapeutic interventions for MS at different stages of the disease.


Conflict of interest statement

The authors have declared that no competing interests exist.

Figures

Fig 1
Fig 1. Dynamics of the clinical and pathogenic processes in MS.
The upper panel shows the evolution of relapsing-remitting MS (RRMS) and its transition to secondary-progressive MS (SPMS), while the bottom panel shows the evolution of primary-progressive MS (PPMS). The autoimmune process starts in the peripheral immune system, inducing episodes of CNS inflammation (red line) that subsequently provokes demyelination (blue line) and then axon degeneration (dark green line). Although inflammation and demyelination may experience remissions, axon degeneration accumulates over time, as does chronic compartmentalized inflammation (orange line). If inflammatory infiltrates affect eloquent CNS regions and exceed damage thresholds, they manifest as clinical relapses. Alternatively, when cumulative axon degeneration surpasses the capacity of the functional CNS reserve, permanent neurological disability arises (light blue line) and there is a transition to the progressive disease. The decrease in brain volume over time is more severe at the beginning of the disease, in parallel with more intense inflammatory activity, and it continues steadily as the disease evolves. PPMS follows the same processes but the inflammatory relapses are not translated into clinical relapses, either because they are less frequent, less severe or they affect silent (non-eloquent) areas. Only when axon degeneration reaches a clinical threshold is disability manifested as progressive. Therefore, there are no differences between SPMS and PPMS except for the relative clinical impact (relapses) of acute inflammatory activity.
Fig 2
Fig 2. The ODE model of CNS damage in MS.
A) The model represents the volume occupied by axons and myelin: Right, the healthy CNS is composed of myelinated axons (Am); Center, inflammatory attack is represented by the time-dependent parameter λ(t), which arises from the Generalized Extreme Value (GEV) distribution of the EDSS time-series, producing either demyelination (right) or degeneration of axons (bottom); Left, demyelinated axons (Ad) can be remyelinated with myelin produced by oligodendrocytes (M), as a function of the parameters km and q; Bottom, myelinated or demyelinated axons can be lost by either acute axon transection or degeneration (D), according to the parameters kmd or kd respectively. B) Clustering MS patients based on the EDSS time series. The horizontal axes correspond to the time in months (maximum = 16 months), while the vertical axes correspond to the patients. Each line represents the EDSS of a given patient over time, using a color scale to reflect the EDSS. Clusters 1 and 2 include patients that maintain an intermediate short term EDSS and that reach a high EDSS in the long term. Cluster 3 includes patients that maintain a low short term EDSS and that achieve an intermediate EDSS in the long term. Cluster 4 represents a more heterogeneous group.
Fig 3
Fig 3. Comparison of the EDSS time-series and model simulations.
Comparison of the EDSS scores from all the patients in the longitudinal cohort as a function of their cluster (each patient from the discovery cohort is shown separately and identified with a cluster-specific color: red, cluster 1; green, cluster 2; blue, cluster 3 and black, cluster 4) and in accordance with the model’s predictions (grey lines, each line corresponds to an individual simulation).
Fig 4
Fig 4. Sensitivity analysis of the model’s parameters.
A) A sensitivity analysis showing the effects of the uncertainties in parameters on the model’s behavior (output variables: EDSS and brain volume—BV). The extended version of a Fourier amplitude sensitivity test (eFAST) was used to quantify the relative importance of the input factors. Pink line indicates the sensitivity level of a dummy parameter that does not occur in any of the equations. Sensitivities below this line should not be considered significantly different from zero. B) Simulations of brain volume in MS. Median occurrence and interquartile range (IQR) for the correlation coefficients between the experimental and simulated BVs in the validation cohort. Pearson correlation coefficients: cluster 1, 0.93; cluster 2, 0.94; cluster 3, 0.86; and cluster 4, 0.87.
Fig 5
Fig 5. Simulations of the model that reproduce the MS subtypes.
The top panel shows an example of the dynamics of autoimmune attacks (derived from the T cell model and adjusted for the EDSS distribution), and the bottom panels reproduce the dynamics of the EDSS in function of the fine-tuning of the parameters defining axon degeneration and de/remyelination, reproducing the RRMS, SPMS and PPMS disease courses, respectively. In the model, each increase in the EDSS is the consequence of an inflammatory attack, yet in the progressive phenotypes (SPMS and PPMS), they are observed as small and discrete increases in the EDSS.
Fig 6
Fig 6. Model parameters for the studied disease subtypes.
Parameter distribution for the different disease subtypes were analyzed through pairwise Wilcoxon tests (S2 Table).
Fig 7
Fig 7. Analysis of the distribution of the EDSS time series.
A) Distribution of the time intervals between the clinical relapses. The distribution is derived from the experimental data of the EDSS time series (orange), simulations from the ODE model of T cell cross-regulation [4] (light blue) and the results from the GEV distribution model (red line). B-C) Examples of the analysis of the EDSS time-series in patients with MS. Incremental changes in EDSS over time in the experimental series for (B) PPMS and (C) SPMS. The onset of ΔEDSS is marked with an asterisk.
Fig 8
Fig 8. The distribution of the model’s parameters calculated for the four clusters.
Each boxplot shows the distribution of each parameter in the model for each of the clusters: km, kmd, kd, q, and δ.

Similar articles

Cited by

References

    1. Hauser SL, Oksenberg JR. The neurobiology of multiple sclerosis: genes, inflammation, and neurodegeneration. Neuron. 2006;52(1):61–76. doi: 10.1016/j.neuron.2006.09.011 . - DOI - PubMed
    1. Lublin FD, Reingold SC, Cohen JA, Cutter GR, Sorensen PS, Thompson AJ, et al. Defining the clinical course of multiple sclerosis: The 2013 revisions. Neurology. 2014;83(3):278–86. doi: 10.1212/WNL.0000000000000560 - DOI - PMC - PubMed
    1. Velez de Mendizabal N, Hutmacher MM, Troconiz IF, Goni J, Villoslada P, Bagnato F, et al. Predicting relapsing-remitting dynamics in multiple sclerosis using discrete distribution models: a population approach. PLoS One. 2013;8(9):e73361 doi: 10.1371/journal.pone.0073361 - DOI - PMC - PubMed
    1. Velez de Mendizabal N, Carneiro J, Sole RV, Goni J, Bragard J, Martinez-Forero I, et al. Modeling the effector—regulatory T cell cross-regulation reveals the intrinsic character of relapses in Multiple Sclerosis. BMC Syst Biol. 2011;5:114 Epub 2011/07/19. doi: 10.1186/1752-0509-5-114 - DOI - PMC - PubMed
    1. Iranzo J, Villoslada P. Autoimmunity and tumor immunology: two facets of a probabilistic immune system. BMC Syst Biol. 2014;8:120 doi: 10.1186/s12918-014-0120-4 - DOI - PMC - PubMed

MeSH terms