. 2017 Oct 26;13(10):e1005759.
doi: 10.1371/journal.pcbi.1005759. eCollection 2017 Oct.

Modeling the adenosine system as a modulator of cognitive performance and sleep patterns during sleep restriction and recovery

Affiliations

Modeling the adenosine system as a modulator of cognitive performance and sleep patterns during sleep restriction and recovery

Andrew J K Phillips et al. PLoS Comput Biol. .

Abstract

Sleep loss causes profound cognitive impairments and increases the concentrations of adenosine and adenosine A1 receptors in specific regions of the brain. Time courses for performance impairment and recovery differ between acute and chronic sleep loss, but the physiological basis for these time courses is unknown. Adenosine has been implicated in pathways that generate sleepiness and cognitive impairments, but existing mathematical models of sleep and cognitive performance do not explicitly include adenosine. Here, we developed a novel receptor-ligand model of the adenosine system to test the hypothesis that changes in both adenosine and A1 receptor concentrations can capture changes in cognitive performance during acute sleep deprivation (one prolonged wake episode), chronic sleep restriction (multiple nights with insufficient sleep), and subsequent recovery. Parameter values were estimated using biochemical data and reaction time performance on the psychomotor vigilance test (PVT). The model closely fit group-average PVT data during acute sleep deprivation, chronic sleep restriction, and recovery. We tested the model's ability to reproduce timing and duration of sleep in a separate experiment where individuals were permitted to sleep for up to 14 hours per day for 28 days. The model accurately reproduced these data, and also correctly predicted the possible emergence of a split sleep pattern (two distinct sleep episodes) under these experimental conditions. Our findings provide a physiologically plausible explanation for observed changes in cognitive performance and sleep during sleep loss and recovery, as well as a new approach for predicting sleep and cognitive performance under planned schedules.


Conflict of interest statement

EBK received travel reimbursement from the Sleep Technology Council and has served as an expert witness in cases involving transportation safety and sleep deprivation.

Figures

Fig 1
Fig 1. Schematic of the mathematical model.
Sleep/wake state determines the dynamics of the total adenosine concentration, Atot, with Atot increasing in wake and decreasing in sleep. This pool fractionates into the concentrations of those unbound, Au, those that are bound to A1 receptors, A1,b, and those that are bound to A2A receptors, A2,b. The model also includes pools of A1 and A2A receptors, with total concentrations of Rn,tot, n = 1 or 2, which fractionate into bound, Rn,b, and unbound Rn,u,. The total concentration of A1 receptors, R1,tot = R1,b + R1,u, changes in response to adenosine concentration by attempting to achieve a homeostatic level of fractional occupancy, R1,b/R1,tot. For modeling sleep and performance, R1,b is used as the sleep homeostatic process. This is added to a circadian process to give the overall sleep drive, D. A sigmoid function is then used to convert D into PVT lapses, P.
Fig 2
Fig 2. Dynamics of the adenosine model under two simulated conditions: Acute sleep deprivation for 4 days (red line), and chronic sleep restriction with 4 h sleep per night for 8 days (black line).
Four model variables are shown as functions of time: (A) Unbound adenosine concentration, Au. (B) Total adenosine concentration, Atot. (C) Bound A1 receptor concentration, R1,b, which is used as a proxy for sleep homeostatic pressure in the model. (D) Total A1 receptor concentration, R1,tot. Red horizontal lines represent the level of each variable at the end of the 4 days of acute sleep deprivation.
Fig 3
Fig 3. PVT data (open triangles) and simulations (filled circles) for Experiment 1, with time in bed (TIB) illustrated as gray bars.
Panels show four experimental conditions: (A) Acute sleep deprivation with 0 h TIB, (B) 4 h TIB for 13 nights, then 2 nights of 8 h TIB, (C) 6 h TIB for 13 nights, then 2 nights of 8 h TIB, (D) 8 h TIB for 15 nights. PVT data were collected every 2 h during wakefulness, beginning 4 h after morning awakening, which was simulated to occur at 8am in all conditions (schedules from experimental data were shifted by 0.5 h for convenience). Zero time on the x-axis corresponds to midnight on the last baseline night. Data points are adapted from [17].
Fig 4
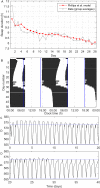
Fig 4. Daily sleep durations and sleep patterns during recovery from sleep chronically restricted to 7 h per night, with sleep allowed for 14 h per day from 18:00 to 8:00.
(A) Daily sleep durations over 28 days for experimental data [40] and the model’s best fit. (B) Sleep patterns exhibited by the model across 50 days, displayed as a raster diagram, with black bars corresponding to sleep. The data are double plotted. During different stages of recovery, the model predicts both monophasic sleep (one sleep episode per day) and biphasic sleep (two sleep episodes per day). Vertical blue lines indicate the start and end of allowed sleep times. (C) and (D) show the sleep drive as a function of time across days 1–20 and 21–40 respectively, with the blue dashed lines representing the upper and lower sleep/wake thresholds.
Fig 5
Fig 5
Mathematical structure of (A) previous mathematical models based on the two-process model, and (B) the physiologically based adenosine model developed here. Arrows show functional dependences between model variables.

Similar articles

Cited by

References

    1. Jewett ME, Dijk DJ, Kronauer RE, Dinges DF. Dose-response relationship between sleep duration and human psychomotor vigilance and subjective alertness. Sleep. 1999; 22: 171–179. - PubMed
    1. Drummond SPA, Paulus MP, Tapert SF. Effects of two nights sleep deprivation and two nights recovery sleep on response inhibition. J Sleep Res. 2006; 15: 261–265. doi: 10.1111/j.1365-2869.2006.00535.x - DOI - PubMed
    1. Cohen DA, Wang W, Wyatt JK, Kronauer RE, Dijk DJ, Czeisler CA, et al. Uncovering residual effects of chronic sleep loss on human performance. Sci Trans Med. 2010; 2: 14ra3 - PMC - PubMed
    1. Van Dongen HPA, Maislin G, Mullington JM, Dinges DF. The cumulative cost of additional wakefulness: Dose-response effects on neurobehavioral functions and sleep physiology from chronic sleep restriction and total sleep deprivation. Sleep. 2003; 26: 117–126. - PubMed
    1. Belenky G, Wesenstein NJ, Thorne DR, Thomas ML, Sing HC, Redmond DP, et al. Patterns of performance degradation and restoration during sleep restriction and subsequent recovery: A sleep dose-response study. J Sleep Res. 2003; 12: 1–12. - PubMed

LinkOut - more resources