

Pendular energy transduction within the step during human walking on slopes at different speeds
- PMID: 29073208
- PMCID: PMC5658120
- DOI: 10.1371/journal.pone.0186963
Pendular energy transduction within the step during human walking on slopes at different speeds
Abstract
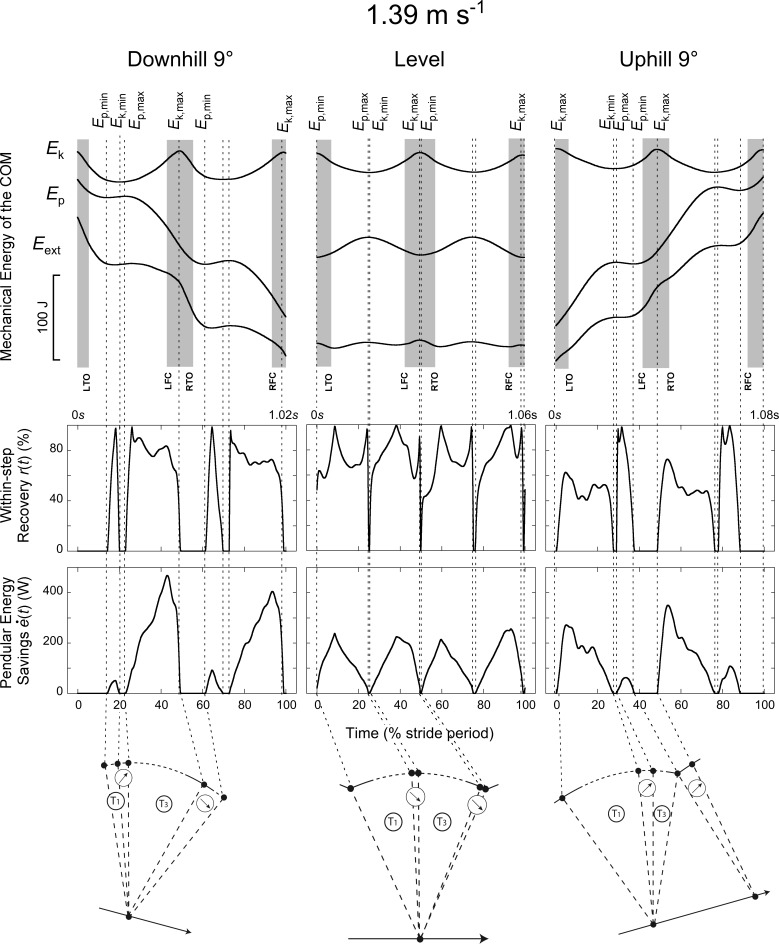
When ascending (descending) a slope, positive (negative) work must be performed to overcome changes in gravitational potential energy at the center of body mass (COM). This modifies the pendulum-like behavior of walking. The aim of this study is to analyze how energy exchange and mechanical work done vary within a step across slopes and speeds. Ten subjects walked on an instrumented treadmill at different slopes (from -9° to 9°), and speeds (between 0.56 and 2.22 m s-1). From the ground reaction forces, we evaluated energy of the COM, recovery (i.e. the potential-kinetic energy transduction) and pendular energy savings (i.e. the theoretical reduction in work due to this recovered energy) throughout the step. When walking uphill as compared to level, pendular energy savings increase during the first part of stance (when the COM is lifted) and decreases during the second part. Conversely in downhill walking, pendular energy savings decrease during the first part of stance and increase during the second part (when the COM is lowered). In uphill and downhill walking, the main phase of external work occurs around double support. Uphill, the positive work phase is extended during the beginning of single support to raise the body. Downhill, the negative work phase starts before double support, slowing the downward velocity of the body. Changes of the pendulum-like behavior as a function of slope can be illustrated by tilting the 'classical compass model' backwards (uphill) or forwards (downhill).
Conflict of interest statement
Figures


Similar articles
-
Mechanical energy fluctuations during hill walking: the effects of slope on inverted pendulum exchange.J Exp Biol. 2006 Dec;209(Pt 24):4895-900. doi: 10.1242/jeb.02584. J Exp Biol. 2006. PMID: 17142678
-
The pendular mechanism does not determine the optimal speed of loaded walking on gradients.Hum Mov Sci. 2016 Jun;47:175-185. doi: 10.1016/j.humov.2016.03.008. Epub 2016 Mar 24. Hum Mov Sci. 2016. PMID: 27017543
-
Mechanical work performed by the individual legs during uphill and downhill walking.J Biomech. 2012 Jan 10;45(2):257-62. doi: 10.1016/j.jbiomech.2011.10.034. Epub 2011 Nov 17. J Biomech. 2012. PMID: 22099148 Free PMC article. Clinical Trial.
-
Patterns of mechanical energy change in tetrapod gait: pendula, springs and work.J Exp Zool A Comp Exp Biol. 2006 Nov 1;305(11):899-911. doi: 10.1002/jez.a.334. J Exp Zool A Comp Exp Biol. 2006. PMID: 17029267 Review.
-
Estimating Energy Expenditure during Level, Uphill, and Downhill Walking.Med Sci Sports Exerc. 2019 Sep;51(9):1954-1960. doi: 10.1249/MSS.0000000000002002. Med Sci Sports Exerc. 2019. PMID: 30973477 Review.
Cited by
-
Effects of real-time feedback during decline walking on kinematic and kinetic gait parameters in a healthy population: study protocol for a randomized trial - up and down.Trials. 2021 Jul 22;22(1):477. doi: 10.1186/s13063-021-05422-2. Trials. 2021. PMID: 34294137 Free PMC article.
-
Differential activation of lumbar and sacral motor pools during walking at different speeds and slopes.J Neurophysiol. 2019 Aug 1;122(2):872-887. doi: 10.1152/jn.00167.2019. Epub 2019 Jul 10. J Neurophysiol. 2019. PMID: 31291150 Free PMC article.
-
Kinematic patterns while walking on a slope at different speeds.J Appl Physiol (1985). 2018 Aug 1;125(2):642-653. doi: 10.1152/japplphysiol.01020.2017. Epub 2018 Apr 26. J Appl Physiol (1985). 2018. PMID: 29698109 Free PMC article.
-
On the simple calculation of walking efficiency without kinematic information for its convenient use.J Physiol Anthropol. 2019 Dec 30;38(1):17. doi: 10.1186/s40101-019-0211-4. J Physiol Anthropol. 2019. PMID: 31888750 Free PMC article.
-
Human walking biomechanics on sand substrates of varying foot sinking depth.J Exp Biol. 2024 Nov 1;227(21):jeb246787. doi: 10.1242/jeb.246787. Epub 2024 Nov 5. J Exp Biol. 2024. PMID: 39263739 Free PMC article.
References
-
- Cavagna GA, Franzetti P, Fuchimoto T. The mechanics of walking in children. The Journal of Physiology. 1983;343(1):323–39. doi: 10.1113/jphysiol.1983.sp014895 - DOI - PMC - PubMed
-
- Ivanenko YP, Dominici N, Cappellini G, Dan B, Cheron G, Lacquaniti F. Development of pendulum mechanism and kinematic coordination from the first unsupported steps in toddlers. Journal of Experimental Biology. 2004;207(21):3797–810. doi: 10.1242/jeb.01214 - DOI - PubMed
-
- Lejeune TM, Willems PA, Heglund NC. Mechanics and energetics of human locomotion on sand. Journal of Experimental Biology. 1998;201(13):2071–80. - PubMed
-
- Gottschall JS, Kram R. Mechanical energy fluctuations during hill walking: The effects of slope on inverted pendulum exchange. Journal of Experimental Biology. 2006;209(24):4895–900. doi: 10.1242/jeb.02584 - DOI - PubMed
MeSH terms
LinkOut - more resources
Full Text Sources
Other Literature Sources
