. 2017 Oct 25;5(4):368-385.e15.
doi: 10.1016/j.cels.2017.09.014.

Denaturing CLIP, dCLIP, Pipeline Identifies Discrete RNA Footprints on Chromatin-Associated Proteins and Reveals that CBX7 Targets 3' UTRs to Regulate mRNA Expression

Affiliations

Denaturing CLIP, dCLIP, Pipeline Identifies Discrete RNA Footprints on Chromatin-Associated Proteins and Reveals that CBX7 Targets 3' UTRs to Regulate mRNA Expression

Michael Rosenberg et al. Cell Syst. .

Abstract

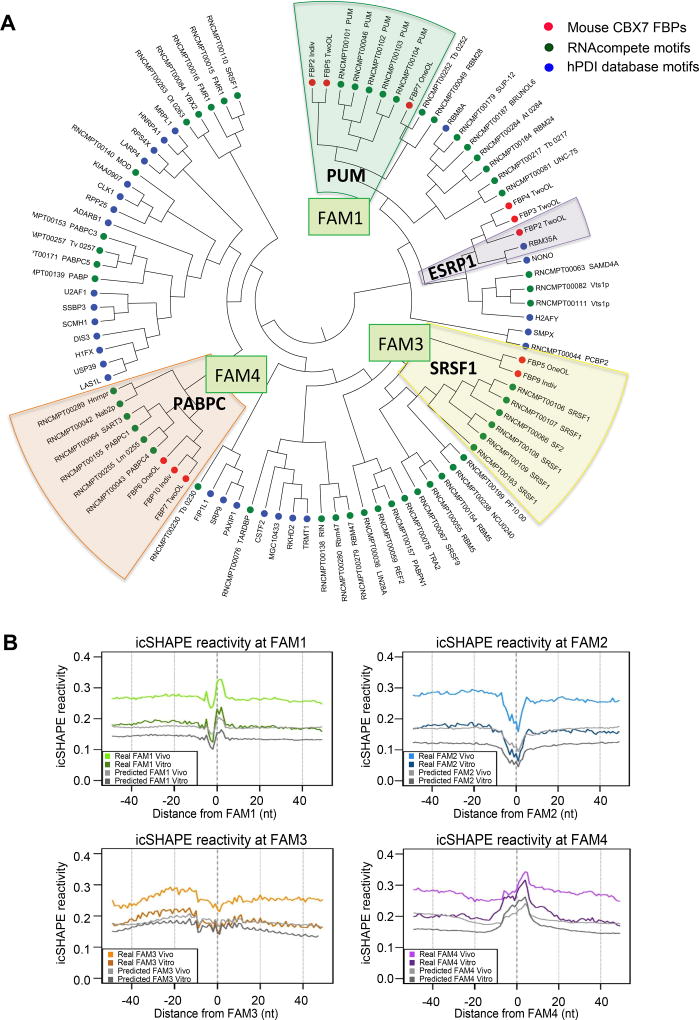
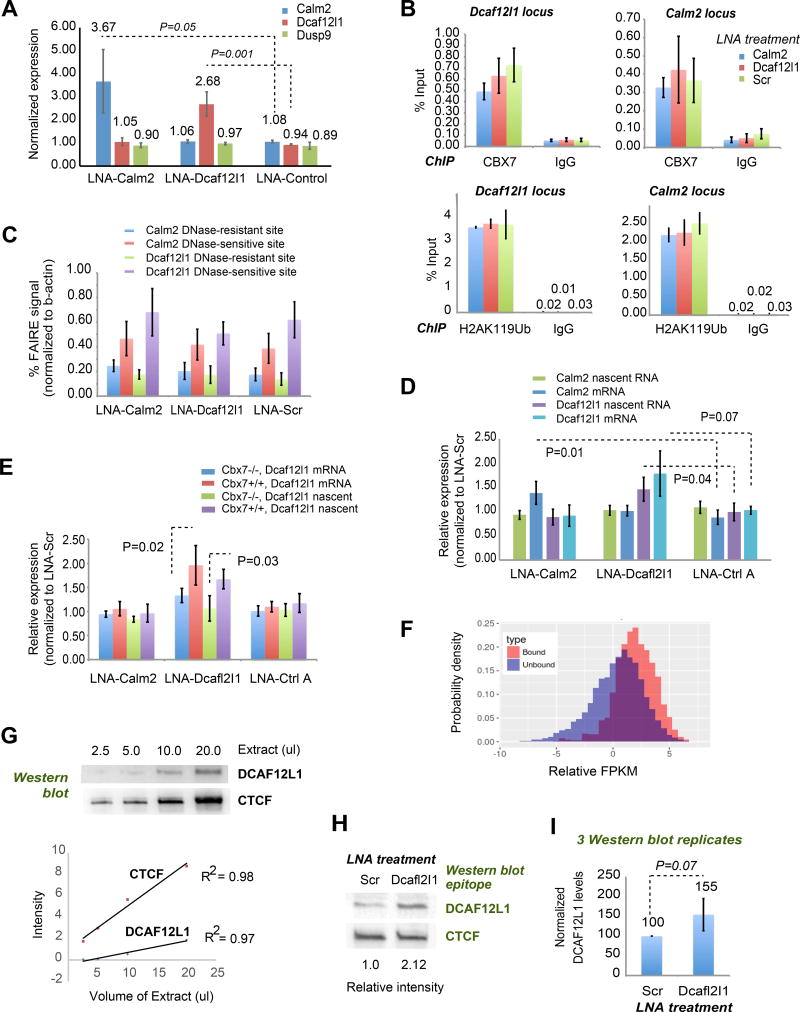
Interaction networks between chromatin complexes and long noncoding RNAs have become a recurrent theme in epigenetic regulation. However, technical limitations have precluded identification of RNA binding motifs for chromatin-associated proteins. Here, we add a denaturation step to UV-crosslink RNA immunoprecipitation (dCLIP) and apply dCLIP to mouse and human chromobox homolog 7 (CBX7), an RNA binding subunit of Polycomb repressive complex 1 (PRC1). In both species, CBX7 predominantly binds 3' UTRs of messenger RNAs. CBX7 binds with a median RNA "footprint" of 171-183 nucleotides, the small size of which facilitates motif identification by bioinformatics. We find four families of consensus RNA motifs in mouse, and independent analysis of human CBX7 dCLIP data identifies similar motifs. Their mutation abolishes CBX7 binding in vitro. Pharmacological intervention with antisense oligonucleotides paradoxically increases CBX7 binding and enhances gene expression. These data support the utility of dCLIP and reveal an unexpected functional interaction between CBX7 and the 3' UTRs of mRNA.

Keywords: 3′ UTR; CBX7; CLIP; ChIP; PRC1; RNA; RNA interactome; bioinformatics; chromatin; epigenetics; polycomb.


Figures

Figure 1
Figure 1. Denaturing CLIP of CBX7 in ES cells. See also Fig. S1–S6, Tables S1–S8
(A) Schematic workflow for dCLIP assay. (B) Representative dCLIP experiment. Left panel, autoradiography of dCLIP experiment. Right panel, Western blot with anti-CBX7 antibody for streptavidin pull-down samples. Lanes which contained input samples have been omitted for clarity. Red arrows, Biotagged-CBX7 signal. 3E and 6F are two clonal cell lines expressing physiological levels of Biotagged-CBX7. 3E and 6F are used as biological replicates for CBX7 dCLIP-seq libraries. (C) Representative CBX7 dCLIP and ChIP profiles for selected genes. DHS, DNAseI-hypersensitive sites from Vierstra et al (Vierstra et al., 2014). Orange boxes, LNA ASO cocktails. Red stars, primer pairs for ChIP-qPCR. Green hexagons, primer pairs for FAIRE-qPCR. (D) Pairwise comparisons of dCLIP enrichment over gene transcripts per three biological replicates (see STAR Methods for details). Note high correlation (R) for each comparison. Spearman’s and Pearson’s R’s shown. (E) Strand-specific enriched peaks (called by "PeakRanger") from three individual CLIP libraries were pooled and overlapped peaks were merged into longer regions in a strand-specific manner. Length distribution frequency of the enriched CLIP peaks, as well as mean, median, and standard deviation were calculated. (F) Comparison of metagene profiles for CBX7 dCLIP-seq peaks and CBX7 ChIP-seq peaks. TSS, transcriptional start site. TTS, transcriptional termination site. (G) Correlation between gene expression levels and CLIP signal. Black, expressed RefSeq genes with reproducible dCLIP signal. Green, genes with a highest CLIP signals. Red, expressed genes with no reproducible CLIP signals.
Figure 2
Figure 2. Identification and characterization of binding motifs for CBX7. See also Tables S5–S7
(A) Bioinformatics pipeline: Schematic workflow of search algorithm for CBX7 biding motifs. (B) Families of binding motifs identified for CBX7 dCLIP. Groups of motifs arranged into families according to similarity. (C) Abundance of motif families across different transcript features. (D) Box plot for FAM-occupancy ratios between number of CBX7 binding sites predicted by motif analysis and confirmed by a dCLIP data to a total number of putative binding sites predicted by motif analysis. Occupancy ratio of 1 indicates that all putative binding sites in a specific gene’s genomic feature were validated as CBX7-binding sites based on CLIP-seq analysis. Black line depicts median. CDs, coding DNA sequences (coding exons).
Figure 3
Figure 3. Spatial arrangement of binding motifs on target transcripts
(A) “Nearest neighbor” analysis for motif families. Note the strong tendency for FAM1 motifs to congregate next to each other. (B) Distance distribution between motif pairs. While certain motif pairs such as FAM3-FAM3 and FAM4-FAM4 occurred in a very close proximity, other motif pairs such as FAM4-FAM2 exhibited much broader spectra of inter-motif distances. (C) Histogram plotting the number of CBX7 footprints (dCLIP fibers) with indicated adjacent FAM motifs in the same footprint. Note a tendency of motifs to congregate. (D) The FAM occupancy ratio on CBX7 footprints with a single FAM (upper graph) versus those with clustered FAMs (lower graph). Congregation of motifs in the 3’UTR regions is positively correlated with higher occupancy ratios, suggesting the possibility of cooperative binding.
Figure 4
Figure 4. Secondary structure probing and relationship of CBX7 motif to known motifs. See also Fig. S7
(A) CBX7 binding motifs bear a significant similarity to the binding motifs of known RNA binding proteins. hPDI motifs were adopted from Xie et al (Xie et al., 2010). RNAcompete motifs were adopted from Ray et al (Ray et al., 2013). (B) Effect of RNA secondary structure probed in vivo and in vitro on CBX7 RNA binding. IcSHAPE profiles centered on the genomic sequences predicted as carrying CBX7 binding motifs. IcSHAPE analysis was adopted from Spitale et al (Spitale et al., 2015). Purified RNA molecules were subjected to treatment with icSHAPE reagent in vitro or isolated from cells exposed to icSHAPE reagent in cell culture (in vivo). Extent of RNA folding in particular region is determined by its accessibility to modification by icSHAPE reagent with higher icSHAPE signal representing more open structure. RealFAM – depicting sequences predicted by motif analysis and confirmed as actual CBX7 binding sites by dCLIP. PredictedFAM – depicting sequences predicted by motif analysis but lacking a dCLIP signal. Note that despite a marked similarity of the curves between binding and non-binding FAM sequences, average icSHAPE signal in actual binding sequences is significantly higher than in non-binding FAM sequences, reflecting more open overall structures.
Figure 5
Figure 5. Validation of CBX7 interactions with transcripts identified by dCLIP
(A) Validation of CBX7 dCLIP data for selected transcripts by nRIP-qPCR. Average fold-enrichment over IgG control is plotted, with standard devations (error bars). U1 small nuclear RNA, negative control. (B) RNA-EMSAs with purified CBX7 (5.6µM) and in vitro transcribed RNAs demonstrate direct RNA-protein interactions. Concentrations of RNA: 26.5nM for Dcaf12l1, 62nM for Dusp9, 37.9nM for Calm2. Green arrows, unbound RNA probes. Red asterisks, bound and shifted RNA-protein complexes. Blue arrows, LNA-shifted probes. Red arrowheads, supershifted complexes after gene-specific LNA addition. (C) Representative EMSA showing titration of CBX7 protein against fixed concentration (40 nM) of the 3’UTR fragment of Dcaf12l1. Red arrows, unbound probe. Black arrows, shifted CBX7-RNA complexes of different mobilities. (D) Competition assay: Shift of 40 nM Dcaf12l1 3’UTR probe by 2.8 uM of CBX7 is competed away by excess cold Dcaf12l1. Red arrows, unbound probe. Black arrows, shifted CBX7-RNA complexes of different mobilities. (E) Binding curves for CBX7-3’UTR interactions for selected transcripts. Kd’s and Hill coefficients determined by fitting datapoints to sigmoidal plots by non-linear regression (STAR Methods). (F) RNA-EMSAs with purified CBX7 (5.6 µM) and 100 nM of in vitro-transcribed wildtype oligos bearing a single FAM motif versus their mutated versions. Green arrows, unbound RNA probes. Red arrows, bound and shifted RNA-protein complexes. (G) FAM3 competition EMSA using 2.8 uM CBX7 and 100 nM labelled Nuck1-FAM3 RNA probe. Increasing concentrations of Nucks1-FAM3 cold competitor were added, as indicated. Green arrows, unbound RNA probes. Red arrows, bound and shifted RNA-protein complexes.
Figure 6
Figure 6. Modulation of CBX7-3’UTR interactions results in gene upregulation. See also Fig. S8
(A) LNA administration resulted in gene upregulation, as shown by RT-qPCR. LNA cocktails are used for each transcript (see Fig. 1C and Fig. S5 for map). Expression values are fold-changes in expression compared to cells treated with scrambled LNA. P values determined by t-test from 3 biological replicates. (B) ChIP-qPCR for CBX7 localization and H2AK119Ub levels after LNA administration as indicated. IgG for control ChIP pulldown. Data presented is average +/− S.D of at least three biological replicates. (C) FAIRE-qPCR analysis of chromatin compaction in the promoter regions (DNAse-sensitive regions) versus regions corresponding to CBX7 ChIP peaks (DNAse-resistant regions) following LNA treatment. Values were normalized to the β-actin locus (constant). Average +/− S.D of at least three biological replicates shown. (D) RT-qPCR to determine effect of LNA administration on nascent transcripts (intronic primer pairs) compared to total mRNA (inter-exonic primer pairs) levels. Expression levels are relative to those of cells treated with scrambled LNA. Average +/− S.D of at least three biological replicates shown. P values determined by t-test from 3 biological replicates. (E) Dcaf12l1 upregulation after LNA treatment depends on CBX7. Relative Dcaf12l1 expression in Cbx7−/− versus wildtype ES cells. RT-pPCR of nascent (intronic primer pairs) versus processed mRNA (inter-exonic primer pairs) is shown. Average +/− S.D of at least three biological replicates shown. P values determined by t-test from 3 biological replicates. (F). Probability density functions for CBX7-bound versus unbound transcripts. Relative FPKM values are determined from RNA-seq of the ES cells in which dCLIP was performed. Note that bound transcripts have a tendency towards higher expression. (G) Western immunoblot for DCAF12L1 and loading control CTCF protein. Western analysis is quantitative and showed linear response between 2.5–20.0 ul of extract for both proteins. Standard curve for the Western analysis displayed Squared correlation coefficients (R2) of approximately 1.0, suggesting an excellent fit of the curve to observed values. (H) One example of quantitative Western blot analysis for expression of DCAF12L1 protein following treatment with LNA oligomers. Densitometric analysis was performed and values are normalized to control-LNA-treated samples. Western immunoblots appearing in panels G and H, which were part of images generated by Chemidoc MP Imaging System (as described under STAR Methods) were cropped from their original context and recomposed into separate panels for presentation purposes. (I) Average +/− SD of three biological replicates of quantitative Western blot analysis for DCAF12L1 protein. Values are fold-changes in protein signal compared to cells treated with scrambled LNA. P values determined by t-test from 3 biological replicates.
Figure 7
Figure 7. Identification and characterization of binding motifs for human CBX7 by dCLIP. See also Fig. S9, Table S8, S9
(A) Length distribution frequency of the enriched hCBX7 dCLIP peaks, as well as mean, median, and standard deviation. (B) Metagene profiles for hCBX7 dCLIP-seq peaks shows enrichment at the 3’ end of mRNAs. TSS, transcriptional start site. TTS, transcriptional termination site. (C) Representative hCBX7 dCLIP profile. BMI1 analysis was performed on previous GRIP dataset (Ray et al., 2016). (D) Similarity analysis for families of binding motifs identified for hCBX7 and mCBX7 dCLIP. Groups of motifs arranged according to similarity. Note partial clustering of human and mouse motifs. (E) Validation of CBX7 dCLIP data for selected transcripts by dCLIP-qPCR. Average fold-enrichment over GFP control is plotted, with standard deviations (error bars). PES1 served as a negative control that did not exhibit significant binding to CBX7. P values were determined by t-test from 3 biological replicates. (F) hCBX7 motifs bear significant similarity to motifs of known RNA binding proteins. hPDI motifs were adopted from Xie et. al. (Xie et al., 2010). RNAcompete motifs were adopted from Ray et al (Ray et al., 2013).

Comment in

Similar articles

Cited by

References

    1. Aranda S, Mas G, Di Croce L. Regulation of gene transcription by Polycomb proteins. Sci Adv. 2015;1:e1500737. - PMC - PubMed
    1. Badis G, Berger MF, Philippakis AA, Talukder S, Gehrke AR, Jaeger SA, Chan ET, Metzler G, Vedenko A, Chen X, et al. Diversity and complexity in DNA recognition by transcription factors. Science. 2009;324:1720–1723. - PMC - PubMed
    1. Bag J, Bhattacharjee RB. Multiple levels of post-transcriptional control of expression of the poly (A)-binding protein. RNA Biol. 2010;7:5–12. - PubMed
    1. Bailey TL, Boden M, Buske FA, Frith M, Grant CE, Clementi L, Ren J, Li WW, Noble WS. MEME SUITE: tools for motif discovery and searching. Nucleic acids research. 2009;37:W202–208. - PMC - PubMed
    1. Beltran M, Yates CM, Skalska L, Dawson M, Reis FP, Viiri K, Fisher CL, Sibley CR, Foster BM, Bartke T, et al. The interaction of PRC2 with RNA or chromatin is mutually antagonistic. Genome Res. 2016;26:896–907. - PMC - PubMed

Publication types