. 2017 Jan-Dec:16:1536012117734485.
doi: 10.1177/1536012117734485.

Whole-Body Biodistribution, Dosimetry, and Metabolite Correction of [11C]Palmitate: A PET Tracer for Imaging of Fatty Acid Metabolism

Affiliations

Whole-Body Biodistribution, Dosimetry, and Metabolite Correction of [11C]Palmitate: A PET Tracer for Imaging of Fatty Acid Metabolism

Nana L Christensen et al. Mol Imaging. 2017 Jan-Dec.

Abstract

Introduction: Despite the decades long use of [11C]palmitate positron emission tomography (PET)/computed tomography in basic metabolism studies, only personal communications regarding dosimetry and biodistribution data have been published.

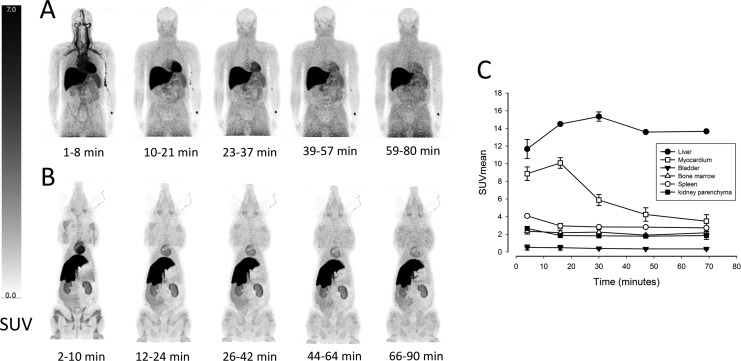
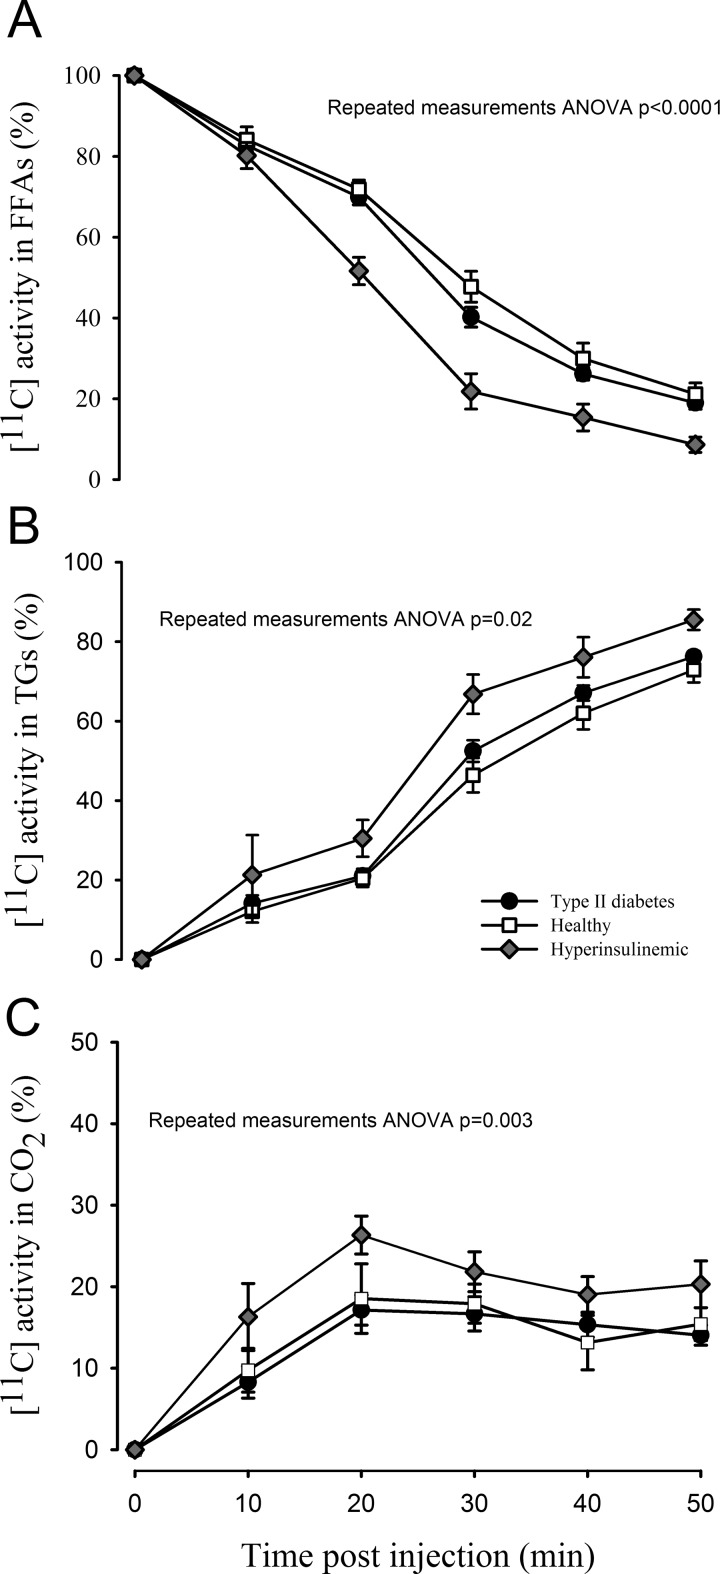
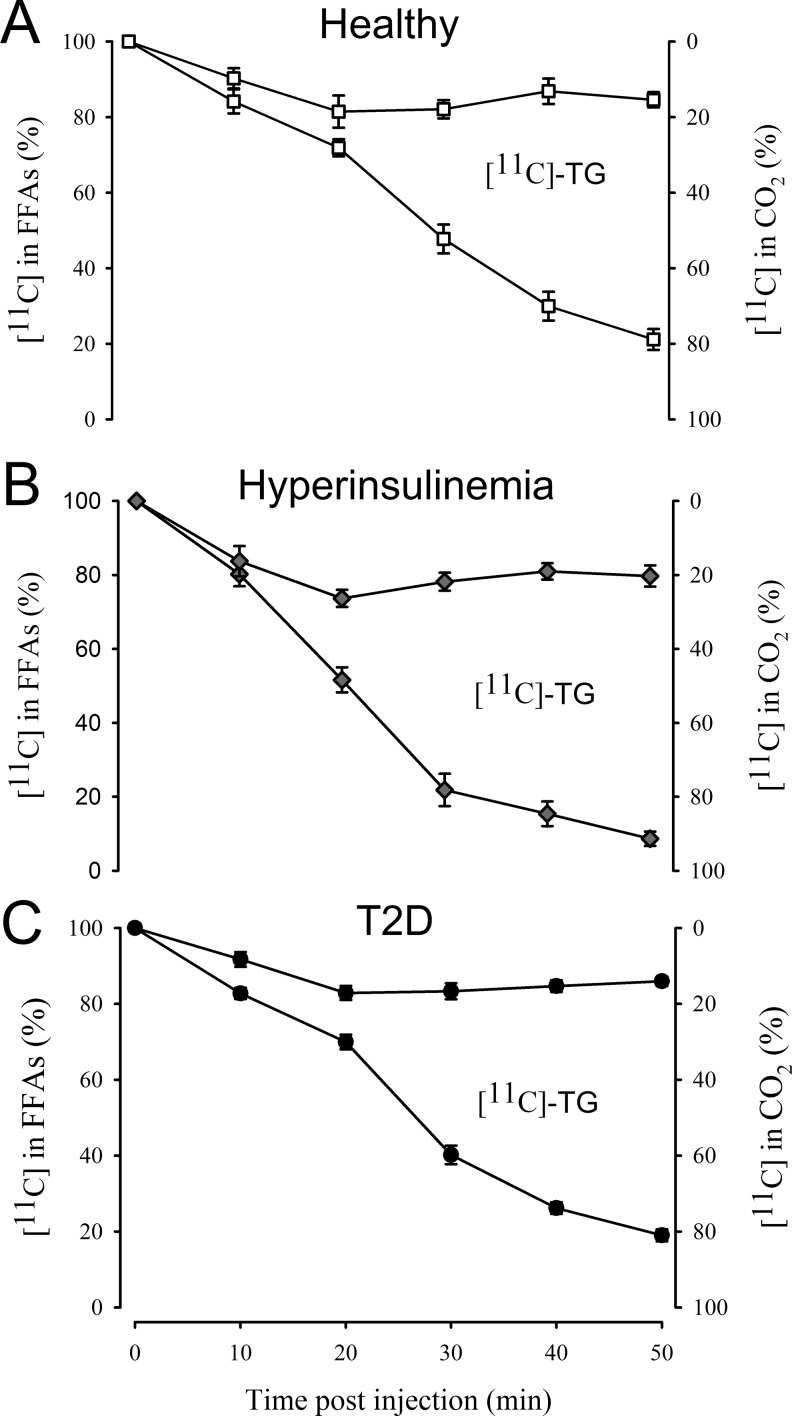
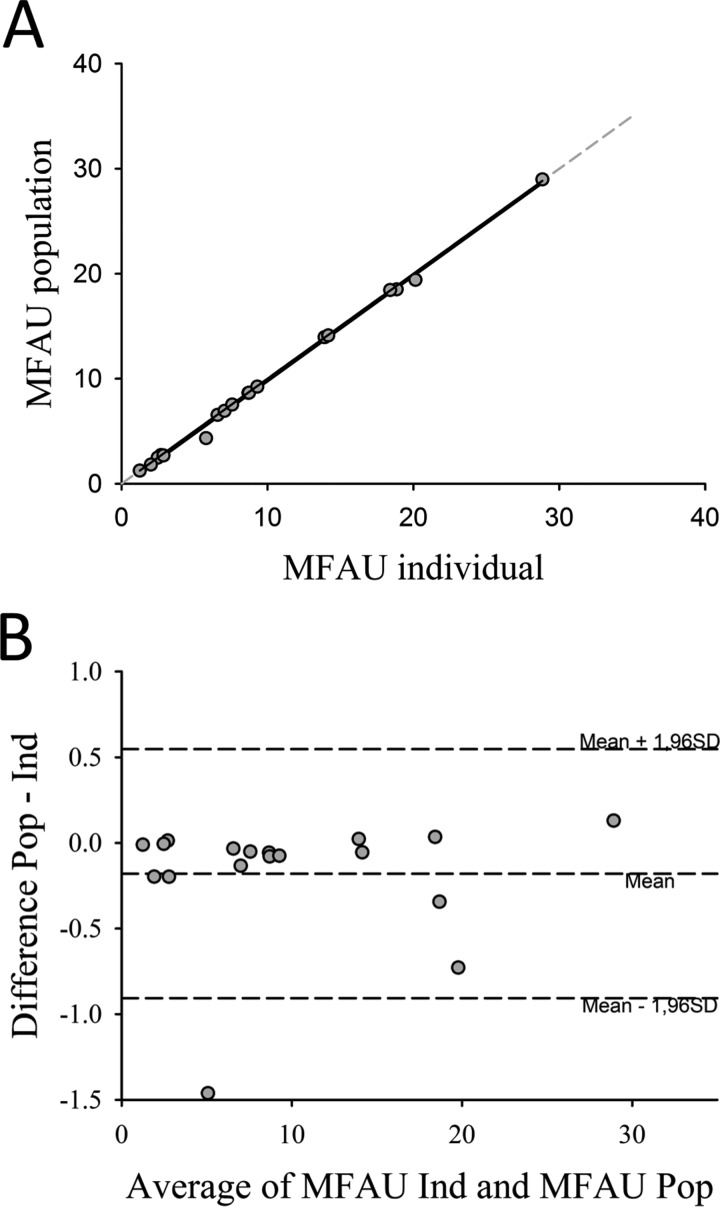
Methods: Dosimetry and biodistribution studies were performed in 2 pigs and 2 healthy volunteers by whole-body [11C]palmitate PET scans. Metabolite studies were performed in 40 participants (healthy and with type 2 diabetes) under basal and hyperinsulinemic conditions. Metabolites were estimated using 2 approaches and subsequently compared: Indirect [11C]CO2 release and parent [11C]palmitate measured by a solid-phase extraction (SPE) method. Finally, myocardial fatty acid uptake was calculated in a patient cohort using input functions derived from individual metabolite correction compared with population-based metabolite correction.

Results: In humans, mean effective dose was 3.23 (0.02) µSv/MBq, with the liver and myocardium receiving the highest absorbed doses. Metabolite correction using only [11C]CO2 estimates underestimated the fraction of metabolites in studies lasting more than 20 minutes. Population-based metabolite correction showed excellent correlation with individual metabolite correction in the cardiac PET validation cohort.

Conclusion: First, mean effective dose of [11C]palmitate is 3.23 (0.02) µSv/MBq in humans allowing multiple scans using ∼300 MBq [11C]palmitate, and secondly, population-based metabolite correction compares well with individual correction.

Keywords: PET/CT; advances in PET/SPECT probes; cardiac imaging; metabolism; quantitation in molecular imaging.


Conflict of interest statement

Declaration of Conflicting Interests: The author(s) declared no potential conflicts of interest with respect to the research, authorship, and/or publication of this article.

Figures

Figure 1.
Figure 1.
Maximum intensity projections of the biodistribution of [11C]palmitate in 5 successive PET scans in (A) a healthy 54-year old male volunteer and (B) a healthy 4-month-old female pig. Images demonstrate tracer uptake in the liver, heart, kidneys, spleen, bone marrow, and muscles. C, Mean Standardized Uptake Values (SUV) values in organs of interest in the human study. N = 2, mean ± SEM. PET indicates positron emission tomography; SEM, standard error of the mean.
Figure 2.
Figure 2.
Metabolite correction of palmitate at 5 different time points during a 50-minute dynamic PET scan. A, The amount of radioactivity present as FFAs measured with the SPE method. A repeated measures ANOVA showed significantly lower activity in the FFA fraction in hyperinsulinemic patients (mixed model repeated measures ANOVA [group] P <.0001, [group vs time interaction] P < .0001). There was no difference in time-activity curves between healthy controls and patients with T2D (mixed model repeated measures ANOVA [group] P = .14, [group vs time interaction] P = .39). B, [11C] activity in complex lipids (mainly TGs) measured by the SPE method. Significantly more activity was present in this fraction during hyperinsulinemia (ANOVA [group] P = .02), whereas no difference was detected between controls and T2D (ANOVA [group] P = .17). C, Radioactivity detected in the CO2 fraction, with significantly more in patients during hyperinsulinemia (ANOVA [group] P = .003) and no difference between T2D and controls (ANOVA [group] P = .72). Error bars represent ± standard errors. ANOVA indicates analysis of variance; FFAs, free fatty acids; PET, positron emission tomography; SPE, solid-phase extraction; T2D, type 2 diabetes; TG, triglyceride.
Figure 3.
Figure 3.
Combined plots showing the individual contributions of the various metabolite fractions to total [11C] activity in healthy controls (A), patients during hyperinsulinemia (B), and patients with T2D (C). The difference between activity in [11C]CO2 and [11C]palmitate is the area between the 2 curves and represents activity in other fractions (mostly TG). Error bars represent ± standard errors. T2D indicates type 2 diabetes; TG, triglyceride.
Figure 4.
Figure 4.
Results from the cardiac image analysis in 9 healthy controls (from study 3), in which 2 PET scans were performed 3 months apart. A, Correlation between individual (ind) and population-based (pop) (results obtained from study 2) metabolite correction methods for measuring MFAU (n = 18). Pearson correlation coefficient r = .999, P < .001. Regression line equation: y = −0.200 + 1.002x. B, Bland-Altman plot. The middle dashed line represents the average difference between the 2 methods; the upper and lower dashed lines represent limits of agreement (mean [1.96 SD]). MFAU indicates myocardial fatty acid uptake; PET, positron emission tomography; SD, standard deviation.

References

    1. Tamaki N, Fujibayashi Y, Magata Y, Yonekura Y, Konishi J. Radionuclide assessment of myocardial fatty acid metabolism by PET and SPECT. J Nucl Cardiol. 1995;2(3):256–266. - PubMed
    1. Karmi A, Iozzo P, Viljanen A, et al. Increased brain fatty acid uptake in metabolic syndrome. Diabetes. 2010;59(9):2171–2177. doi:10.2337/db09-0138. - PMC - PubMed
    1. Guiducci L, Jarvisalo M, Kiss J, et al. [11C]palmitate kinetics across the splanchnic bed in arterial, portal and hepatic venous plasma during fasting and euglycemic hyperinsulinemia. Nucl Med Biol. 2006;33(4):521–528. Research Support, Non-U.S. Gov’t 2006/05/25. doi:10.1016/j.nucmedbio.2006.02.003. - PubMed
    1. Kisrieva-Ware Z, Coggan AR, Sharp TL, Dence CS, Gropler RJ, Herrero P. Assessment of myocardial triglyceride oxidation with PET and 11C-palmitate. J Nucl Cardiol. 2009;16(3):411–421. doi:10.1007/s12350-009-9051-7. - PMC - PubMed
    1. Dence CS, Herrero P, Schwarz SW, Mach RH, Gropler RJ, Welch MJ. Imaging myocardium enzymatic pathways with carbon-11 radiotracers. Methods Enzymol. 2004;385:286–315. doi:10.1016/S0076-6879(04)85016-X. - PubMed

Publication types

LinkOut - more resources