. 2017 Oct 26;15(1):217.
doi: 10.1186/s12967-017-1320-7.

Detecting the tipping points in a three-state model of complex diseases by temporal differential networks

Affiliations

Detecting the tipping points in a three-state model of complex diseases by temporal differential networks

Pei Chen et al. J Transl Med. .

Abstract

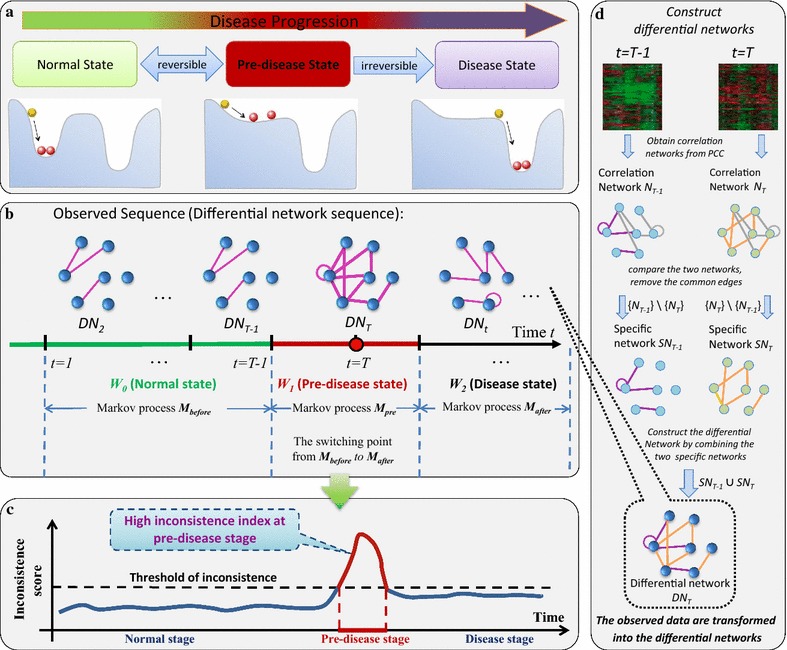
Background: The progression of complex diseases, such as diabetes and cancer, is generally a nonlinear process with three stages, i.e., normal state, pre-disease state, and disease state, where the pre-disease state is a critical state or tipping point immediately preceding the disease state. Traditional biomarkers aim to identify a disease state by exploiting the information of differential expressions for the observed molecules, but may fail to detect a pre-disease state because there are generally little significant differences between the normal and pre-disease states. Thus, it is challenging to signal the pre-disease state, which actually implies the disease prediction.

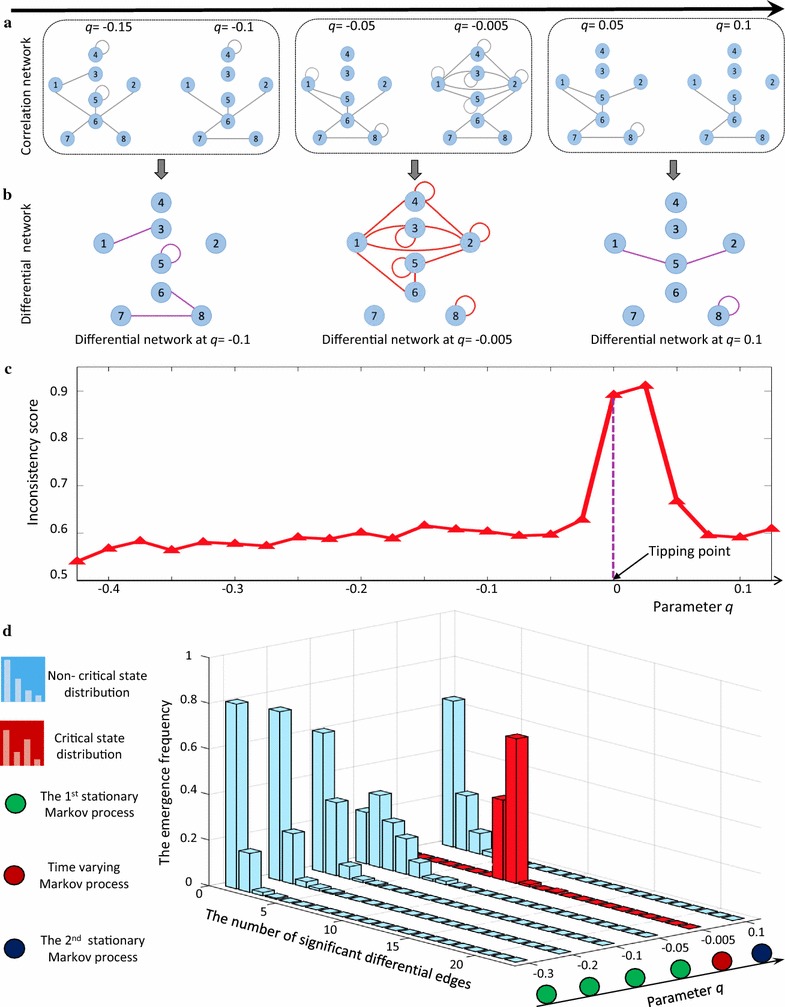
Methods: In this work, by exploiting the information of differential associations among the observed molecules between the normal and pre-disease states, we propose a temporal differential network based computational method to accurately signal the pre-disease state or predict the occurrence of severe disease. The theoretical foundation of this work is the quantification of the critical state using dynamical network biomarkers.

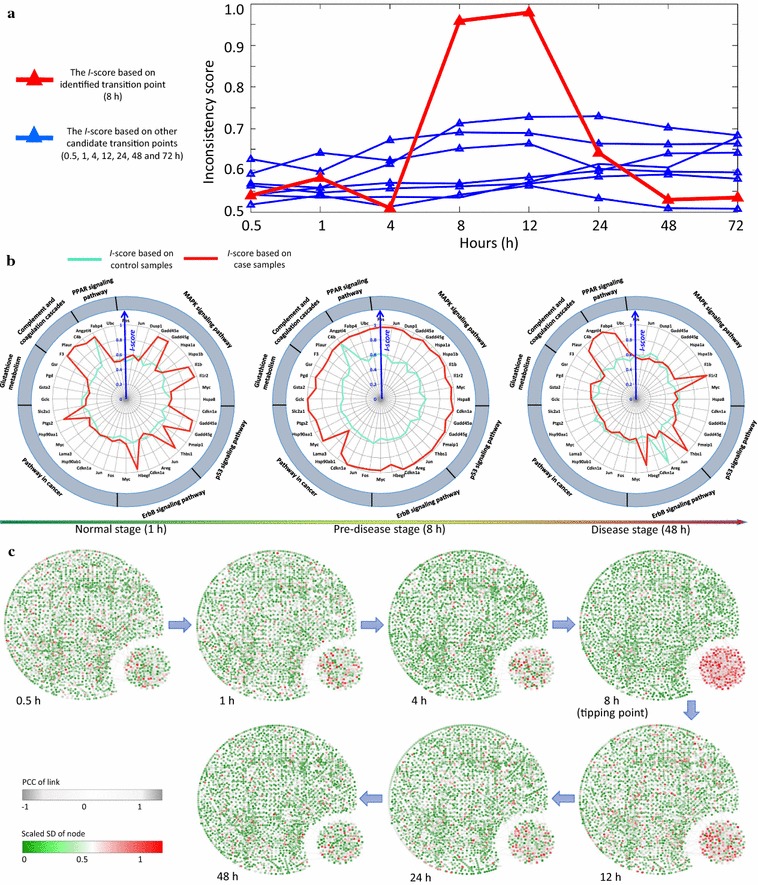
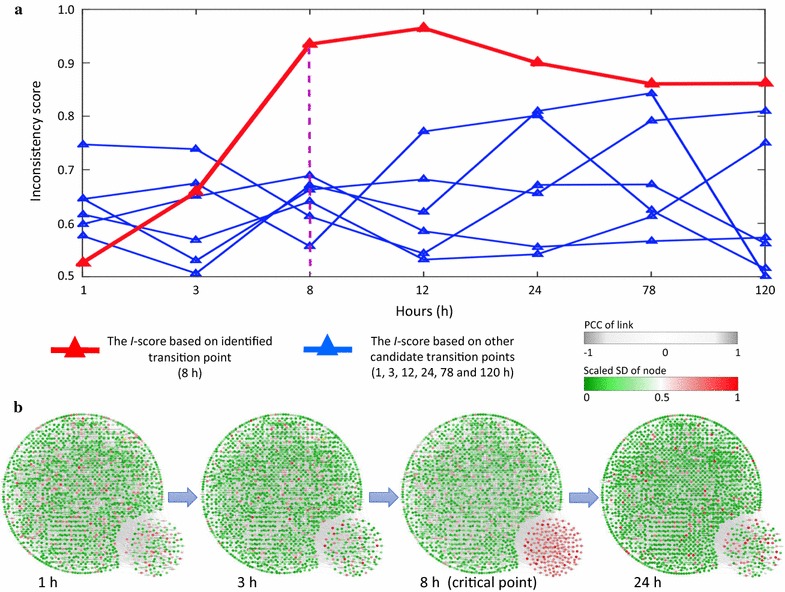
Results: Considering that there is one stationary Markov process before reaching the tipping point, a novel index, inconsistency score (I-score), is proposed to quantitatively measure the change of the stationary processes from the normal state so as to detect the onset of pre-disease state. In other words, a drastic increase of I-score implies the high inconsistency with the preceding stable state and thus signals the upcoming critical transition. This approach is applied to the simulated and real datasets of three diseases, which demonstrates the effectiveness of our method for predicting the deterioration into disease states. Both functional analysis and pathway enrichment also validate the computational results from the perspectives of both molecules and networks.

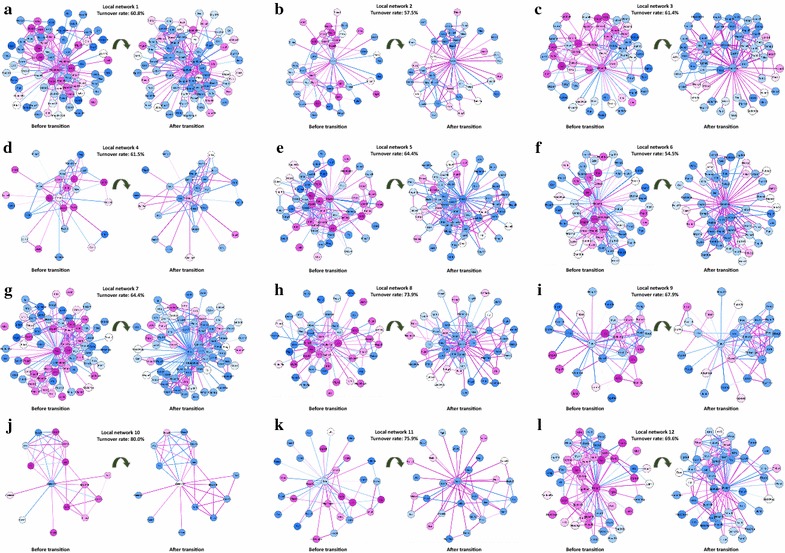
Conclusions: At the molecular network level, this method provides a computational way of unravelling the underlying mechanism of the dynamical progression when a biological system is near the tipping point, and thus detecting the early-warning signal of the imminent critical transition, which may help to achieve timely intervention. Moreover, the rewiring of differential networks effectively extracts discriminatively interpretable features, and systematically demonstrates the dynamical change of a biological system.

Keywords: Critical transition; Differential network; Dynamical network biomarker; Hidden Markov model; Pre-disease state; Tipping point.


Figures

Fig. 1
Fig. 1
Outline for identifying the pre-disease state by using the differential-network-based HMM. a Disease progression can be divided into three states, i.e., the normal state with high resilience, the pre-disease state with low resilience, and the disease state with possible high resilience. b First, we constructed the differential network sequence O T − 1 = {DN 2DN 3, …, DN T − 1} based on the observed molecular data. Then, we trained the HMM ΘT-1=(AT-1,BT-1,πT-1) representing the normal state, which, in view of stable dynamics, was modelled as the stationary Markov process M before, while on the other hand, the pre-disease state was defined as a Markov process M pre. Thus, based on the dynamical difference of the two Markov processes, detecting the pre-disease state during the disease progression is equivalent to identifying the switching point between these two distinct Markov processes. Second, for each candidate time point, we calculated the probability P of being the switching point based on the HMM ΘT-1(OT-1). c The abrupt increase of P indicated that a candidate point t = T was the switching point of ΘT-1(OT-1) with high probability. d The differential network was obtained based on three steps at each time point or period. We first constructed the correlation network at each time point. Comparing the correlation networks from adjacent time points, this generated a specific network, which included the specific edges for each time point. Then it followed the differential network by combining the specific networks from adjacent time points
Fig. 2
Fig. 2
The validation of I-score through a numerical experiment. To validate our method, the I-score scheme was performed on a simulated dataset from an eight-node network, whose detailed description is in Additional file 1: B. a The specific eight-node correlation networks respectively constructed along the sequence of parameter q. Among the 6 consequent networks, the first three (q = − 0.15, q = − 0.1 and q = 0.1) are in the normal state and no significant difference among them; the fourth (q = − 0.005) represents the transition state; and the last two (q = 0.05 and q = 0.1) locate in the disease state. b The construction of 3 differential networks based on adjacent specific networks. In each differential network, the edge connecting two nodes records temporal differential correlation, and the edge connecting only one node records temporal differential variance. c The I-scores of the network system. A boost of I-score signals the tipping point at q = 0, which agrees with the fact that the system undergoes a bifurcation at q = 0. d The distribution of the occurrence frequency of differential edges in the differential network. When parameter q is far from the critical value q = 0 (q = − 0.15, q = − 0.1), there are few differential edges (in statistical sense). However, when q approaches the bifurcation value q = 0 (q = − 0.005), the distribution changes considerably, i.e., the ratio of 13-differential-edges increases significantly
Fig. 3
Fig. 3
Application of I-score on the microarray data of acute lung. a I-score curves based on the differential networks respectively constructed at each candidate critical time point. The red curve represents the I-score calculated from the testing differential network obtained at 8 h, and the seven blue curves are those derived from other candidate time points. The most significant signal appears at 8-hour point, which agrees with the experimental observation. b Radar plots present the dynamical change in I-scores of some local differential networks, which are labelled by their centre genes that enriched in pathways indicated outside. The red curve represents the I-score from case samples while the green curve is from the control data. At the pre-disease stage, the inconsistence is significant. c The dynamical evolution of the whole molecular network is shown respectively at 0.5, 1, 4, 8, 12, 24, and 48 h. The networks were constructed through a mapped whole mouse network. Node colour represents the fluctuation of expression, and the thickness of links represents the correlation between each pair of nodes. In the lower right corner of each network, there is a group of 189 genes with top 10% most significant I-scores’ change, which together show wild fluctuation in their expressions around 8 h
Fig. 4
Fig. 4
Demonstration of 12 pairs of significant local differential networks. To demonstrate the effectiveness of the I-score scheme, 12 pairs of the most significant differential local networks are presented, i.e., local networks with dynamically significant change in I-scores around the identified critical time point (8 h). For each pair, the left network is the differential network in the normal state (4 h), while the right one is in the disease state (12 h). In terms of these networks, 55–80% nodes had turnover (from low expression to high expression with significance value P < 0.05, or vice versa) and 33–60% edges had turnover (from negative correlation value to positive, or vice versa) when the system progressed from the normal state to the disease state. The ratios of the turnover neighbours and edges overwhelm those of the background 28.6% (turnover neighbours) and 18.1% (turnover edges), i.e., the ratio of the turnover nodes/edges in the whole STRING molecular network. Among these significant local networks, some well-known genes that were involved in apoptosis or related to the inflammatory response were included: JUN (local network 8), NOTCH2 (local network 12), MYC (local network 1), IL1B (local network 7), and PTGS2 (local network 5). To analyse and illustrate the dynamical difference before and after the critical transition, graph-related information is shown in Table 1
Fig. 5
Fig. 5
Application of I-score on the dataset of acute corneal trauma. a The I-score based on microarray of acute corneal trauma from each candidate transition time point. The red curve represents the I-score calculated from the testing differential network obtained 8 h after acute corneal trauma, while the six blue curves are those from other time points. The abrupt increase of I-score appeared around the 1–8 h period, which is in coincidence with the experimental observation, i.e., the heat shock genes were upregulated beginning at 8 h, indicating the start of a stress response. b A group of 171 genes with top 10% most significant I-scores’ change are located in the lower-right corner in each network. These selected genes showed wild fluctuation in their expressions around the 8 h time point. Thus, the critical transition point was around 8 h, where the network structure exhibits the most significant change, just before the critical transition triggered by acute corneal trauma

References

    1. Liu R, Wang X, Aihara K, Chen L. Early diagnosis of complex diseases by molecular biomarkers, network biomarkers, and dynamical network biomarkers. Med Res Rev. 2014;34(3):455–478. doi: 10.1002/med.21293. - DOI - PubMed
    1. Scheffer M, Bascompte J, Brock WA, Brovkin V, Carpenter SR, Dakos V, et al. Early-warning signals for critical transitions. Nature. 2009;461(7260):53–59. doi: 10.1038/nature08227. - DOI - PubMed
    1. He D, Liu ZP, Honda M, Kaneko S, Chen L. Coexpression network analysis in chronic hepatitis B and C hepatic lesions reveals distinct patterns of disease progression to hepatocellular carcinoma. J Mol Cell Biol. 2012;4(3):140–152. doi: 10.1093/jmcb/mjs011. - DOI - PubMed
    1. Tan Z, Liu R, Zheng L, Hao S, Fu C, Li Z, et al. Cerebrospinal fluid protein dynamic driver network: at the crossroads of brain tumorigenesis. Methods. 2015;83:36–43. doi: 10.1016/j.ymeth.2015.05.004. - DOI - PubMed
    1. Achiron A, Grotto I, Balicer R, Magalashvili D, Feldman A, Gurevich M. Microarray analysis identifies altered regulation of nuclear receptor family members in the pre-disease state of multiple sclerosis. Neurobiol Dis. 2010;38(2):201–209. doi: 10.1016/j.nbd.2009.12.029. - DOI - PubMed

Publication types