. 2018 Jan 18;131(3):342-352.
doi: 10.1182/blood-2017-02-768580. Epub 2017 Oct 26.

Ferritin is secreted via 2 distinct nonclassical vesicular pathways

Affiliations

Ferritin is secreted via 2 distinct nonclassical vesicular pathways

Marianna Truman-Rosentsvit et al. Blood. .

Abstract

Ferritin turnover plays a major role in tissue iron homeostasis, and ferritin malfunction is associated with impaired iron homeostasis and neurodegenerative diseases. In most eukaryotes, ferritin is considered an intracellular protein that stores iron in a nontoxic and bioavailable form. In insects, ferritin is a classically secreted protein and plays a major role in systemic iron distribution. Mammalian ferritin lacks the signal peptide for classical endoplasmic reticulum-Golgi secretion but is found in serum and is secreted via a nonclassical lysosomal secretion pathway. This study applied bioinformatics and biochemical tools, alongside a protein trafficking mouse models, to characterize the mechanisms of ferritin secretion. Ferritin trafficking via the classical secretion pathway was ruled out, and a 2:1 distribution of intracellular ferritin between membrane-bound compartments and the cytosol was observed, suggesting a role for ferritin in the vesicular compartments of the cell. Focusing on nonclassical secretion, we analyzed mouse models of impaired endolysosomal trafficking and found that ferritin secretion was decreased by a BLOC-1 mutation but increased by BLOC-2, BLOC-3, and Rab27A mutations of the cellular trafficking machinery, suggesting multiple export routes. A 13-amino-acid motif unique to ferritins that lack the secretion signal peptide was identified on the BC-loop of both subunits and plays a role in the regulation of ferritin secretion. Finally, we provide evidence that secretion of iron-rich ferritin was mediated via the multivesicular body-exosome pathway. These results enhance our understanding of the mechanism of ferritin secretion, which is an important piece in the puzzle of tissue iron homeostasis.


Conflict of interest statement

Conflict-of-interest disclosure: The authors declare no competing financial interests.

Figures

None
Graphical abstract
Figure 1.
Figure 1.
Ferritin colocalizes with the late endolysosomal marker cathepsin D, but not with Golgi or early endosomal markers. (A-C) Representative confocal images of ferritin (red) and subcellular compartments (green) in the Golgi apparatus (A), stained for GM-130; early endosomes (B), stained for EEA1, and late endolysosomes (C), stained for cathepsin D (CatD), in murine BMDMs grown in the presence of 100 µg/mL FAC for 24 hours. Scale bars represent 10 µm. (D) Enlargement of ferritin-CatD co-staining, with red arrows indicating ferritin, green arrows indicating late endolysosomes, and yellow arrows indicating colocalization. Negative controls were treated with secondary antibodies only and with 1 primary antibody followed by both secondary antibodies (not depicted). Sample visualization was performed with a LSM 700 (Zeiss) laser scanning inverted confocal microscope equipped with a Plan-Apochromat ×63/1.4 numerical aperture oil differential interference contrast objective.
Figure 2.
Figure 2.
Iron-loaded ferritin is located in membrane-bound vesicles, specifically in lysosome-enriched fractions. (A) Control and iron-treated (100 μg/mL FAC for 24 hours) BMDMs were fractionated using a differential subcellular fractionation method. Total cell lysates and cytosol and membrane-bound vesicle–enriched subfractions (membranes) were separated on SDS-PAGE (40 µg protein/lane) and analyzed by western blot, with anti-l-ferritin, LAMP1 (lysosomal marker), and antitubulin (cytosolic marker) antibodies. The results of 1 out of 3 representative experiments are shown. (B) Intensity of L- and S-ferritin bands of control (Ctrl) samples were quantified using Adobe Photoshop software. Mean band intensities were normalized to whole-cell protein by volume ratios. The results of 1 out of 3 representative experiments are shown. (C) Control and iron-treated (100 μg/mL FAC for 24 hours) RAW264.7 macrophages were fractionated using a lysosomal enrichment method. Total cell lysates and lysosomal fractions were separated on SDS-PAGE and analyzed by western blot with anti-l-ferritin and anti-LAMP1 antibodies. (D) Intensity of L- and S-ferritin bands on immunoblot was quantified; each bar represents mean ± standard deviation (SD); n = 4 (*P < .05, **P < .01 compared with control samples). (E) A drop of each fraction was mounted on a carbon-coated copper grid at room temperature. Iron cores (arrows) were determined using a JEOL (JEM-2100) electron microscope operated at 200 KeV. Scale bar represents 100 nm.
Figure 3.
Figure 3.
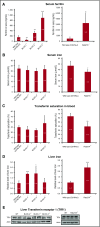
Serum ferritin levels are affected in mice with trafficking defects of the endolysosomal pathways. (A) Serum ferritin levels were estimated by enzyme-linked immunosorbent assay. (B) Serum iron and all other blood tests were performed by trained staff in a veterinary laboratory. (C) Transferrin saturation percentage was calculated by dividing serum iron by total iron-binding capacity and multiplying by 100. (D) Liver iron was evaluated using a colorimetric ferrozine-based assay. (E) Transferrin receptor 1 (TfR1) western blot. Liver lysates were separated by SDS-PAGE (35 µg protein/lane) and subjected to western blotting with anti-TfR1 and antiactin antibodies. Representative results in livers from 2 out of 4 mice are shown. Measurements of BLOC-1−/−, BLOC-2−/−, and BLOC-3−/− mice were compared with those of WT C57BL/6J mice. Rab27A−/− mice were on a C3H background and were compared with their WT counterparts. Each bar represents mean ± SD (*P < .05, **P < .01, ***P < .001). Statistical significance was evaluated by an unpaired t test using GraphPad software.
Figure 4.
Figure 4.
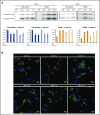
Ferritin is not secreted through the classical ER–Golgi secretion pathway. (A) Murine BMDMs were metabolically labeled with 35S in the presence of 100 μg/mL FAC and in presence or absence of 5 μg/mL BFA. Cells and media were collected at 0, 2, and 4 hours. Ferritin was immunoprecipitated from lysates and media with an anti-L-ferritin antibody and separated on SDS-PAGE. All samples were precleared (PC) by incubation with protein A sepharose beads alone to clear samples from nonspecific binding to the beads. L- and H-ferritin subunit band intensity was quantified using Adobe Photoshop software (each bar represents mean ± SD; n = 2). (B) Representative confocal images of ferritin (green) and the Golgi marker GM-130 (red) in murine macrophages (top, control, nontreated macrophages; bottom, BFA-treated macrophages). Negative controls were done with secondary antibodies only (insert, top panel) and with 1 primary antibody followed by both secondary antibodies to exclude channel leakage (not depicted). Scale bars represent 10 μm. Image visualization was performed on a LSM 700 (Zeiss) laser scanning inverted confocal microscope with a Plan-Apochromat ×63/1.4 numerical aperture oil differential interference contrast objective.
Figure 5.
Figure 5.
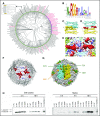
Identification of a motif enriched in ferritins that do not have a classical secretion signal. (A) A taxonomy-based phylogenetic tree of ferritins containing or lacking the classical ER SP targeting sequence. The organisms marked red are SP positive, and the organisms marked black are SP negative. The pink area is a dominantly SP-positive cluster, and the green area is a dominantly SP-negative cluster. Mus musculus and Homo sapiens locations are marked in yellow and shown in the enlargement. (B) A 13-amino-acid motif detected by the MEME and FIMO tools. The motif includes residues 74 to 86 of the H subunit and residues 70 to 82 of the L subunit. (C) The motif is situated along an unstructured loop of the ferritin subunits and sits at the interface between 2 subunits (colored in cyan and gold), creating a continuous long zipper-like structure (ie, a motif dimer) with its neighbor motif. (D) R79, F81, and Q83 of the motif received high ODA scores for protein–protein interaction (high score is labeled in red and low score in blue). (E) Visualization of protein–protein interaction patch, calculated by ODA score. (F) Visualization of protein–protein interaction patches calculated by ODA score shown in the context of the whole ferritin multimer. Our motif, R22, and an additional unidentified group of residues are marked in red. (G) Motif distribution and location throughout the entire ferritin 24-mer. The motif forms a long dimer (colored in green) at the interface of 2 subunits. R79 is marked in red, and R22 is marked in orange. (H) Human ferritin H- and L-subunit–knockout HeLa cells were transfected with plasmids coding for either WT murine H-ferritin (FTHWT) or FTHR79A, FTHF81A, or FTHQ83A. Nontransfected HeLa cells (NT) were analyzed as a negative control. WT RAW264.7 (nontransfected) cells were analyzed as a positive control for both L- and H-ferritin subunits (lane 12 in “cell lysates” gel and lane 17 in “media” gel). 24 hours after transfection, cells were metabolically labeled with 35S (2-hour pulse) and chased for 0, 4, and 18 hours. Cell lysates were collected after 4 and 18 hours (lanes 2-6 and 7-11 in cell lysates gel, respectively), whereas media samples were collected after 0, 4, and 18 hours (lanes 2-6, 7-11, and 12-16 in media gel, respectively). Ferritin was immunoprecipitated with an anti-murine H-ferritin antibody. All samples were precleared (PC) by incubation with protein A sepharose beads alone to clear samples from nonspecific binding to the beads. Two of these samples, 4 hours of WT cell lysates and 18 hours of WT medium, where most nonspecific binding was expected, were analyzed on the gels (lanes 1). All samples were separated by SDS-PAGE and visualized by phosphorimaging.
Figure 6.
Figure 6.
Ferritin-iron cores are present in exosomes. (A) RAW264.7 macrophages were incubated for 24 hours in a mixture of OptiMEM I medium and Dulbecco’s modified Eagle medium (1:1 volume ratio) supplemented with 10% heat-inactivated fetal bovine serum, 2 mM l-glutamine, 100 U/mL penicillin, 100 μg/mL streptomycin, 1 mg/L BSA, 20 mM β-mercaptoethanol, and 100 μg/mL FAC. To precipitate exosomes, cells were harvested, and medium was collected and centrifuged at 100 000g for 1.5 hours. Samples were then separated by SDS-PAGE and analyzed by western blot with anti-ferritin L-subunit and anti-TSG101 (serving as exosomal marker) antibodies. The results of 1 out of 4 experiments are shown. (B) Exosomal samples were resuspended in 0.1% Glutaraldehyde, and a drop was mounted on an ion-coated copper grid supported by a carbon-coated film. The sample was stained with 1% uranyl acetate and visualized by TEM. Scale bar represents 100 nm. (C) Exosomal samples were captured by cryo-TEM. Vitrified unstained specimens were loaded to a Tecnai T12 G2, operating at 120 kV, and examined at a low dose to minimize radiation damage. The arrows point to iron cores. Scale bars represent 100 nm.

Similar articles

Cited by

References

    1. Anderson GJ, Vulpe CD. Mammalian iron transport. Cell Mol Life Sci. 2009;66(20):3241-3261. - PMC - PubMed
    1. Outten FW, Theil EC. Iron-based redox switches in biology. Antioxid Redox Signal. 2009;11(5):1029-1046. - PMC - PubMed
    1. Anderson GJ. Ironing out disease: inherited disorders of iron homeostasis. IUBMB Life. 2001;51(1):11-17. - PubMed
    1. Frazer DM, Anderson GJ. The regulation of iron transport. Biofactors. 2014;40(2):206-214. - PubMed
    1. Knutson M, Wessling-Resnick M. Iron metabolism in the reticuloendothelial system. Crit Rev Biochem Mol Biol. 2003;38(1):61-88. - PubMed

Publication types

Associated data