. 2017 Dec 7;130(23):2516-2526.
doi: 10.1182/blood-2017-07-796821. Epub 2017 Oct 26.

EBV latent membrane protein 2A orchestrates p27kip1 degradation via Cks1 to accelerate MYC-driven lymphoma in mice

Affiliations

EBV latent membrane protein 2A orchestrates p27kip1 degradation via Cks1 to accelerate MYC-driven lymphoma in mice

Kamonwan Fish et al. Blood. .

Abstract

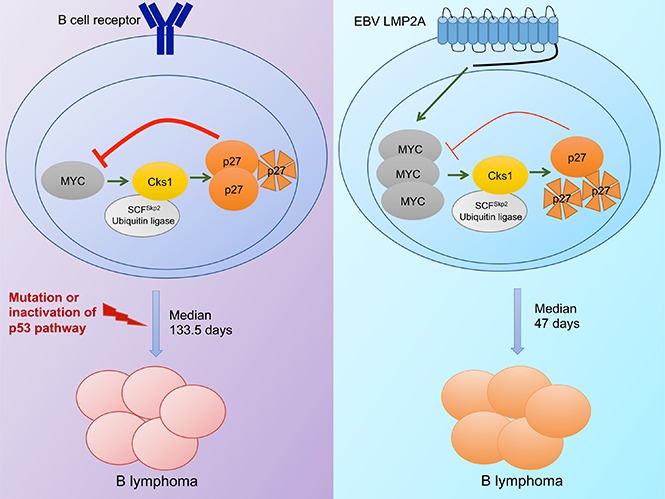
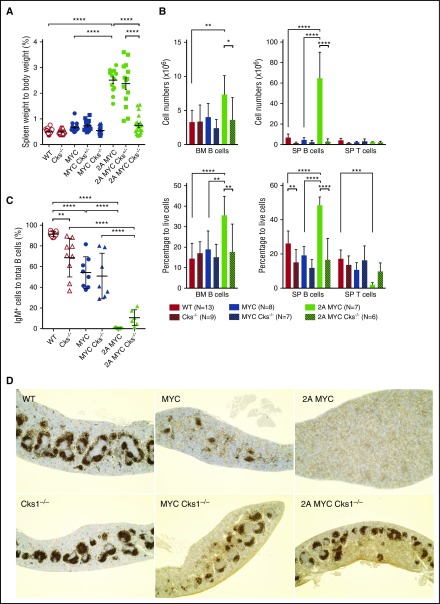
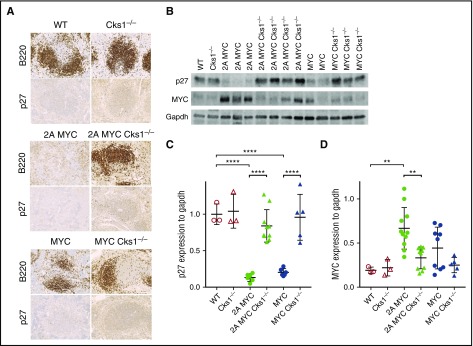
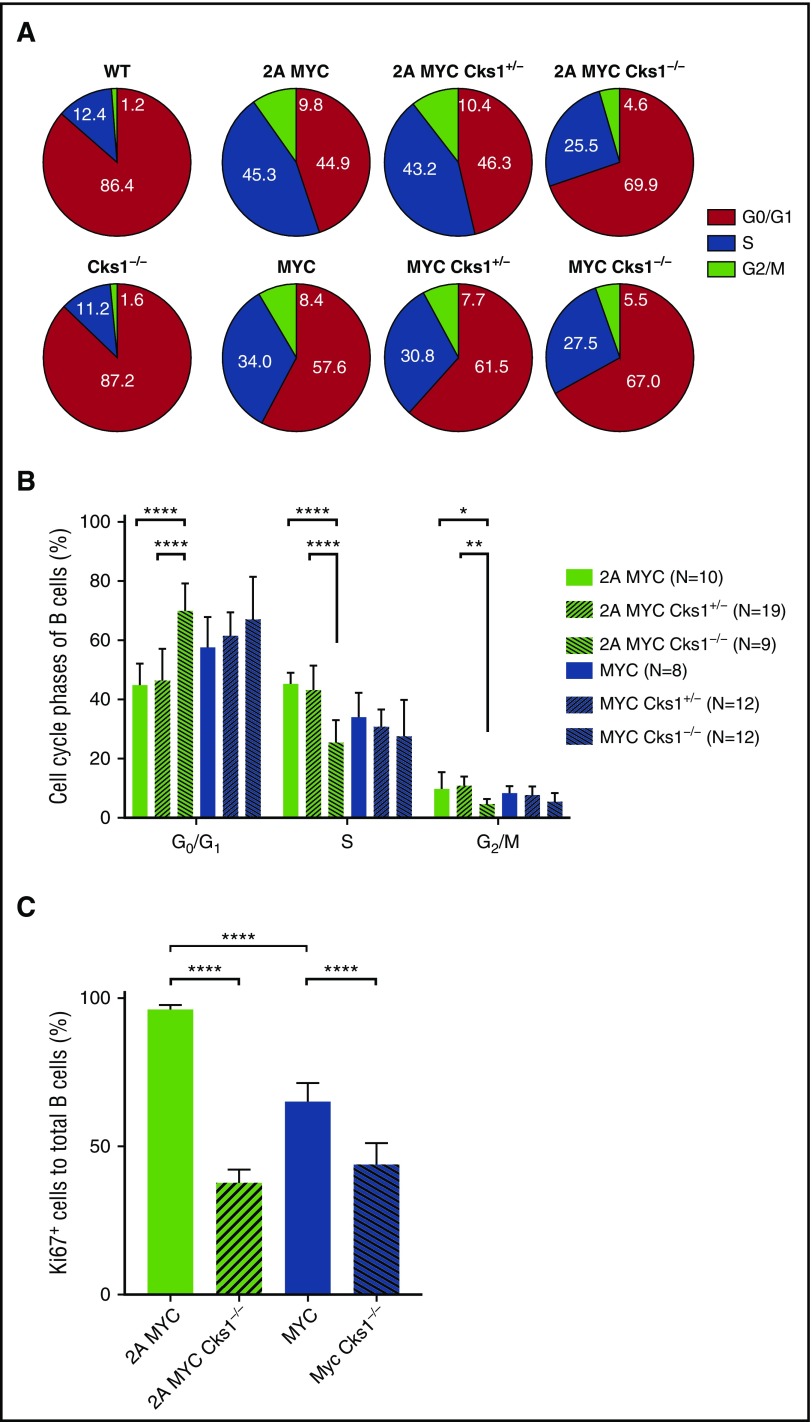
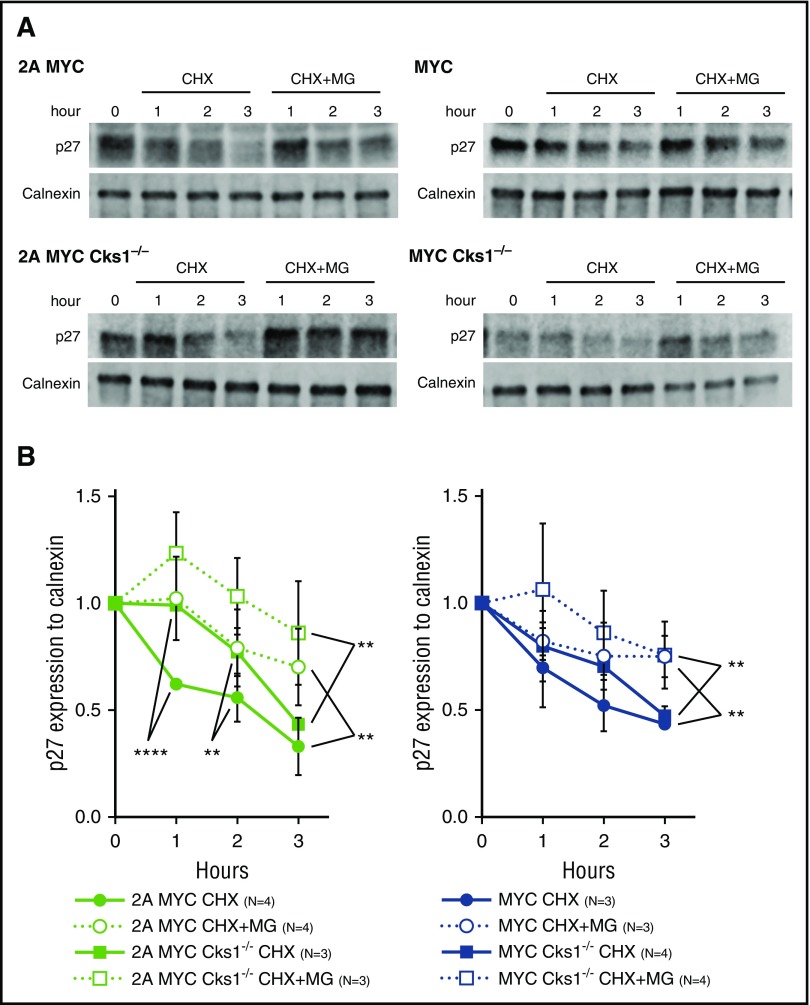
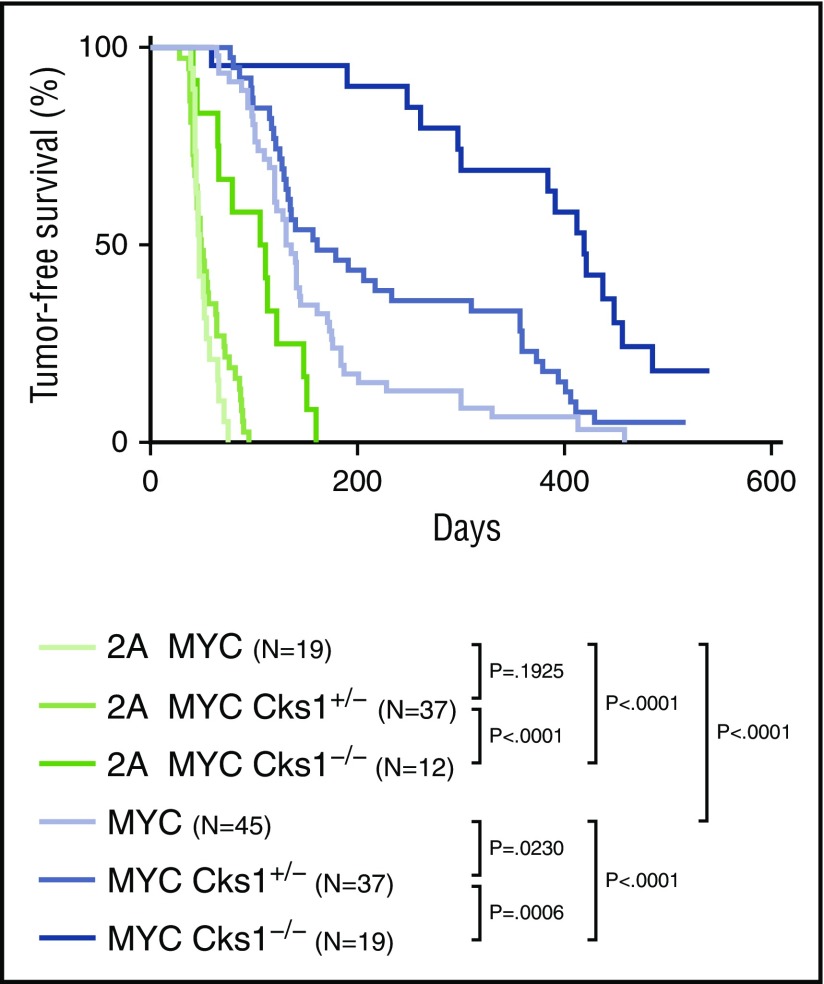
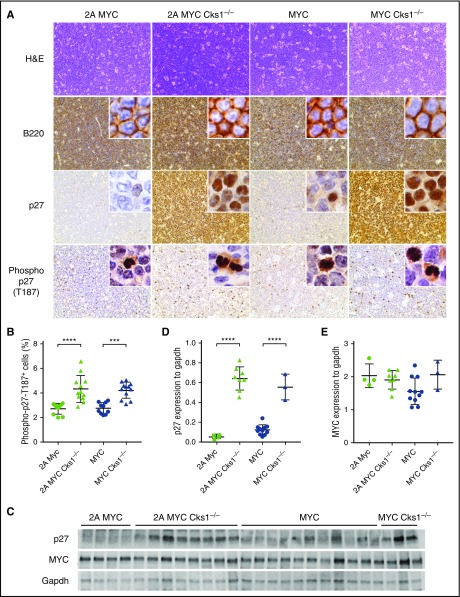
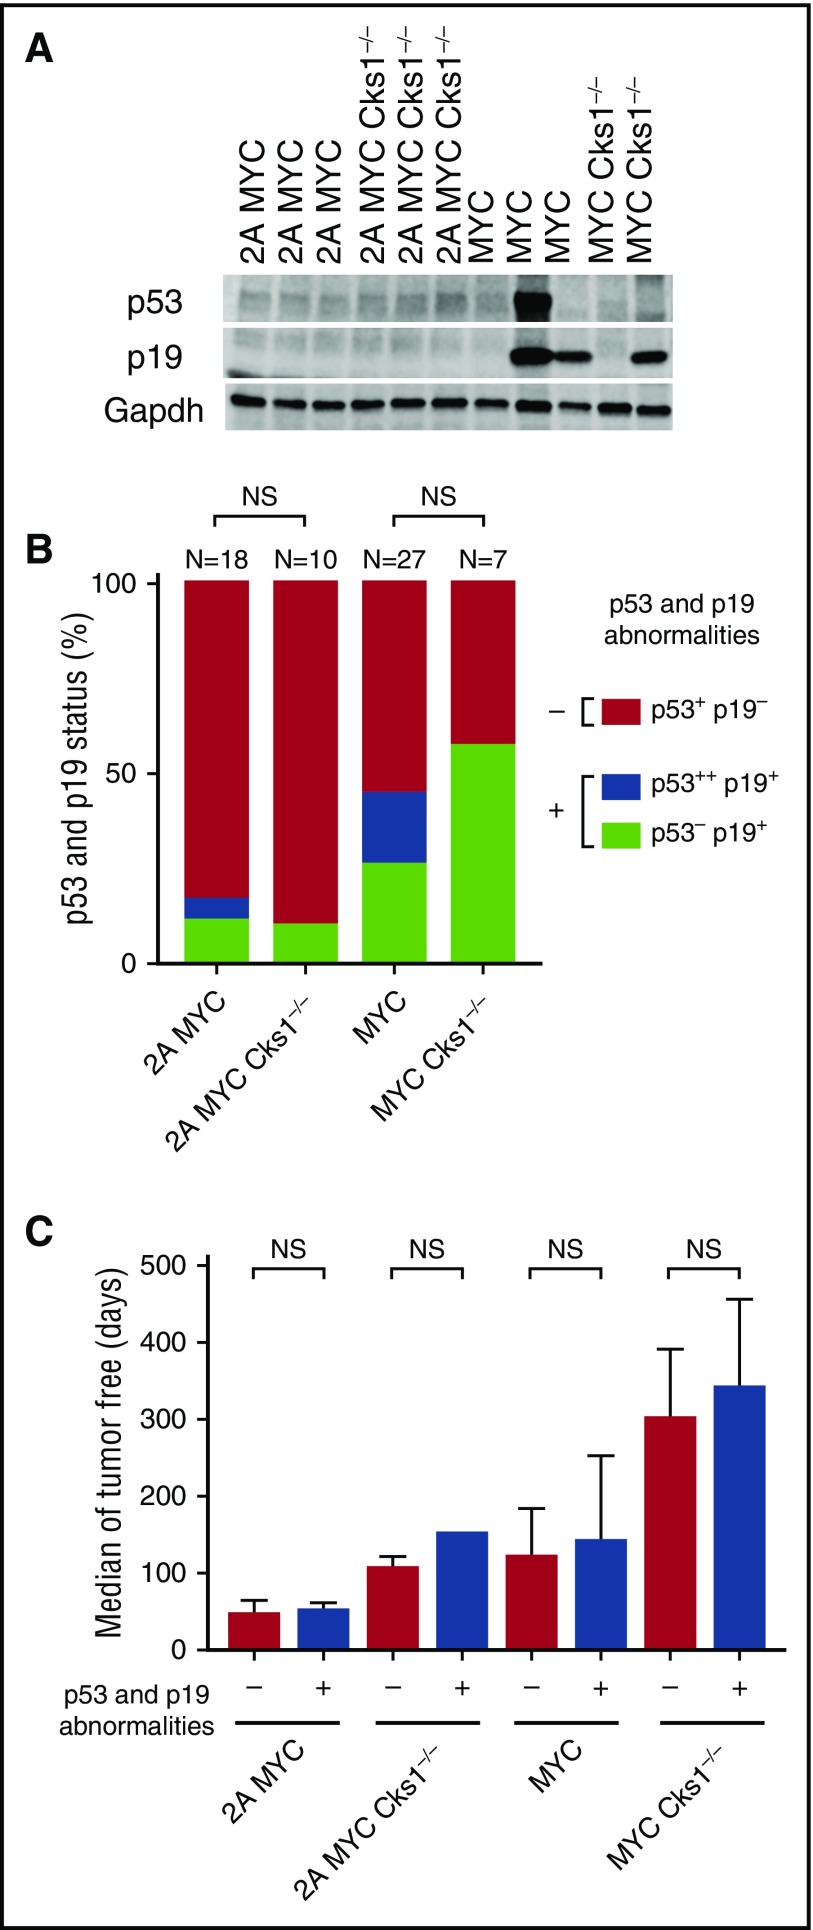
Epstein-Barr virus (EBV) establishes lifelong infection in B lymphocytes of most human hosts and is associated with several B lymphomas. During latent infection, EBV encodes latent membrane protein 2A (LMP2A) to promote the survival of B cells by mimicking host B-cell receptor signaling. By studying the roles of LMP2A during lymphoma development in vivo, we found that LMP2A mediates rapid MYC-driven lymphoma onset by allowing B cells to bypass MYC-induced apoptosis mediated by the p53 pathway in our transgenic mouse model. However, the mechanisms used by LMP2A to facilitate transformation remain elusive. In this study, we demonstrate a key role of LMP2A in promoting hyperproliferation of B cells by enhancing MYC expression and MYC-dependent degradation of the p27kip1 tumor suppressor. Loss of the adaptor protein cyclin-dependent kinase regulatory subunit 1 (Cks1), a cofactor of the SCFSkp2 ubiquitin ligase complex and a downstream target of MYC, increases p27kip1 expression during a premalignant stage. In mice that express LMP2A, Cks1 deficiency reduces spleen weights, restores B-cell follicle formation, impedes cell cycle progression of pretumor B cells, and eventually prolongs MYC-driven tumor onset. This study demonstrates that LMP2A uses the role of MYC in the cell cycle, particularly in the p27kip1 degradation process, to accelerate lymphomagenesis in vivo. Thus, our results reveal a novel mechanism of EBV in diverting the functions of MYC in malignant transformation and provide a rationale for targeting EBV's roles in cell cycle modulation.


Conflict of interest statement

Conflict-of-interest disclosure: The authors declare no competing financial interests.

Figures

None
Graphical abstract
Figure 1.
Figure 1.
Cks1 knockout decreases the pretumor B-cell population in LMP2A/λ-MYC mice. (A) Spleens were isolated from 4-week-old mice at the pretumor stage, and spleen weights as a percentage of whole body weight are indicated. (B) Lymphocytes were isolated from the bone marrow (BM) and spleens (SP) of pretumor mice, and their B- and T-cell numbers and percentages were calculated by flow cytometry stained with B220-allophycocyanin and CD3ε- phycoerythrin antibodies. Data represent the mean ± standard deviation. (C) The percentage of IgM-positive cells to total splenic B cells were calculated by staining with IgM-FITC antibody. (D) Representative immunohistochemical analysis of 4-week-old mouse spleens from 3 mice of each genotype stained with B220 (original magnification ×4). The statistic differences of Cks1 knockouts against their controls are indicated with thick lines. *P < .05, **P < .01, ***P < .001, ****P < .0001, calculated by 1-way ANOVA with post hoc multiple comparison tests. MYC, λ-MYC mice; 2A MYC, LMP2A/λ-MYC mice.
Figure 2.
Figure 2.
Loss of Cks1 restores p27kipexpression in pretumor spleens of LMP2A/λ-MYC and λ-MYC mice. (A) Representative immunohistochemical analysis of spleens from 4-week-old mice stained with p27kip1 (original magnification ×40). Representative B- and T-cell areas in white pulps are shown from a total of 3 mice of each genotypes. (B) Representative immunoblots of p27kip1 and MYC expression in purified splenic B cells from 4-week-old mice. (C) P27kip1 and (D) MYC expression were normalized to Gapdh (a loading control). The statistical differences of Cks1 knockouts against their controls are indicated with thick lines. Data represent the mean ± standard deviation. **P < .01, ****P < .0001, calculated by 1-way ANOVA with post hoc multiple comparison tests.
Figure 3.
Figure 3.
Cks1 deficiency inhibits pretumor B-cell proliferation in LMP2A/λ-MYC mice. The effects of Cks1 status on the cell cycle phases of purified splenic pretumor B cells from 4-week-old mice are indicated in (A) pie charts and (B) column graphs. (C) The percentages of Ki-67–positive cells in purified splenic pretumor B cells. Data were calculated by 1-way ANOVA with post hoc multiple comparison tests. The statistical differences of Cks1 knockouts against their controls are indicated with thick lines. Data represent the mean ± standard deviation. *P < .05, **P < .01, ***P < .001, and ****P < .0001.
Figure 4.
Figure 4.
Loss of Cks1 stabilizes p27kip1in a proteasome-dependent manner. (A) Representative immunoblot analyses of p27kip1 expression in purified splenic pretumor B cells from 4-week-old mice after treatment with 25 μg/mL CHX with or without 40 μM MG-132 (MG) at indicated time points at 37°C. (B) The fold reduction of p27kip1 after CHX treatment was normalized to calnexin (a loading control), and the fold reduction of p27kip1 was calculated using cells at 0 hour of each genotype as the control. Combined data from 3 to 4 different mice represent the mean ± standard deviation. **P < .01, ****P < .0001 were calculated by 2-way ANOVA with multiple comparison tests.
Figure 5.
Figure 5.
Cks1 knockout results in the delay of tumor onset in both LMP2A/λ-MYC and λ-MYC mice. Kaplan-Meier curves indicating the percentage of tumor-free survival of indicated genotypes. P values were calculated by comparing 2 genotypes by log-rank (Mantel-Cox) test.
Figure 6.
Figure 6.
P27kip1levels remain high as observed in pretumor cells of tumors from Cks1 knockout LMP2A/λ-MYC and λ-MYC mice. (A) Representative immunohistochemical analysis of lymph node tumors from 3 to 6 mice of each genotype stained with hematoxylin and eosin, B220, p27kip1, and Thr187-phosphorylated p27kip1, using an EVOS XL core microscope with ×40 magnification. Insets are tumors imaged by a Nikon Eclipse E600 microscope with ×100 magnification and oil immersion. (B) Percentage of lymphoma cells with intense nuclear staining of Thr187-phosphorylated p27kip1 in total lymphoma cells per microscopic field (×40 magnification) analyzed by ImageJ software (National Institutes of Health). (C) Immunoblots of p27kip1 and MYC expression in tumor cells. (D) P27kip1 and (E) MYC expression were normalized to Gapdh (a loading control). Data represent the mean ± standard deviation. ***P < .001, ****P < .0001, calculated by 1-way ANOVA with post hoc multiple comparison tests.
Figure 7.
Figure 7.
Cks1 knockout does not change the occurrence of p53 and/or p19ARFabnormalities in LMP2A/λ-MYC and λ-MYC tumors. The status of p53 and p19ARF expression in lymph node tumors from the indicated mouse genotype. (A) Representative immunoblots of p53 and p19ARF. (B) Combined data from several independent experiments. Statistical analyses were performed with Fisher’s exact test by comparing the frequency of p53 and p19ARF abnormalities in Cks1+/+ vs Cks1−/− within the LMP2A/λ-MYC or λ-MYC background. p53+ and p19, baseline p53 and p19ARF levels as indicated by immunoblots; p53, undetected baseline level of p53; p53++, aberrant p53 accumulation at ∼53 kDa; p19+, abnormal accumulation of p19ARF. (C) The number of tumor-free days in each indicated genotype. Medians with 95% confident intervals of ratios are indicated. Survival analyses were performed with both the log-rank (Mantel-Cox) test and Gehan-Breslow-Wilcoxon test by comparing the tumor-free days of the subgroups with (+) vs without (–) p53 and p19ARF abnormalities for each genotype. NS, not significant.

Similar articles

Cited by

References

    1. Longnecker R, Kieff E, Cohen JI. Epstein-Barr Virus. In: Knipe DM, Howley PM, eds. Fields Virology. 6th ed Philadelphia, PA: Lippincott Williams & Wilkins; 2013:1898-1959
    1. Epstein MA, Achong BG, Barr YM. Virus particles in cultured lymphoblasts from Burkitt’s lymphoma. Lancet. 1964;283(7335):702-703. - PubMed
    1. Caldwell RG, Wilson JB, Anderson SJ, Longnecker R. Epstein-Barr virus LMP2A drives B cell development and survival in the absence of normal B cell receptor signals. Immunity. 1998;9(3):405-411. - PubMed
    1. Casola S, Otipoby KL, Alimzhanov M, et al. . B cell receptor signal strength determines B cell fate. Nat Immunol. 2004;5(3):317-327. - PubMed
    1. Mancao C, Hammerschmidt W. Epstein-Barr virus latent membrane protein 2A is a B-cell receptor mimic and essential for B-cell survival. Blood. 2007;110(10):3715-3721. - PMC - PubMed

Publication types

MeSH terms

Substances