. 2017 Dec 15;28(26):3870-3880.
doi: 10.1091/mbc.E17-08-0491. Epub 2017 Oct 26.

HID-1 controls formation of large dense core vesicles by influencing cargo sorting and trans-Golgi network acidification

Affiliations

HID-1 controls formation of large dense core vesicles by influencing cargo sorting and trans-Golgi network acidification

Blake H Hummer et al. Mol Biol Cell. .

Abstract

Large dense core vesicles (LDCVs) mediate the regulated release of neuropeptides and peptide hormones. They form at the trans-Golgi network (TGN), where their soluble content aggregates to form a dense core, but the mechanisms controlling biogenesis are still not completely understood. Recent studies have implicated the peripheral membrane protein HID-1 in neuropeptide sorting and insulin secretion. Using CRISPR/Cas9, we generated HID-1 KO rat neuroendocrine cells, and we show that the absence of HID-1 results in specific defects in peptide hormone and monoamine storage and regulated secretion. Loss of HID-1 causes a reduction in the number of LDCVs and affects their morphology and biochemical properties, due to impaired cargo sorting and dense core formation. HID-1 KO cells also exhibit defects in TGN acidification together with mislocalization of the Golgi-enriched vacuolar H+-ATPase subunit isoform a2. We propose that HID-1 influences early steps in LDCV formation by controlling dense core formation at the TGN.


Figures

FIGURE 1:
FIGURE 1:
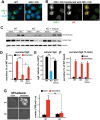
HID-1 is required for SgII storage and secretion from PC12 cells. (A) WT and HID-1 KO PC12 cells were stained with a mouse mAb to HID-1, followed by an anti-mouse antibody conjugated to Alexa Fluor 488 and mounted with Fluoromount containing DAPI. Representative confocal micrographs show the absence of HID-1 staining in HID-1 KO PC12 cells. (B) HID-1 KO PC12 cells transfected with HID-1-HA were stained with a mouse mAb to HID-1 and a rat mAb to HA, followed by an anti-mouse antibody conjugated to Alexa Fluor 488 and an anti-rat antibody conjugated to Alexa Fluor 647. Representative confocal micrographs show the presence of HID-1 staining only in cells expressing HID-1-HA. Scale bar indicates 5 μm. (C) PC12 cells (WT, HID-1 KO, or HID-1 KO transduced with HID-1-HA lentivirus) were washed and incubated for 30 min in Tyrode’s solution containing 2.5 mM K+ (basal) or 90 mM K+ (stimulated). Cellular and secreted secretogranin II (SgII) were measured by quantitative fluorescence immunoblotting (C), with the secreted SgII normalized to tubulin (D) or total SgII (F) and expressed as percentage of basal secretion in the control, and the basal cellular SgII was normalized to tubulin (E). Multiple comparison statistical analysis was performed by one-way analysis of variance (ANOVA) followed by a post hoc Tukey test: *p < 0.05; **p < 0.01 relative to KO (n = 4). No statistical difference was observed between WT and KO + rescue. The bar graphs indicate mean ± SEM. (G) WT and HID-1 KO PC12 cells were transfected with NPY-pHluorin and then imaged live by spinning disk confocal microscopy for 15 s in basal Tyrode’s solution. Regulated exocytosis was triggered by the addition of an equal volume of 90 mM K+ Tyrode’s solution (45 mM K+ final) and imaged for an additional 30 s. Images show representative maximum-intensity time projections of 150 basal and stimulated frames. At the end of the experiment, cells were imaged in Tyrode’s solution containing 50 mM NH4Cl, pH 7.4, to reveal total NPY-pHluorin fluorescence by alkalinization and identify transfected cells. Scale bar indicates 5 μm. Bar graph shows the number of exocytotic events per second normalized to cell surface area. Multiple comparison statistical analysis was performed by one-way ANOVA followed by post hoc Tukey test: **p < 0.01 relative to stimulated exocytosis from WT (n = 15 cells for WT and n = 11 cells for KO from two independent experiments).
FIGURE 2:
FIGURE 2:
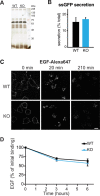
The absence of HID-1 does not impair the endolysosomal and constitutive secretory pathways. (A) Constitutive secreted fractions from unstimulated cells were analyzed by silver staining after SDS–PAGE. (B) WT and HID-1 KO PC12 cells were transiently transfected with ssGFP, washed, and incubated for 30 min in basal Tyrode’s solution. Cellular and secreted ssGFP were measured using a plate reader, with the secreted signal normalized to cellular content (n = 4). The bar graphs indicate mean ± SEM. (C, D) WT and HID-1 KO PC12 cells were incubated on ice with Alexa647-labeled EGF and chased in complete media for the indicated time before fixation. Cells were then analyzed by confocal microscopy (C). The scale bar indicates 5 μm. (D) Alternatively, mean fluorescence values were quantified by flow cytometry from >10,000 cells per experiment. The data shown indicate mean ± SEM of three independent experiments.
FIGURE 3:
FIGURE 3:
HID-1 KO cells display LDCVs with altered biochemical properties. Postnuclear supernatants obtained from WT and HID-1 KO PC12 cells were separated by equilibrium sedimentation through 0.6–1.6 M sucrose. Fractions were collected from the top of the gradient and assayed for secretogranin II (SgII) (A), synaptotagmin 1 (syt1) (B), and synaptophysin (syn) (C) by quantitative fluorescence immunoblotting. The graphs (right) quantify the immunoreactivity in each fraction as a percentage of total gradient immunoreactivity from one experiment. Similar results were observed in an additional independent experiment.
FIGURE 4:
FIGURE 4:
HID-1 KO cells show reduced LDCVs with abnormal morphology. (A) Electron micrographs (left) show a large reduction in the number of LDCVs (black arrowheads) in HID-1 KO PC12 cells relative to controls. Zoomed-in regions (denoted with white squares) are shown on the right and illustrate that the absence of HID-1 leads to LDCVs with no cores or dramatically reduced dense cores. The scale bar indicates 200 nm. Bar graphs indicate the number of LDCVs per cell section (n = 25 cells/WT and n = 21 cells/KO) (B) and the diameter of the vesicles and cores (C). Data indicate the mean ± SEM values of average diameter per cell (n = 25 cells/WT representing a total of 1944 LDCVs and n = 21 cells/KO representing a total of 498 LDCVs obtained from two independent experiments). ***p < 0.001 relative to WT.
FIGURE 5:
FIGURE 5:
HID-1 is required for TGN acidification. (A) WT and HID-1 KO PC12 cells were transfected with TGN-pHluorin (green), fixed and stained with a mouse mAb to TGN38, followed by an anti-mouse antibody conjugated to Alexa Fluor 647 (red). The scale bar indicates 5 μm. (B, C) WT and HID-1 KO PC12 cells were transfected with TGN-pHluorin and with HID-1-HA where indicated (rescue), incubated for 72 h and imaged under basal conditions. For each cell, an individual calibration curve (B) was obtained by perfusing solutions of decreasing pH (8.5–5.5) in the presence of nigericin and monensin (see Materials and Methods) and used to extrapolate absolute pH values (C). Statistical analysis of pH values was performed by ANOVA followed by a post hoc Tukey test: *p < 0.05; **p < 0.01 relative to KO (n = 17 cells for WT and KO, n = 13 cells for KO + rescue). The data shown indicate mean ± SEM. (D) Postnuclear supernatants obtained from WT and HID-1 KO PC12 cells were separated by velocity sedimentation through 0.3–1.2 M sucrose. Fractions were collected from the top of the gradient and assayed for a2 by immunoblotting. The graph (bottom) quantifies the immunoreactivity in each fraction, expressed as a percentage of total gradient immunoreactivity from one experiment. Similar results were observed in an additional independent experiment. (E) WT and HID1-1 KO PC12 cells were incubated with BafA1 (200 nM) and imaged at the indicated time points. Inset shows the change in pH observed with treatment. ***p < 0.001 relative to KO (n = 61 WT cells and 67 KO cells from two independent transfections plated on six coverslips). The data shown indicate mean ± SEM.
FIGURE 6:
FIGURE 6:
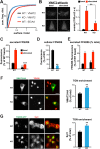
Loss of HID-1 leads to TGN enrichment of transmembrane LDCV cargoes. (A) WT and HID-1 KO PC12 cells were transfected with the indicated HA-VMAT2-GFP constructs, incubated with an HA antibody conjugated to Alexa Fluor 647 for 1 h, washed, and analyzed by flow cytometry to determine the fluorescence of individual cells. The ratios of surface (HA) to total (GFP) were computed and expressed as a cumulative frequency distribution. (B) WT and HID-1 KO PC12 cells were transfected with VMAT2-pHluorin and then imaged live by spinning disk confocal microscopy as described in Figure 1. Images show representative maximum-intensity time projections of 150 basal and stimulated frames. At the end of the experiment, cells were imaged in Tyrode’s solution containing 50 mM NH4Cl, pH 7.4, to reveal total VMAT2-pHluorin fluorescence by alkalinization and identify transfected cells. Scale bar indicates 5 μm. Bar graph shows the number of exocytotic events per second normalized to cell surface area. Statistical analysis was performed by one-way ANOVA followed by a post hoc Tukey test: **p < 0.01 relative to stimulated secretion from WT (n = 20 cells for WT, n = 16 cells for KO from two independent experiments). The data shown indicate mean ± SEM. (C–E) PC12 cells were loaded with FFN206 (a vesicular monoamine transporter fluorescent substrate) and subjected to a secretion assay as described in Figure 1. Secreted (C) and cellular (D) fluorescence values were measured using a plate reader. (E) Secreted FFN206 was expressed as a percentage of total FFN206 fluorescence. Statistical analysis was performed by one-way ANOVA followed by a post hoc Tukey test: **p < 0.01 relative to basal secretion from WT; ***p < 0.001 relative to stimulated secretion from WT (n = 8). The bar graphs indicate mean ± SEM. (F) WT and HID-1 KO PC12 cells were transfected with VMAT2-HA, fixed, and stained with HA and TGN38 antibodies followed by Alexa Fluor 488- and Alexa Fluor 647-conjugated secondary antibodies or (G) WT and HID-1 KO PC12 cells were transfected with TGN38-GFP, fixed, and stained with Syt1 antibody followed by Alexa Fluor 647-conjugated secondary antibody. The cells were imaged by spinning-disk confocal microscopy. The amount of HA (F) or Syt1 (G) immuno­reactivity overlapping with TGN38 was expressed as a percentage of total fluorescence: **p < 0.001 relative to WT (for Syt1, n = 20 cells for WT and n = 16 cells for KO; for VMAT2, n = 26 cells for WT and n = 38 cells for KO from two independent experiments). The scale bars indicate 5 μm. The data shown indicate mean ± SEM.
FIGURE 7:
FIGURE 7:
Proposed model for the function of HID-1 at the TGN. HID-1 acts as a gatekeeper preventing a2 from diffusing out of the TGN. Loss of HID-1 prevents TGN acidification, which in turn impairs LDCV soluble cargo condensation and dense core formation. Disruption of protein aggregation leads to diffusion of soluble LDCV cargoes throughout the endomembrane system with a portion being routed to the lysosome for degradation. Inefficient core formation effectively reduces the number of budding LDCVs and causes LDCV-resident transmembrane proteins to accumulate at the TGN. Alternatively, defective LDCVs could be degraded by crinophagy.

Similar articles

Cited by

References

    1. Ailion M, Hannemann M, Dalton S, Pappas A, Watanabe S, Hegermann J, Liu Q, Han HF, Gu M, Goulding MQ, et al. Two Rab2 interactors regulate dense-core vesicle maturation. Neuron. 2014;82:167–180. - PMC - PubMed
    1. Anderson RG, Pathak RK. Vesicles and cisternae in the trans Golgi apparatus of human fibroblasts are acidic compartments. Cell. 1985;40:635–643. - PubMed
    1. Argiolas A, Melis MR. Neuropeptides and central control of sexual behaviour from the past to the present: a review. Prog Neurobiol. 2013;108:80–107. - PubMed
    1. Arvan P, Halban PA. Sorting ourselves out: seeking consensus on trafficking in the beta-cell. Traffic. 2004;5:53–61. - PubMed
    1. Asensio CS, Sirkis DW, Edwards RH. RNAi screen identifies a role for adaptor protein AP-3 in sorting to the regulated secretory pathway. J Cell Biol. 2010;191:1173–1187. - PMC - PubMed

LinkOut - more resources