. 2018 Jan;38(1):218-231.
doi: 10.1161/ATVBAHA.117.309660. Epub 2017 Oct 26.

Δ-5 Fatty Acid Desaturase FADS1 Impacts Metabolic Disease by Balancing Proinflammatory and Proresolving Lipid Mediators

Affiliations

Δ-5 Fatty Acid Desaturase FADS1 Impacts Metabolic Disease by Balancing Proinflammatory and Proresolving Lipid Mediators

Anthony D Gromovsky et al. Arterioscler Thromb Vasc Biol. 2018 Jan.

Abstract

Objective: Human genetic variants near the FADS (fatty acid desaturase) gene cluster (FADS1-2-3) are strongly associated with cardiometabolic traits including dyslipidemia, fatty liver, type 2 diabetes mellitus, and coronary artery disease. However, mechanisms underlying these genetic associations are unclear.

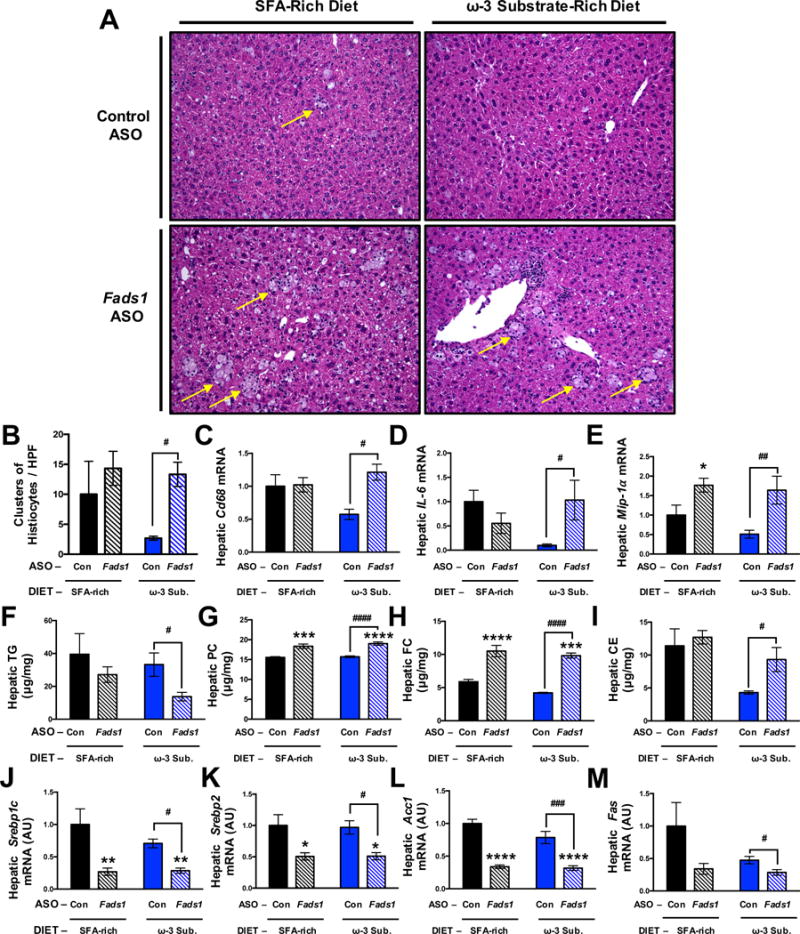
Approach and results: Here, we specifically investigated the physiological role of the Δ-5 desaturase FADS1 in regulating diet-induced cardiometabolic phenotypes by treating hyperlipidemic LDLR (low-density lipoprotein receptor)-null mice with antisense oligonucleotides targeting the selective knockdown of Fads1. Fads1 knockdown resulted in striking reorganization of both ω-6 and ω-3 polyunsaturated fatty acid levels and their associated proinflammatory and proresolving lipid mediators in a highly diet-specific manner. Loss of Fads1 activity promoted hepatic inflammation and atherosclerosis, yet was associated with suppression of hepatic lipogenesis. Fads1 knockdown in isolated macrophages promoted classic M1 activation, whereas suppressing alternative M2 activation programs, and also altered systemic and tissue inflammatory responses in vivo. Finally, the ability of Fads1 to reciprocally regulate lipogenesis and inflammation may rely in part on its role as an effector of liver X receptor signaling.

Conclusions: These results position Fads1 as an underappreciated regulator of inflammation initiation and resolution, and suggest that endogenously synthesized arachidonic acid and eicosapentaenoic acid are key determinates of inflammatory disease progression and liver X receptor signaling.

Keywords: atherosclerosis; eicosanoids; lipogenesis; macrophages; metabolic diseases.


Conflict of interest statement

DISCLOSURES

A.D.G., R.C.S., A.L.B., R.N.H., A.C.B., D.F., R.Z., B.E.S., R.E.M., D.S.A., J.S.P., M.S., and J.M.B. all have no conflicts of interest to declare. R.G.L. is an employee at Ionis Pharmaceuticals, Inc. (Carlsbad, CA).

Figures

Figure 1
Figure 1. Fads1 is a Key Determinant of Membrane Phospholipid Composition and Pro-Inflammatory Versus Pro-Resolving Lipid Mediator Balance
(A) qPCR quantification of hepatic Fads1, Fads2, and Fads3 mRNA; n=5 per group. (B–C) FADS1 substrate (ω-6 dihomo-g-linolenic acid, DGLA and ω-3 eicosatetraenoic acid, ETA) and product (ω-6 arachidonic acid, AA and ω-3 eicosapentaenoic acid, EPA) fatty acid concentrations in plasma; n=6 per group. (D) Total hepatic phospholipid fatty acid composition, n=5 per group. (E) Hepatic phosphatidylethanolamine (PE) species 38:4 and 36:5, n=5 per group. (F) Volcano plot of all metabolites detected with the larger circles that are labeled representing metabolites that exceed the minimum thresholds for significance (p<0.05) and fold change (> or <2). Lipid mediators that were significantly increased in ω-3 diet-fed animals are blue and appear in the shaded region while those that were significantly decreased are white; n=5 per group. (G) Volcano plot of all metabolites detected with the larger circles that are labeled representing metabolites that exceed the minimum threshold for significance (p<0.05) and fold change (> or <2). Lipid mediators that were significantly decreased by Fads1 ASO are white and appear in the shaded region while those that significantly increased are blue; n=5 per group. (H) Partial least squares-discriminant analysis two-dimensional scores plot demonstrated clustering of samples into distinct and separate groups based on both diet and ASO. (I) Venn diagram displaying the lipid mediators that were significantly increased by ω-3 diet with control ASO in the blue circle and those that were significantly decreased by Fads1 ASO while on ω-3 diet in the gray circle. Those metabolites in the overlapping region both increased on ω-3 diet and were decreased by Fads1 ASO; n=5 per group. (J) (Left) Combined levels of 5-lipoxygenase (5-LOX)-derived specialized pro-resolving lipid mediators (SPM) are shown for each diet and treatment group. SPM included in this index are resolvin (Rv) D1, 17R-RvD1, RvD2, 17R-RvD3, RvD4, RvD6, RvE1, RvE2, lipoxin (LX) A4, 15R-LXA4, LXA5, LXB4 and LXB5; n=5 per group. Graph displays mean ± S.E.M. (Middle) Levels of leukotriene B4 (LTB4). Only one of the five samples in the group fed a control diet and treated with Fads1 ASO contained LTB4 above the limit of detection (0.1 pg) and thus the entire group was omitted; n=3–5 per group. Graph displays mean ± S.E.M. Statistical significance is determined by t-test. # p<0.05 control ASO vs Fads1 ASO. (Right) The ratio of 5-LOX-derived SPM to LTB4 is shown for mice on ω-3 rich diet exposed to control or Fads1 ASO; n=5 per group. Graph displays mean ± S.E.M. Statistical significance is determined by t-test. # p<0.05 control ASO vs Fads1 ASO). For panels A–C and E, graphs display mean ± S.E.M. Statistical significance is determined by 2-way ANOVA. * = significantly different from the control ASO – saturated and monounsaturated fatty acid (SFA)-rich diet group (*p<0.05, **p<0.01, ***p<0.001, ****p<0.0001); # = significantly different from control ASO group within the ω-3 substrate diet group (#p<0.05, ##p<0.01, ###p<0.001, ####p<0.0001).
Figure 2
Figure 2. Fads1 is a Critical Regulator of Hepatic Inflammation and Lipogenesis
(A) H&E-stained liver sections show enhanced immune cell invasion characterized mainly by foamy histiocytes in the context of Fads1 knockdown (shown at 200x magnification); Arrows indicate areas of foamy histiocytes. (B) Pathologist quantified foamy histiocyte clusters per 40x field, n=3 per group. (C–E) Hepatic expression of macrophage genes including cluster of differentiation 68 (Cd68), interleukin 6 (IL-6), and macrophage inflammatory protein 1α (Mip-1α); n=5 per group. (F–I) Total hepatic triglycerides (TG), phosphatidylcholine (PC), free cholesterol (FC), and cholesteryl ester (CE); n=6 per group. (J–M) Hepatic expression of lipogenic genes including sterol regulatory element-binding proteins 1c (Srebp1c) and 2 (Srebp2), acetyl-CoA carboxylase 1 (Acc1), and fatty acid synthase (Fas); n=5 per group. All graphs display mean ± S.E.M. Statistical significance is determined by 2-way ANOVA. * = significantly different from the control ASO – saturated and monounsaturated fatty acid (SFA)-rich diet group (*p<0.05, **p<0.01, ***p<0.001, ****p<0.0001); # = significantly different from control ASO group within the ω-3 substrate diet group (#p<0.05, ##p<0.01, ###p<0.001, ####p<0.0001).
Figure 3
Figure 3. Fads1 Knockdown Promotes Dyslipidemia, Alters Leukocyte Populations, and Increases Atherosclerosis in a Diet-Specific Manner
(A) Representative Oil Red O stained (with hematoxylin counterstain) aortic root cross-sections. (B) Quantification of aortic root lesion area; n=7–10 per group. (C) Total free cholesterol (FC) content in mouse aortas; n=8–10 per group. (D) Total cholesteryl ester (CE) content in mouse aortas; n=8–10 per group. (E) Representative hematoxylin & eosin stained aortic root cross-sections. (F) Quantification of necrotic core area; n=8–10 per group. (G) Plasma total triglyceride (TG) and total plasma cholesterol (TPC); n=6 per group. (H–J) Very low-density lipoprotein (VLDL), low-density lipoprotein (LDL), and high-density lipoprotein (HDL) cholesterol levels after 16 weeks of diet and ASO treatment; n=4 per group. (K–P) Flow cytometric detection of circulating leukocyte populations; n=6 per group. All graphs display mean ± S.E.M. Statistical significance is determined by 2-way ANOVA. * = significantly different from the control ASO – saturated and monounsaturated fatty acid (SFA)-rich diet group (*p<0.05, **p<0.01, ***p<0.001, ****p<0.0001); # = significantly different from control ASO group within the ω-3 substrate diet group (#p<0.05, ##p<0.01, ###p<0.001, ####p<0.0001).
Figure 4
Figure 4. Fads1 Knockdown Promotes Classic M1 Activation and Suppresses Alternative M2 Activation Programs in Macrophages
Low-density lipoprotein receptor-knockout mice were treated with ASOs and the saturated and monounsaturated fatty acid (SFA)-rich diet for 8 weeks, and then primary macrophages were elicited from the peritoneal cavity for functional characterization. (A–E) Macrophages isolated from control and Fads1 ASO-treated mice were stimulated with 50 ng/ml lipopolysaccharide (LPS). 6 hours later gene expression was quantified by qPCR; n=4 per group. (F–J) Macrophages isolated from control and Fads1 ASO-treated mice were stimulated with 10 ng/ml interleukin 4 (IL-4). 6 hours later gene expression was quantified by qPCR; n=4 per group. (K) Conditioned media was collected from non-stimulated macrophages for LC-MS/MS detection of lipid mediators; n=4 per group. All graphs display mean ± S.E.M. For panels A–J, statistical significance is determined by 2-way ANOVA. * = significantly different from the control ASO – vehicle stimulus group (*p<0.05, **p<0.01, ***p<0.001, ****p<0.0001); # = significantly different from control ASO group within the LPS or IL-4 treatment group (#p<0.05, ##p<0.01, ###p<0.001, ####p<0.0001). For panel K, statistical significance is determined by t-test. * = significantly different from control ASO group (*p<0.05, **p<0.01).
Figure 5
Figure 5. Fads1 Knockdown Alters Systemic Inflammation In Vivo
(A) Acute phase TNF-α levels in plasma 1 hour after Veh/LPS/IL-4 stimulation in mice fed diet and treated with ASOs for 8 weeks; n=3 per group. (B–D) Terminal cytokine levels in plasma 6 hours after Veh/LPS/IL-4 stimulation; n=3 per group. (E–L) qPCR quantification of hepatic gene expression; n=3 per group. (M–T) qPCR quantification of aortic arch gene expression; n=3 per group. All graphs display mean ± S.E.M. Statistical significance is determined by t-test. * = significantly different from control ASO group within the same diet group (*p<0.05).
Figure 6
Figure 6. Fads1 is an Effector of LXR-Driven Reorganization of Lipid Metabolism
Chow-fed C57BL/6J mice were treated with control or Fads1 ASO for 10 consecutive weeks, and then were also gavaged daily with Vehicle or T0901317 (25 mg/kg/day) during the tenth week; n=6 per group. (A) Total fecal neutral sterol loss from mice fed chow and treated with ASOs for 10 weeks. (B) Total hepatic triglycerides (TG); n=6 per group. (C) Hepatic free cholesterol (FC); n=6 per group. (D) Hepatic cholesteryl ester (CE); n=6 per group. (E) Hepatic total cholesterol (TC); n=6 per group. (F) Total plasma cholesterol in mice fed chow and treated with ASOs for 10 weeks; n-6 per group. (G–R) qPCR quantification of hepatic gene expression, n=6 per group. All graphs display mean ± S.E.M. Statistical significance is determined by 2-way ANOVA. * = significantly different from the control ASO – vehicle gavage group (*p<0.05, **p<0.01, ***p<0.001, ****p<0.0001); # = significantly different from control ASO group within the T0901317 gavage group (#p<0.05, ##p<0.01, ###p<0.001, ####p<0.0001).

Comment in

Similar articles

Cited by

References

    1. Everett BM, Smith RJ, Hiatt WR. Reducing ldl with pcsk9 inhibitors – the clinical benefit of lipid drugs. N Engl J Med. 2015;373:1588–1591. doi: 10.1056/NEJMc1509961. - DOI - PubMed
    1. Teslovich TM, Musunuru K, Smith AV, et al. Biological, clinical and population relevance of 95 loci for blood lipids. Nature. 2010;466:707–713. doi: 10.1038/nature09270. - DOI - PMC - PubMed
    1. Lettre G, Palmer CD, Young T, et al. Genome-wide association study of coronary heart disease and its risk factors in 8,090 african americans: The nhlbi care project. PLoS Genet. 2011;7:e1001300. doi: 10.1371/journal.pgen.1001300. - DOI - PMC - PubMed
    1. Sabatti C, Service SK, Hartikainen AL, et al. Genome-wide association analysis of metabolic traits in a birth cohort from a founder population. Nat Genet. 2009;41:35–46. doi: 10.1038/ng.271. - DOI - PMC - PubMed
    1. Dupuis J, Langenberg C, Prokopenko I, et al. New genetic loci implicated in fasting glucose homeostasis and their impact on type 2 diabetes risk. Nat Genet. 2010;42:105–116. doi: 10.1038/ng.520. - DOI - PMC - PubMed

Publication types

MeSH terms